Effects of hemoglobin concentration on cardiac output The
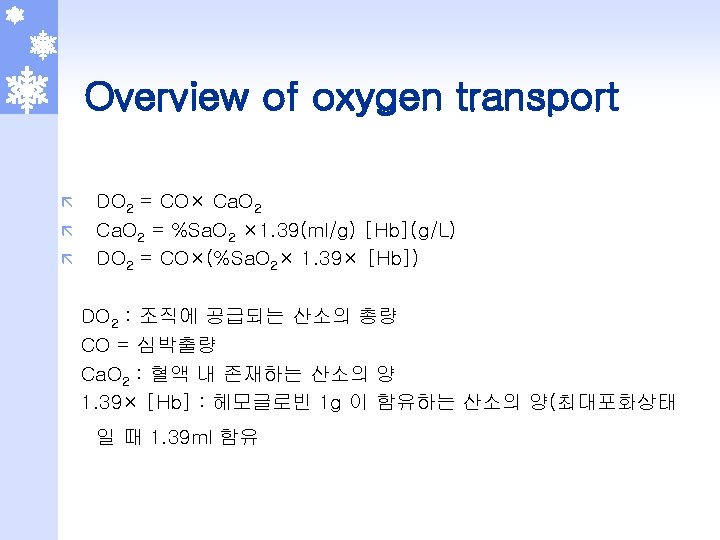


Effects of hemoglobin concentration on cardiac output. The series of curves illustrate how cardiac output will increase as hemoglobin concentration decreases. The solid curve describes the increase in healthy adult. The top dashed line shows how the cardiac output response may be accentuated in a young athlete, the lower dashed line might correspond to someone with poor cardiovascular function.

O 2 consumption to O 2 delivery relationship. The solid line demonstrates the biphasic relationship between O 2 consumption and O 2 delivery. The dashed line illustrates the postulated changes in the relationship with diseases such as sepsis and ARDS. The anaerobic threshold is shifted to the right, suggesting that patients require increased levels of O 2 delivery to avoid ongoing ischemic damage to vital organs.

Adaptation to anemia ã ã ã Shift in the oxyhemoglobin dissociation curve Hemodynamic alterations Microcirculatory alterations

Oxyhemoglobin dissociation curve

Oxyhemoglobin dissociation curve

Hemodynamic alterations Sympathetic tone ↑ →→ ã ã Myocardial contractility ↑ Heart rate ↑ Arterial and venous vascular tone ↑ Cardiac output away from the splanchnic, skeletal, and skin circulation toward the coronary and cerebral circulation.

Microcirculatory effects of anemia ã Recruitment of previously closed capillaries ã Capillary flow ↑(blood viscosity↓→→ flow velocities of red cells through capillary↑ ) O 2 extraction from existing capillaries ↑ ã

Summary

Summary ã ã The most important adaptive responses to anemia : elevation of the cardiac output and its redistribution to favor the coronary and cerebral circulations, at the expense of the splanchnic vascular beds. Critical DO 2 (Critical hematocrit) is ? (4 -5 g/d. L ? )
- Slides: 12