
Effects of Climate Change on the Hydrologic Cycle
- Slides: 33
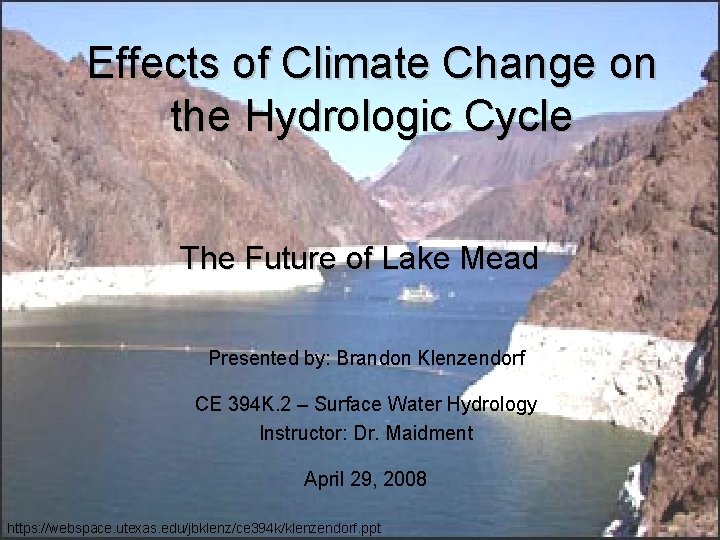
Effects of Climate Change on the Hydrologic Cycle The Future of Lake Mead Presented by: Brandon Klenzendorf CE 394 K. 2 – Surface Water Hydrology Instructor: Dr. Maidment April 29, 2008 https: //webspace. utexas. edu/jbklenz/ce 394 k/klenzendorf. ppt
Outline • Introduction • Colorado River Basin and Lake Mead Characteristics • Climate Change Characteristics • Summary and Conclusions 2
Introduction • Project motivation: – Barnett and Pierce (2008), “When Will Lake Mead Go Dry? ” article attributes global warming to low lake levels. Is this true? !? – Q: What do I know about climate change? A: Not much! • Problems to investigate: – Current conditions of Colorado River Basin and review of literature and causes of low lake levels – Results of climate change on hydrologic cycle and movement of atmospheric water 3
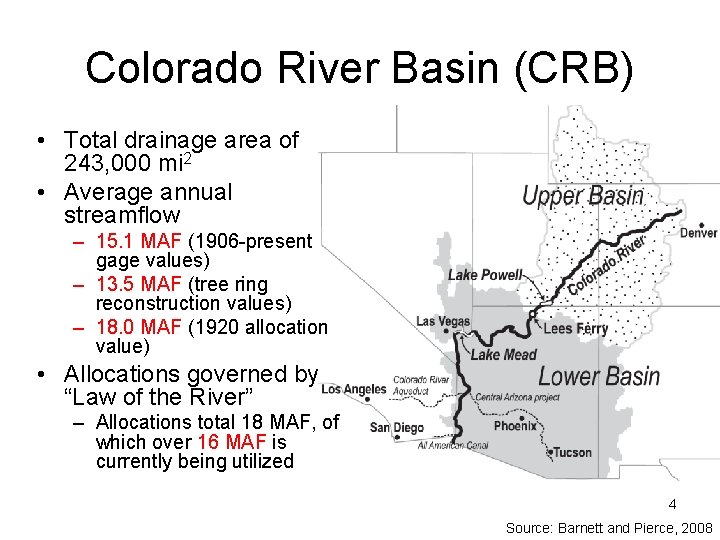
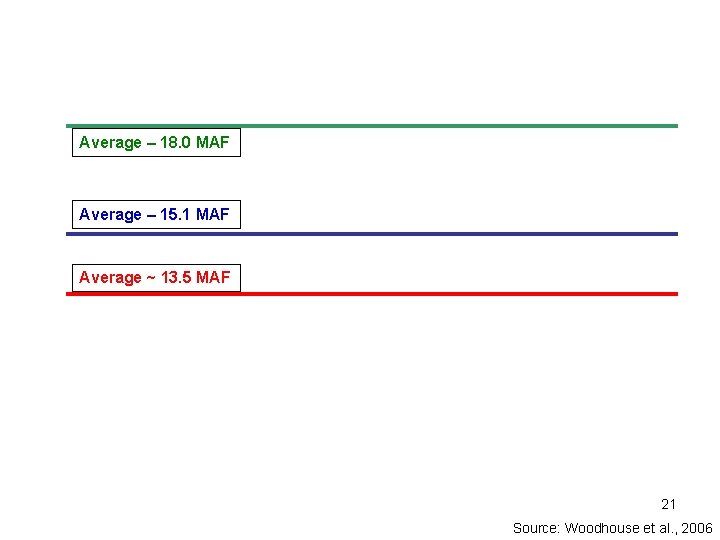
Colorado River Basin (CRB) • Total drainage area of 243, 000 mi 2 • Average annual streamflow – 15. 1 MAF (1906 -present gage values) – 13. 5 MAF (tree ring reconstruction values) – 18. 0 MAF (1920 allocation value) • Allocations governed by “Law of the River” – Allocations total 18 MAF, of which over 16 MAF is currently being utilized 4 Source: Barnett and Pierce, 2008
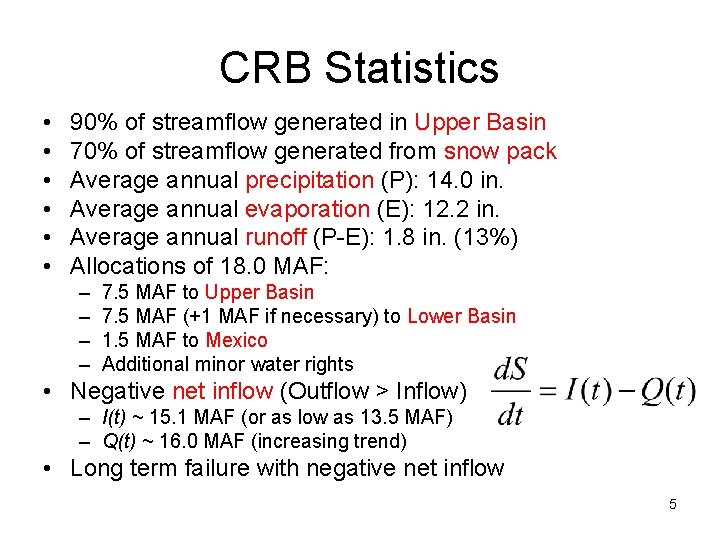
CRB Statistics • • • 90% of streamflow generated in Upper Basin 70% of streamflow generated from snow pack Average annual precipitation (P): 14. 0 in. Average annual evaporation (E): 12. 2 in. Average annual runoff (P-E): 1. 8 in. (13%) Allocations of 18. 0 MAF: – – 7. 5 MAF to Upper Basin 7. 5 MAF (+1 MAF if necessary) to Lower Basin 1. 5 MAF to Mexico Additional minor water rights • Negative net inflow (Outflow > Inflow) – I(t) ~ 15. 1 MAF (or as low as 13. 5 MAF) – Q(t) ~ 16. 0 MAF (increasing trend) • Long term failure with negative net inflow 5
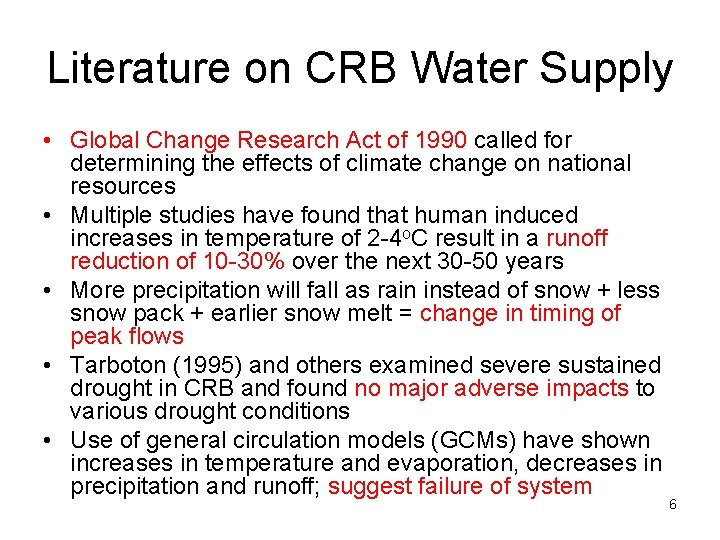
Literature on CRB Water Supply • Global Change Research Act of 1990 called for determining the effects of climate change on national resources • Multiple studies have found that human induced increases in temperature of 2 -4 o. C result in a runoff reduction of 10 -30% over the next 30 -50 years • More precipitation will fall as rain instead of snow + less snow pack + earlier snow melt = change in timing of peak flows • Tarboton (1995) and others examined severe sustained drought in CRB and found no major adverse impacts to various drought conditions • Use of general circulation models (GCMs) have shown increases in temperature and evaporation, decreases in precipitation and runoff; suggest failure of system 6
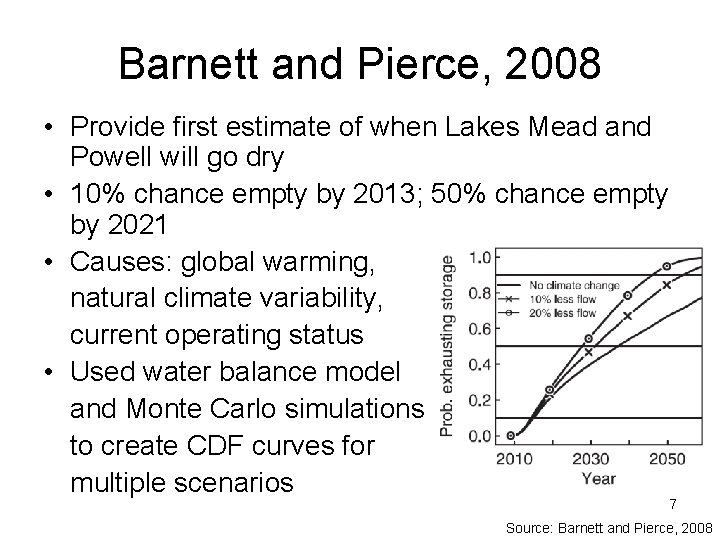
Barnett and Pierce, 2008 • Provide first estimate of when Lakes Mead and Powell will go dry • 10% chance empty by 2013; 50% chance empty by 2021 • Causes: global warming, natural climate variability, current operating status • Used water balance model and Monte Carlo simulations to create CDF curves for multiple scenarios 7 Source: Barnett and Pierce, 2008
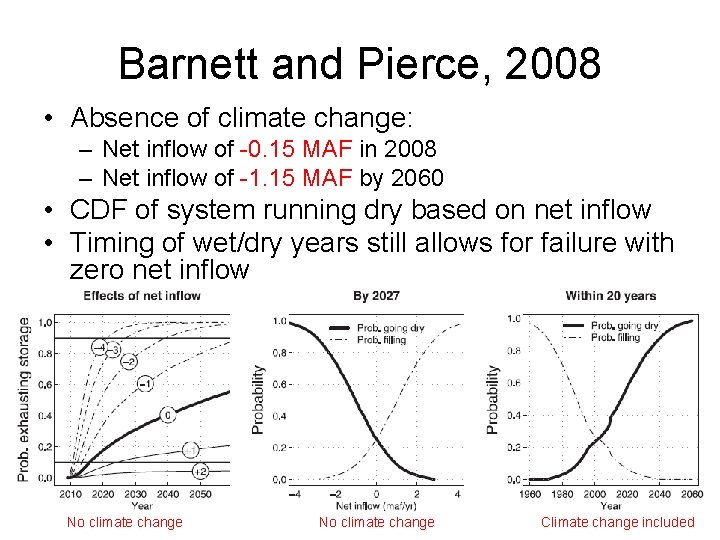
Barnett and Pierce, 2008 • Absence of climate change: – Net inflow of -0. 15 MAF in 2008 – Net inflow of -1. 15 MAF by 2060 • CDF of system running dry based on net inflow • Timing of wet/dry years still allows for failure with zero net inflow No climate change 8 Climate change included
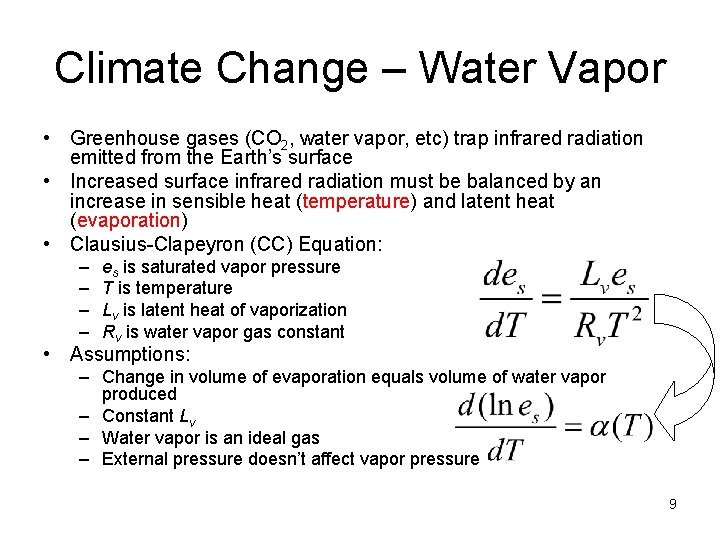
Climate Change – Water Vapor • Greenhouse gases (CO 2, water vapor, etc) trap infrared radiation emitted from the Earth’s surface • Increased surface infrared radiation must be balanced by an increase in sensible heat (temperature) and latent heat (evaporation) • Clausius-Clapeyron (CC) Equation: – – es is saturated vapor pressure T is temperature Lv is latent heat of vaporization Rv is water vapor gas constant • Assumptions: – Change in volume of evaporation equals volume of water vapor produced – Constant Lv – Water vapor is an ideal gas – External pressure doesn’t affect vapor pressure 9
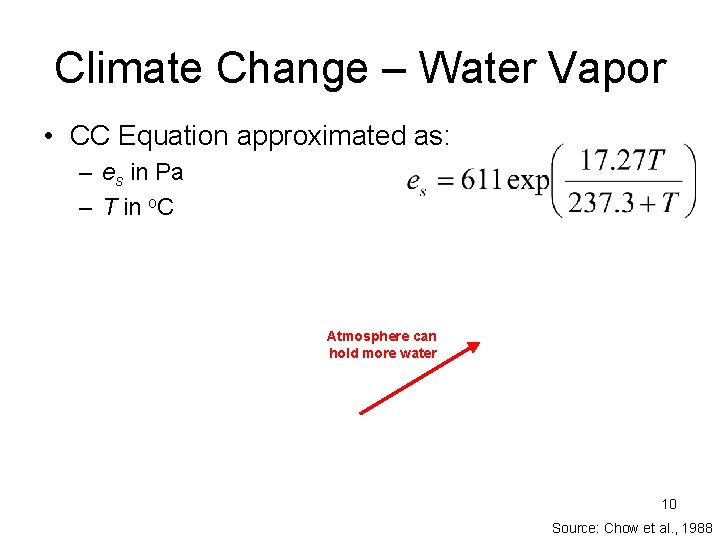
Climate Change – Water Vapor • CC Equation approximated as: – es in Pa – T in o. C Atmosphere can hold more water 10 Source: Chow et al. , 1988
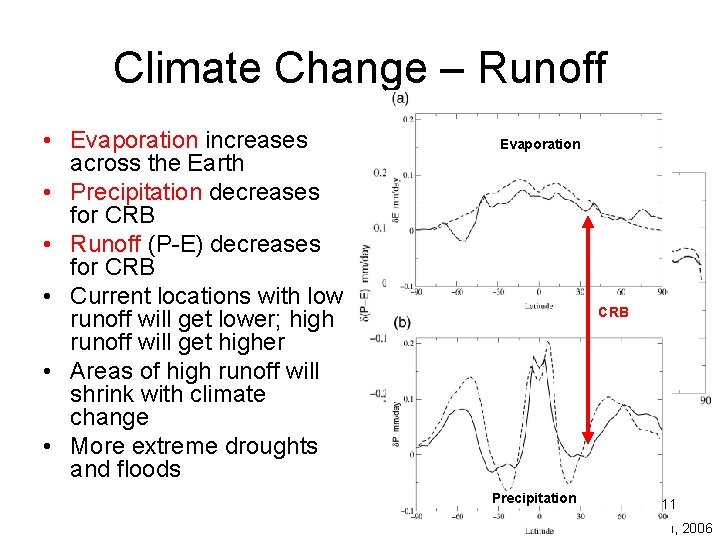
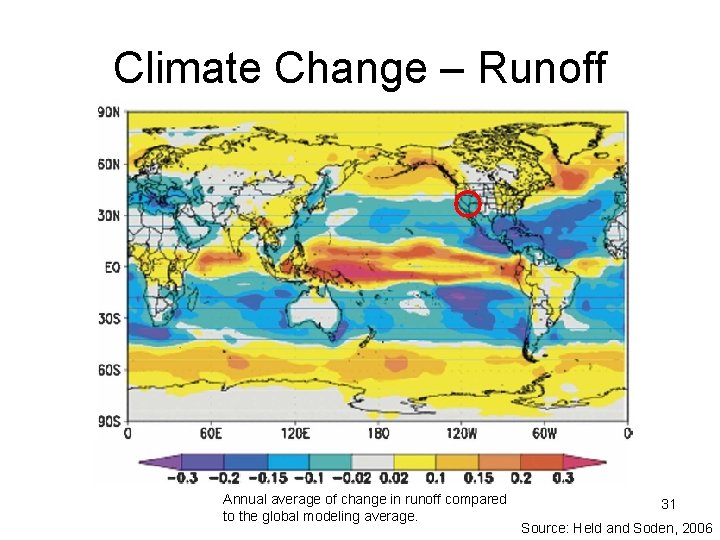
Climate Change – Runoff • Evaporation increases across the Earth • Precipitation decreases for CRB • Runoff (P-E) decreases for CRB • Current locations with low runoff will get lower; high runoff will get higher • Areas of high runoff will shrink with climate change • More extreme droughts and floods Evaporation CRB Runoff CRB Model predictions of change in runoff for double CO 2 concentrations. Precipitation 11 Source: Held and Soden, 2006
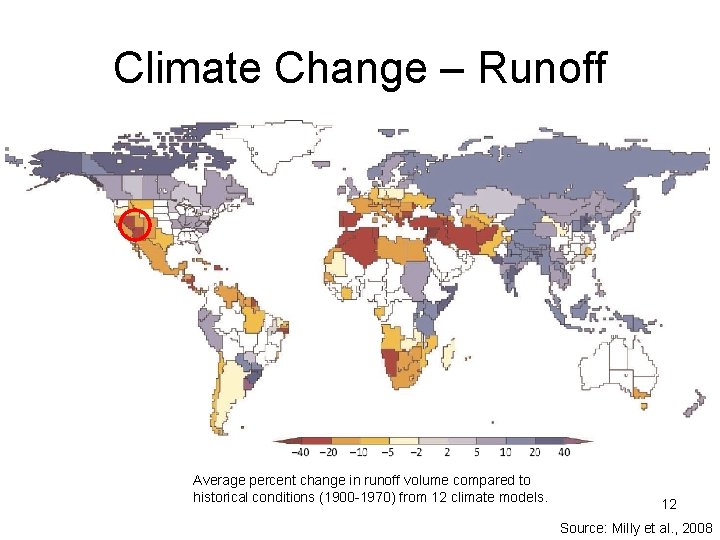
Climate Change – Runoff Average percent change in runoff volume compared to historical conditions (1900 -1970) from 12 climate models. 12 Source: Milly et al. , 2008
Summary • Colorado River Basin Summary – CRB reservoir system will likely fail due to allocations greater than streamflow – Main problem is recent change to negative net inflow due to increased water usage – Climate change will only make the situation worse • Climate Change Summary – Increased temperature allows atmosphere to hold more water vapor – Increased evaporation in CRB – Decreased runoff in CRB 13
Conclusion • Climate change will hurt the reliability of reservoir system in the CRB. However, the major problem is over allocation of the river, and this problem is what should be addressed. • Take home message: Can’t blame global warming for everything! 14
• • • Works Cited Barnett, T. P. and D. W. Pierce (2008): “When Will Lake Mead go Dry? ”, Journal of Water Resources Research, Vol. 44, W 03201. Boer, G. J. (1993): “Climate Change and the Regulation of the Surface Moisture and Energy Budgets”, Climate Dynamics, Vol. 8, pg. 225 -239. Bosilovich, M. G. , S. D. Schubert, and G. K. Walker (2005): “Global Changes of the Water Cycle Intensity”, Journal of Climate, Vol. 18, pg. 1591 -1608. Chow, V. T. , D. R. Maidment, and L. W. Mays (1988): Applied Hydrology, Mc. Graw-Hill, Boston, Massachusetts. Held, I. M. and B. J. Soden (2000): “Water Vapor Feedback and Global Warming”, Annual Review of Energy and the Environment, Vol. 25, pg. 441 -475. Held, I. M. and B. J. Soden (2006): “Robust Responses of the Hydrological Cycle to Global Warming”, Journal of Climate, Vol. 19, pg. 5686 -5699. Milly, P. C. D. , J. Betancourt, M. Falkenmark, R. M. Hirsch, Z. W. Kundzewicz, D. P. Lettenmaier, and R. J. Stouffer (2008): “Stationarity is Dead: Whither Water Management? ”, Science, Vol. 319, pg. 573 -574. NASA (2003): EO Study: Drought Lowers Lake Mead, Jesse Allen, National Aeronautics and Space Administration Earth Observatory, 21 February 2008, <http: //earthobservatory. nasa. gov/Study/Lake. Mead/lake_mead. html> Pierrehumbert, R. T. (2002): “The Hydrologic Cycle in Deep-Time Climate Problems”, Nature, Vol. 419, pg. 191 -198. Tarboton, D. G. (1995): “Hydrologic Scenarios for Severe Sustained Drought in the Southwestern United States”, Water Resources Bulletin, Vol. 31, No. 5, pg. 803 -813. USBR (2008): Bureau of Reclamation: Lower Colorado Region, 5 March 2008, United States Department of the Interior, Bureau of Reclamation, <http: //www. usbr. gov/lc/region/g 4000/hourly/meadelv. html> Woodhouse, C. A. , S. T. Gray, and D. M. Meko (2006): “Updated Streamflow Reconstructions for the Upper Colorado River Basin”, Water Resources Research, Vol. 42, W 05415. See http: //webspace. utexas. edu/jbklenz/ce 394 k/Klenzendorf. Final. Report. htm for complete list of works 15 cited.
Questions? 16
This slide intentionally left blank. 17
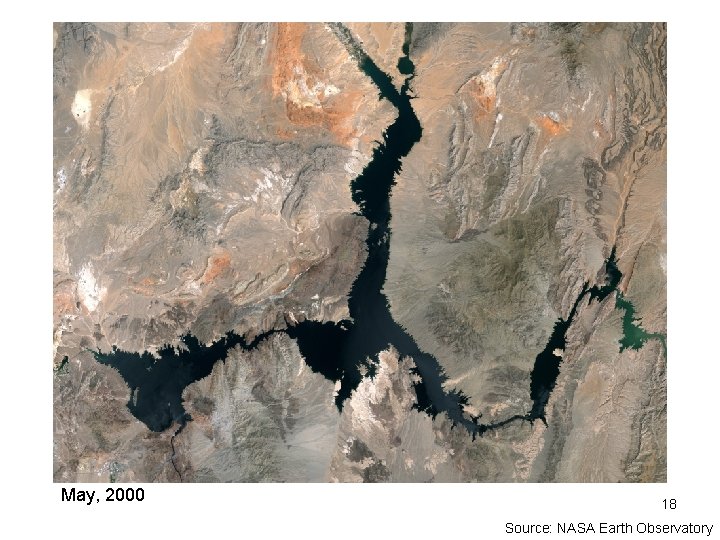
May, 2000 18 Source: NASA Earth Observatory
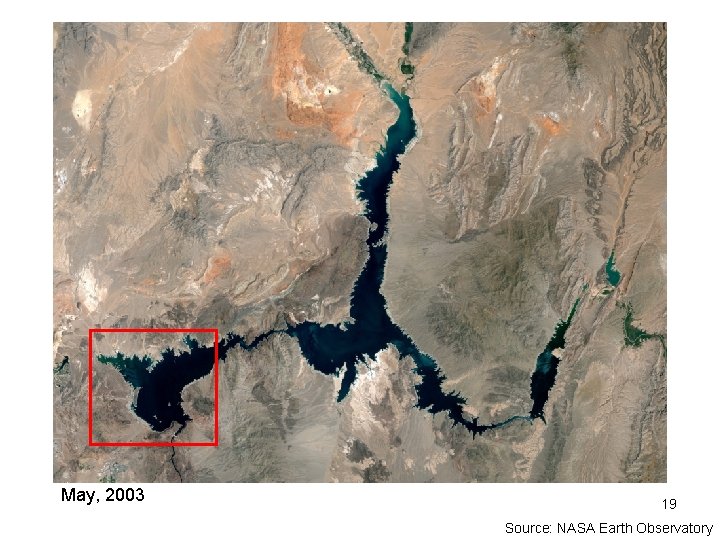
May, 2003 19 Source: NASA Earth Observatory
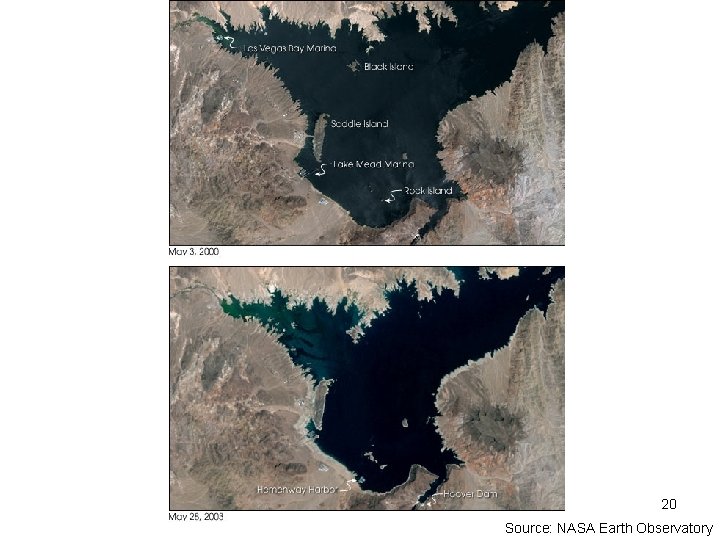
20 Source: NASA Earth Observatory
Average – 18. 0 MAF Average – 15. 1 MAF Average ~ 13. 5 MAF 21 Source: Woodhouse et al. , 2006
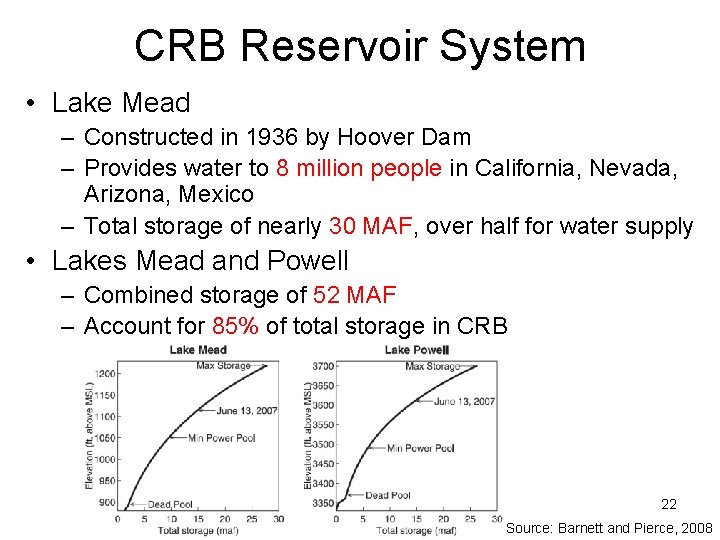
CRB Reservoir System • Lake Mead – Constructed in 1936 by Hoover Dam – Provides water to 8 million people in California, Nevada, Arizona, Mexico – Total storage of nearly 30 MAF, over half for water supply • Lakes Mead and Powell – Combined storage of 52 MAF – Account for 85% of total storage in CRB 22 Source: Barnett and Pierce, 2008
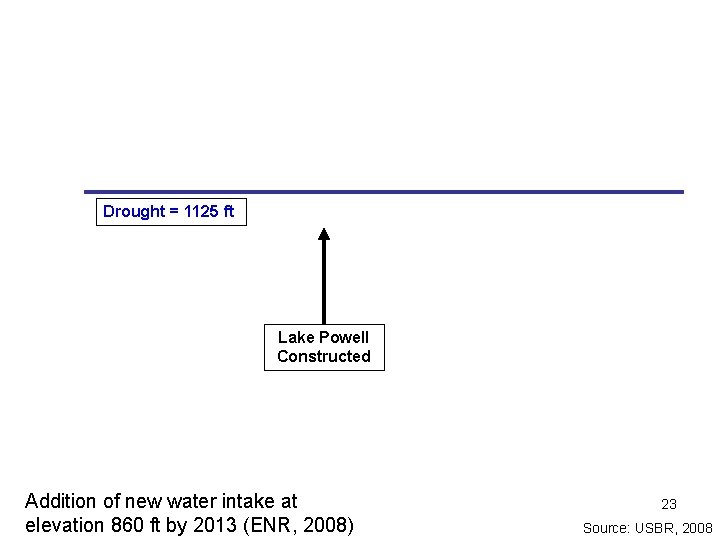
Drought = 1125 ft Lake Powell Constructed Addition of new water intake at elevation 860 ft by 2013 (ENR, 2008) 23 Source: USBR, 2008
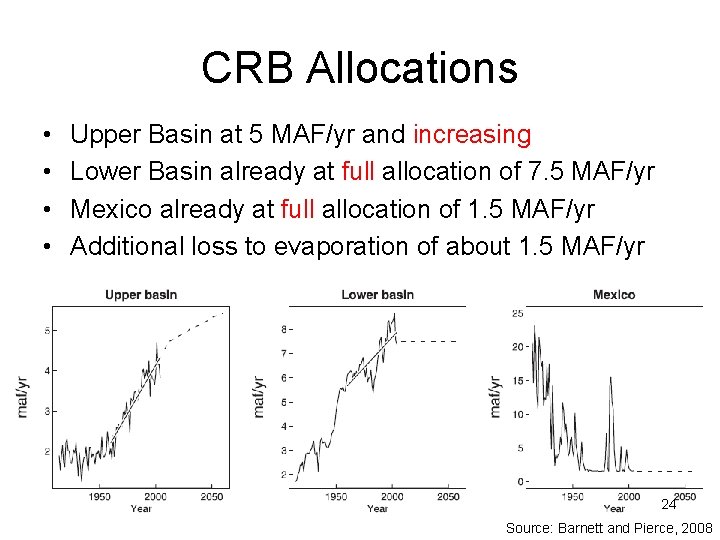
CRB Allocations • • Upper Basin at 5 MAF/yr and increasing Lower Basin already at full allocation of 7. 5 MAF/yr Mexico already at full allocation of 1. 5 MAF/yr Additional loss to evaporation of about 1. 5 MAF/yr 24 Source: Barnett and Pierce, 2008
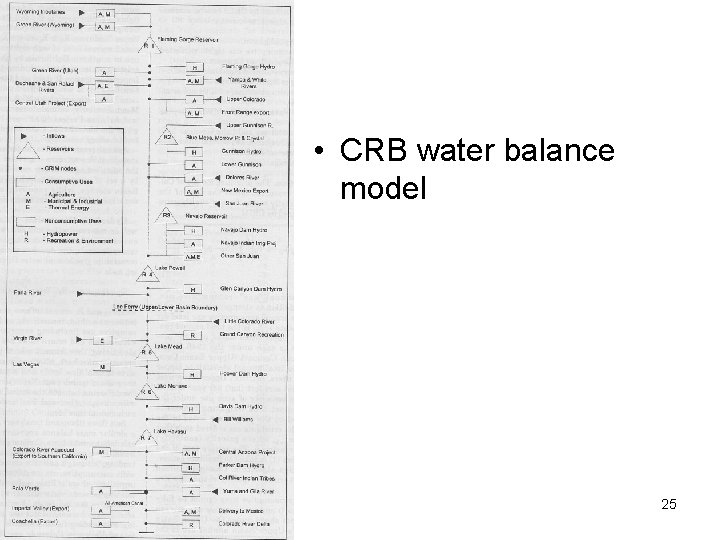
• CRB water balance model 25
Climate Change • 1827 – Fourier said atmosphere will allow solar radiation to enter uninhibited but traps thermal radiation from the Earth’s surface • 1861 – Tyndal said thermal radiation trapping is not due to major gases (N 2 and O 2) but to trace gases • Major greenhouse gases – CO 2 – Water vapor, H 2 O – Others (CH 4, N 2 O) • Mechanisms of climate change will not be discussed here, only impact on hydrology 26
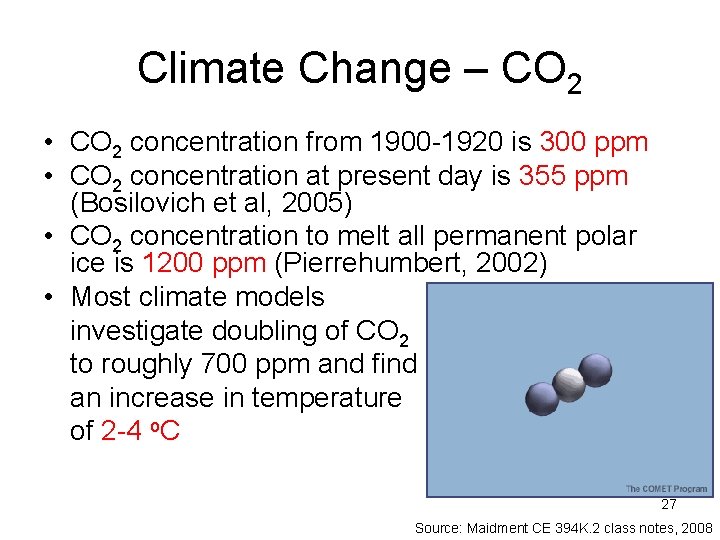
Climate Change – CO 2 • CO 2 concentration from 1900 -1920 is 300 ppm • CO 2 concentration at present day is 355 ppm (Bosilovich et al, 2005) • CO 2 concentration to melt all permanent polar ice is 1200 ppm (Pierrehumbert, 2002) • Most climate models investigate doubling of CO 2 to roughly 700 ppm and find an increase in temperature of 2 -4 o. C 27 Source: Maidment CE 394 K. 2 class notes, 2008
Climate Change – Water Vapor • The atmosphere can hold more water vapor at higher temperatures • This produces more clouds which warm the surface in infrared (longwave, thermal) radiation but cool the surface in shortwave (solar) radiation (Boer, 1993) • Therefore, increased water vapor in the atmosphere will further act to increase surface temperature and evaporation • This will further increase atmospheric water vapor concentrations • Result: possible “runaway greenhouse” effect 28
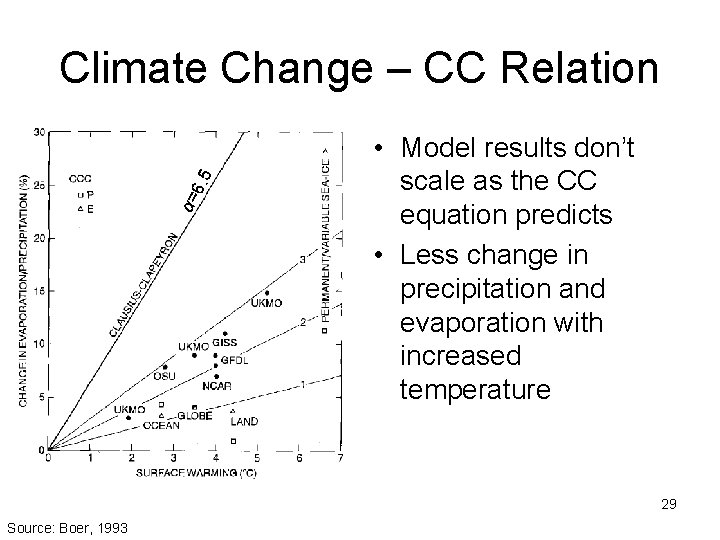
α= 6. 5 Climate Change – CC Relation • Model results don’t scale as the CC equation predicts • Less change in precipitation and evaporation with increased temperature 29 Source: Boer, 1993
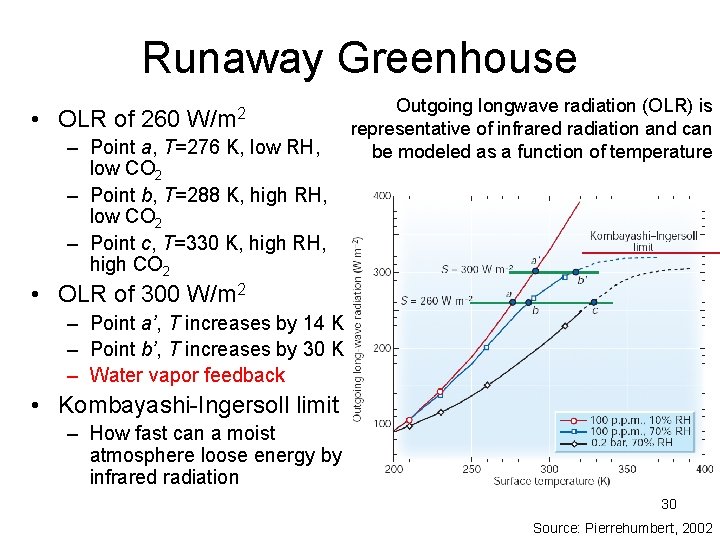
Runaway Greenhouse • OLR of 260 W/m 2 – Point a, T=276 K, low RH, low CO 2 – Point b, T=288 K, high RH, low CO 2 – Point c, T=330 K, high RH, high CO 2 Outgoing longwave radiation (OLR) is representative of infrared radiation and can be modeled as a function of temperature • OLR of 300 W/m 2 – Point a’, T increases by 14 K – Point b’, T increases by 30 K – Water vapor feedback • Kombayashi-Ingersoll limit – How fast can a moist atmosphere loose energy by infrared radiation 30 Source: Pierrehumbert, 2002
Climate Change – Runoff Annual average of change in runoff compared to the global modeling average. 31 Source: Held and Soden, 2006
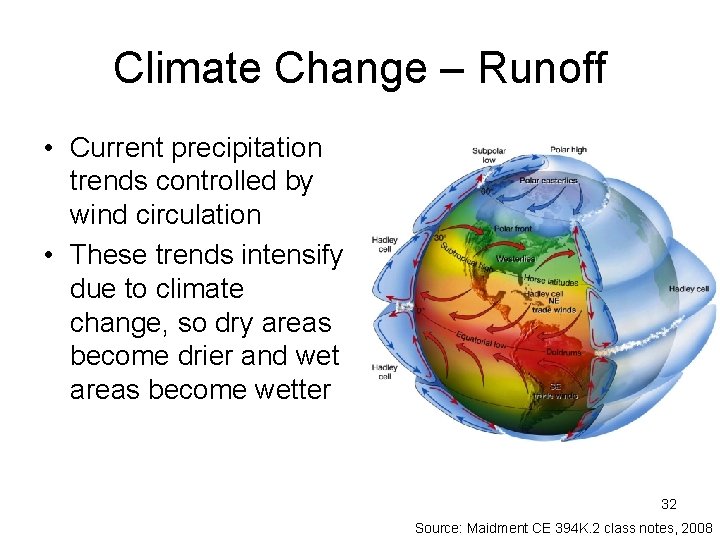
Climate Change – Runoff • Current precipitation trends controlled by wind circulation • These trends intensify due to climate change, so dry areas become drier and wet areas become wetter 32 Source: Maidment CE 394 K. 2 class notes, 2008
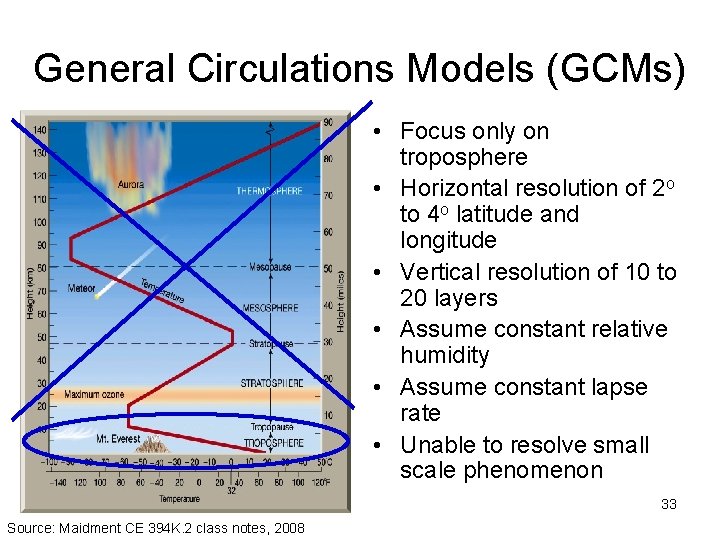
General Circulations Models (GCMs) • Focus only on troposphere • Horizontal resolution of 2 o to 4 o latitude and longitude • Vertical resolution of 10 to 20 layers • Assume constant relative humidity • Assume constant lapse rate • Unable to resolve small scale phenomenon 33 Source: Maidment CE 394 K. 2 class notes, 2008