
Effects of attrition on longitudinal EULFS estimates CESS

- Slides: 12
Effects of attrition on longitudinal EU-LFS estimates CESS 2018 Bamberg – 18 October 2018 IPS 01: Improving statistical data collections: methods, tools and sources hannah. kiiver@ec. europa. eu
Motivation • Improving statistical data collections: exploit longitudinal dimension of EU-LFS • Derive information on the transitions between labour market status over time • This talk: impact of attrition on estimates
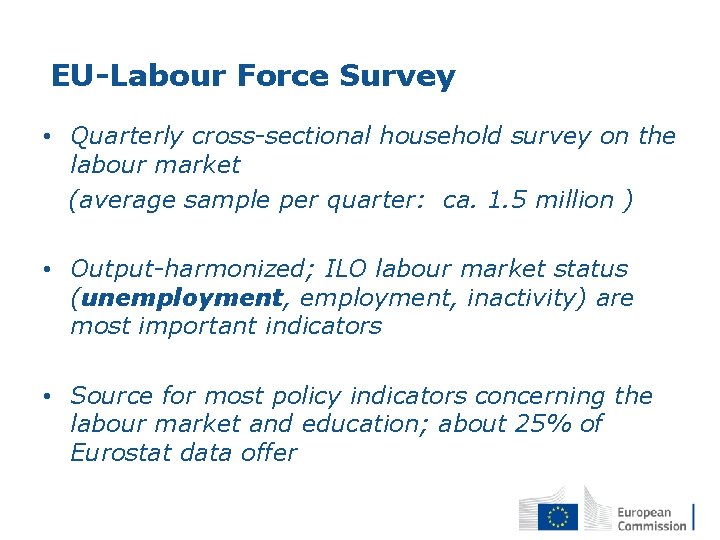
EU-Labour Force Survey • Quarterly cross-sectional household survey on the labour market (average sample per quarter: ca. 1. 5 million ) • Output-harmonized; ILO labour market status (unemployment, inactivity) are most important indicators • Source for most policy indicators concerning the labour market and education; about 25% of Eurostat data offer
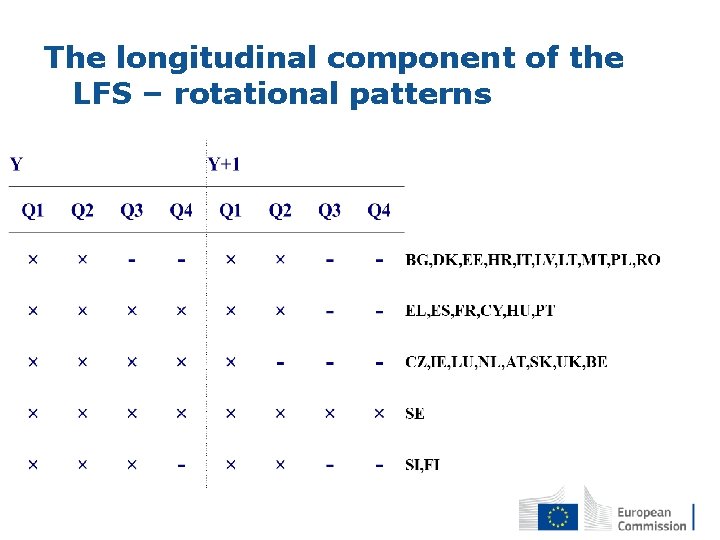
The longitudinal component of the LFS – rotational patterns
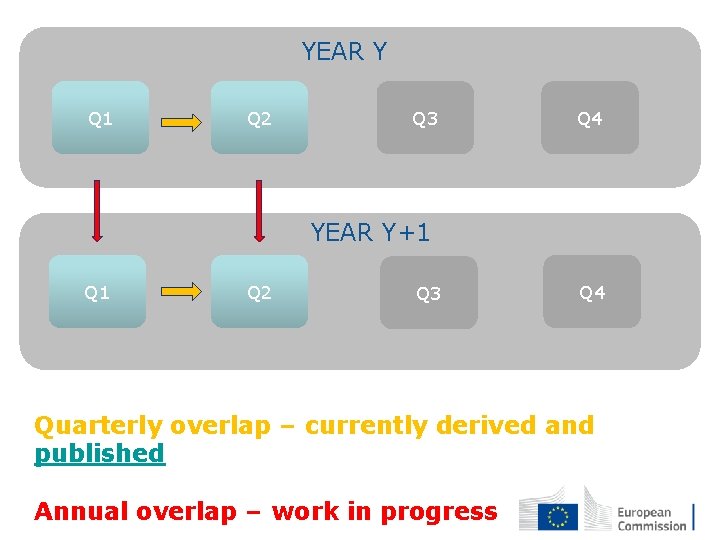
YEAR Y Q 1 Q 2 Q 3 Q 4 YEAR Y+1 Q 2 Q 3 Q 4 Quarterly overlap – currently derived and published Annual overlap – work in progress
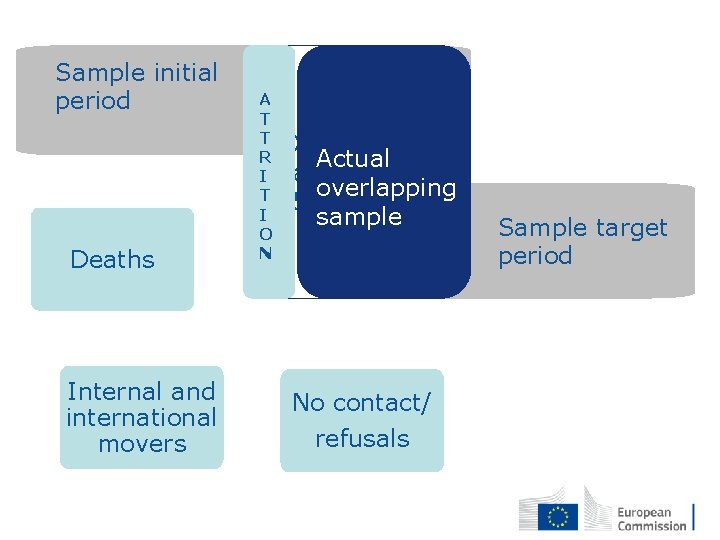
Sample initial period Deaths Internal and international movers A T T R I T I O N Overlapping Actual sample overlapping (50%) sample No contact/ refusals Sample target period
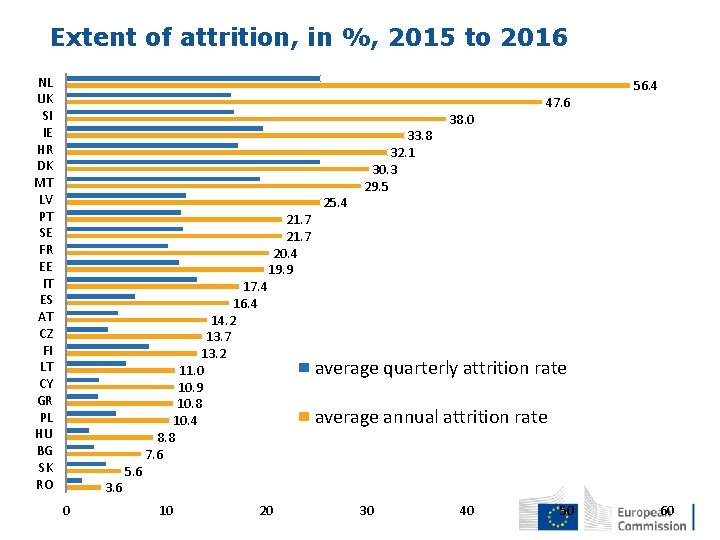
Extent of attrition, in %, 2015 to 2016 NL UK SI IE HR DK MT LV PT SE FR EE IT ES AT CZ FI LT CY GR PL HU BG SK RO 3. 6 0 5. 6 17. 4 16. 4 14. 2 13. 7 13. 2 11. 0 10. 9 10. 8 10. 4 8. 8 7. 6 10 21. 7 20. 4 19. 9 20 25. 4 33. 8 32. 1 30. 3 29. 5 38. 0 47. 6 56. 4 average quarterly attrition rate average annual attrition rate 30 40 50 60
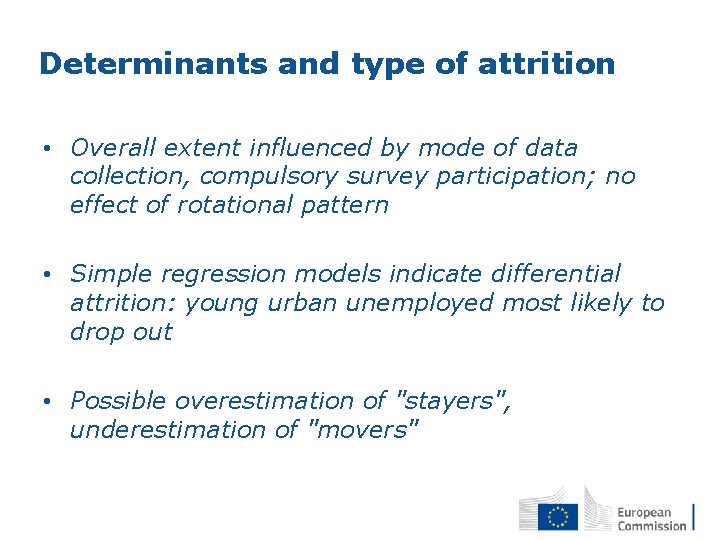
Determinants and type of attrition • Overall extent influenced by mode of data collection, compulsory survey participation; no effect of rotational pattern • Simple regression models indicate differential attrition: young urban unemployed most likely to drop out • Possible overestimation of "stayers", underestimation of "movers"
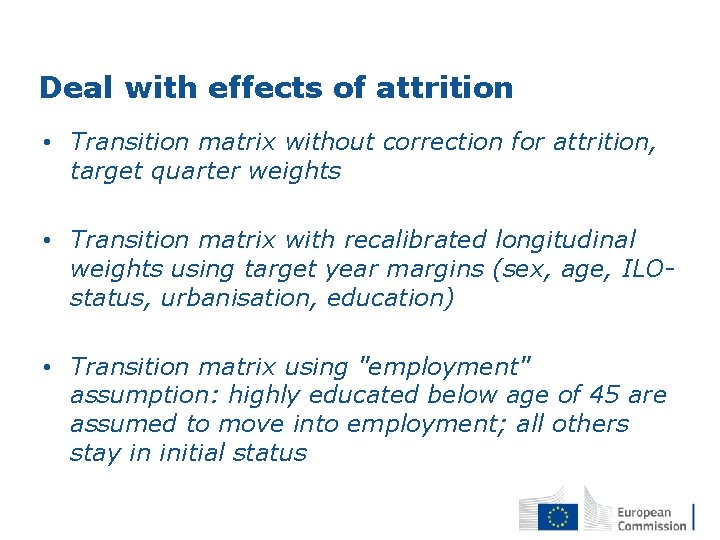
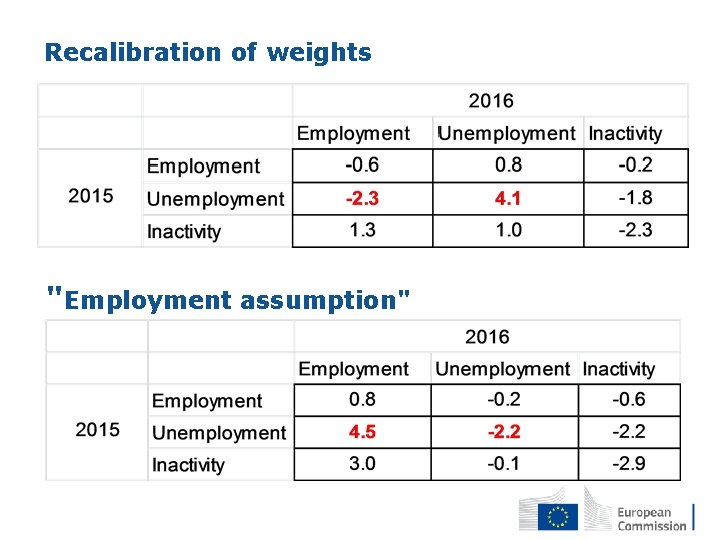
Deal with effects of attrition • Transition matrix without correction for attrition, target quarter weights • Transition matrix with recalibrated longitudinal weights using target year margins (sex, age, ILOstatus, urbanisation, education) • Transition matrix using "employment" assumption: highly educated below age of 45 are assumed to move into employment; all others stay in initial status
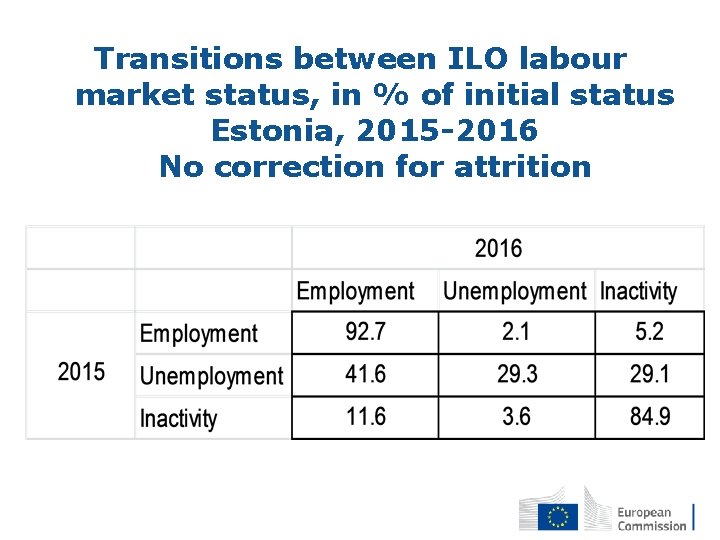
Transitions between ILO labour market status, in % of initial status Estonia, 2015 -2016 No correction for attrition
Recalibration of weights "Employment assumption"
Conclusions • Assumptions matter! – but even extreme assumptions have similar impacts over time/between countries • Investigating longitudinal data from the LFS is a worthwhile experiment - estimates for annual flows and metadata in 2019