Effects of a sedentary lifestyle Prevalence of diabetes


Effects of a sedentary lifestyle
 urban")
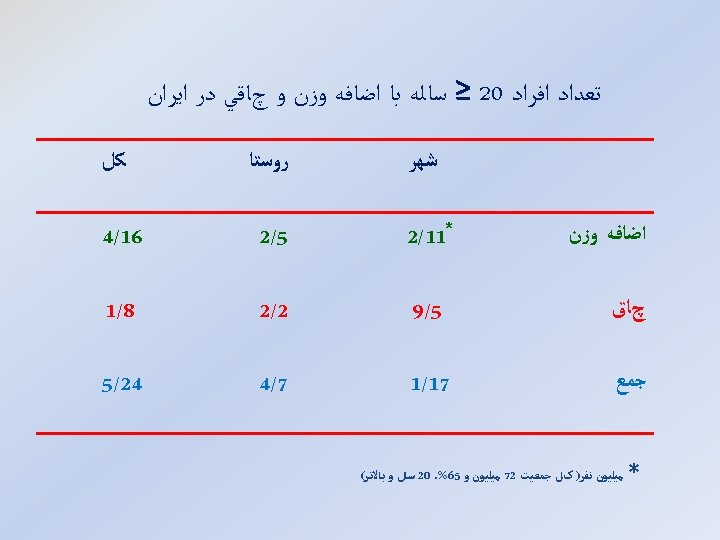
Prevalence of diabetes and impaired fasting glucose in the adult (20 -64 years) urban population of Iran Esteghamati AR, et al. Diabetes Care 2008, 31: 96 -8
")
High prevalence of diabetes and abnormal glucose tolerance in adult population (≥ 20 years) of Tehran Hadaegh F. at al. BMC Public Health 2008. 8: 176

Age- and gender-wise prevalence of different glucose intolerance categories among Tehranian adults 12 10 % 8 men 6 women total 4 2 0 IFG IGT IFG/IGT Hadaegh F. at al. BMC Public Health 2008. 8: 176 Undiagnosed known diabetes Diabetes

Estimation of the Prevalence of glucose intolerance in Iran Esteghamati, 2008† Azizi, 2009* Urban Rural All IGT 3. 2* 0. 9 4. 1 - DM 2. 6 1. 0 3. 6 2. 0 IFG Total 4. 4 5. 8 1. 9 7. 7 *Estimation by studies using GTI ( Epidemiology of Common diseases in Iran † National survey using FPG (Diabetes Care) 6. 4

Age-adjusted cumulative hazard of cardiovascular disease for glucose regulation categories. In both genders NGT and IFG/IGT categories had relatively the same cumulative hazards. In the male population, there was no difference between NDM and KDM categories regarding the cumulative hazards of CVD; however, in women the KDM category had higher cumulative hazard than the NDM category. NGT: normal glucose tolerance IFG/IGT: impaired fasting glucose or impaired glucose tolerance NDM: newly diagnosed diabetes mellitus KDM: known diabetes mellitus Hadaegh et al. J Endocrinol Invest 2009; 9: 724
 2004 N = 8647 (")
Prevalence of overweight and obesity in Tehranian adults (TLGS) 2004 N = 8647 ( aged 20 -70 years ) F. Azizi et al, East Mediter Health 2004; 10: 887
 and of abdominal obesity (Ab)")
Prevalence of different categories of body mass index (BMI) and of abdominal obesity (Ab) by gender Kelishadi R et al. Public Health Nutr 2007; 11: 246
 spent on physical activity in men and women with different categories")
Daily time (min) spent on physical activity in men and women with different categories of BMI (BMI-body mass index) Kelishadi R et al. Public Health Nutr 2007; 11: 246

Age- specefic prevalence of metabolic syndrome by sex in Tehran’s adult population The unadjusted prevalence of the metabolic syndrome in the study population was 30. 1% (CI 95% : 29. 2 -31. 0) F. Azizi et al. Diabet Res Clin Prac 2003; 61(1): 29 -37
")
Waist circumference cut off in various metabolic syndrome and population/country-specific definitions Definition Cut-off (cm) Women Men IGR (1999) ≥ 80 ≥ 94 NCEP/ATP III (2001) ≥ 88 ≥ 102 EUROPID IDF (2005) ≥ 80 ≥ 94 Asian IDF (2005) ≥ 80 ≥ 90 Japanese IDF (2005) ≥ 90 ≥ 85 Iranian (cross-sectional 2009) ≥ 91 ≥ 89 Iranian (outcome 2009) ≥ 94. 5

Appropriate Iranian Waist Circumference Cut-off Points: The First Report of the Iranian National Committee on Obesity For both women and men ≥ 30 years: • Stage 1; preventive measures: 90 cm • Stage 2; serious management: 95 cm Azizi F, et al. Arch Iran Med 2010; 13: 243 -4.

Criteria for Clinical Diagnosis of the Metabolic Syndrome in the I. R. Iran Measure Categorical Cut Points Elevated waist circumference* ≥ 95 cm for both men & women Elevated triglycerides (drug treatment for elevated triglycerides is an alternate indicator†) 150 mg/d. L (1. 7 mmol/L) Reduced HDL-C (drug treatment for reduced HDL-C is an alternate indicator†) 40 mg/d. L (1. 0 mmol/L) in males; 50 mg/d. L (1. 3 mmol/L) in Females Elevated blood pressure (antihypertensive drug treatment in a patient with a history of hypertension is an alternate indicator) Systolic 130 and/or diastolic 85 mm Hg Elevated fasting glucose‡ (drug treatment of elevated glucose is an alternate indicator) 100 mg/d. L HDL-C indicates high-density lipoprotein cholesterol. *It is recommended that the IDF cut points be used for non-Europeans and either the IDF or AHA/NHLBI cut points used for people of European origin until more data are available. †The most commonly used drugs for elevated triglycerides and reduced HDL-C are fibrates and nicotinic acid. A patient taking 1 of these drugs can be presumed to have high triglycerides and low HDL-C. High-dose -3 fatty acids presumes high triglycerides. ‡Most patients with type 2 diabetes mellitus will have the metabolic syndrome by the proposed criteria. Azizi F et al. Arch Iran Med 2010; 13: 243 -4

Mean BMI during 12 years of follow up in Tehranian adults: TLGS 29 28 27. 7 27 26. 8 26. 6 26. 2 (kg/m 2) 26 25. 9 25. 6 25. 1 25 25. 4 Phase 1 24. 9 Phase 2 24. 5 Phase 3 24. 2 phase 4 24 23. 3 23 22 21 Male Female Total

Mean Waist during 12 years of follow up in Tehranian adults: TLGS 94 91. 8 92 90 89. 7 90 88 91. 8 87. 8 86. 3 (cm) 86 86. 6 84. 9 Phase 1 84 Phase 2 84 Phase 3 82 81. 2 80. 8 phase 4 81 80 78 76 74 Male Female Total
 during 12 years of follow up in")
Frequency of central obesity (Waist ≥ 90) during 12 years of follow up in Tehranian adults: TLGS 70 63. 2 57. 3 60 56. 7 51. 8 52. 1 50 46. 4 47. 1 41. 9 38. 9 (%) 40 33 Phase 1 Phase 2 32. 6 32. 3 Phase 3 30 phase 4 20 10 0 Male Female Total
 during 12 years of follow up in Tehranian")
Frequency of obesity (BMI ≥ 30) during 12 years of follow up in Tehranian adults: TLGS 35 32 30 27. 5 27 25. 6 25 21. 6 21. 5 21. 2 20 Phase 1 (%) 16. 9 15 10 13. 4 Phase 2 16. 4 15 Phase 3 phase 4 9. 8 5 0 Male Female Total

Mean age-standardized SBP, TC, and FPG in relation to mean age-standardized BMI Danaei G, et al. (Global Burden of Metabolic Risk Factors of Chronic Diseases Collaborating Group), In press.

Mean age-standardized levels of metabolic risk factors in relation to western diet Danaei G, et al. (Global Burden of Metabolic Risk Factors of Chronic Diseases Collaborating Group), In press.

Mean age-standardized levels of metabolic risk factors in relation to the proportion of a country’s population that lived in urban areas Danaei G, et al. (Global Burden of Metabolic Risk Factors of Chronic Diseases Collaborating Group), In press.

Mean age-standardized levels of metabolic risk factors in relation to per-capita gross domestic product (GDP) Danaei G, et al. (Global Burden of Metabolic Risk Factors of Chronic Diseases Collaborating Group), In press.

Intervention Lifestyle intervention towards changes: in nutritional habits, increase in physical activities, decrease in cigarette smoking, and better management of stress 25
 The change in the prevalence of metabolic syndrome components Over the")
Results Prevalence (%) The change in the prevalence of metabolic syndrome components Over the time in cases and controls Cases Controls


- Slides: 28