EET 2023 DIGITAL ELECTRONICS II CHAPTER 3 Sequencing

 q")
 The function of a state machine (or sequential circuit) can")
 A flowchart is a convenient way to specify a sequence")
 ASM Chart has 3 basic elements: State box Decision box")


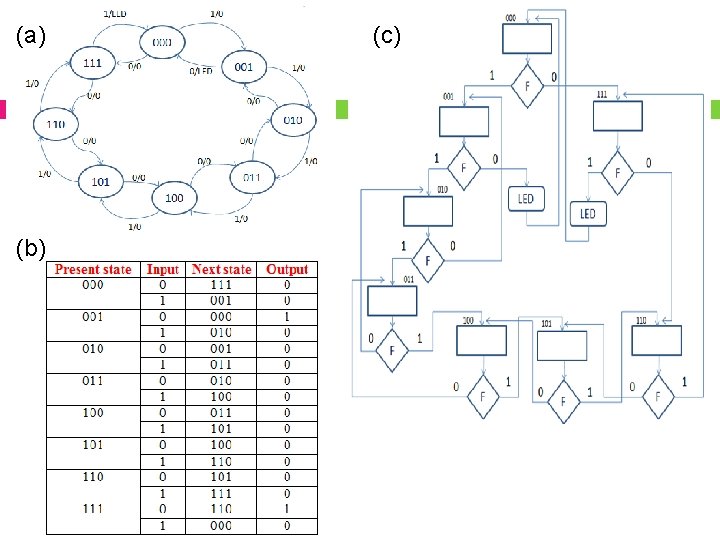
 Given is a state diagram for the sequence detector system.")
 ASM Chart: Present State Q 1 Q 0 0 1")
 If x =")
")
")
- Slides: 21
EET 202/3 DIGITAL ELECTRONICS II CHAPTER 3 : Sequencing and Control Semester 1 Session 2017/2018
3. 2 Sequencing and Control ~ Outline ~ q Algorithmic State Machines (ASM) q q q ASM Chart ASM Block ASM Timing Considerations OBJECTIVES OF THIS CHAPTER CO 2: Ability to analyze and convert ASM chart to logical circuit and vice versa
Algorithmic State Machine (ASM) The function of a state machine (or sequential circuit) can be represented by a state table or a state diagram. A flowchart is a way of showing actions and control flow in an algorithm. An Algorithmic State Machine (ASM) is simply a flowchart -like way to specify state diagrams for sequential logic and, optionally, actions performed in a datapath. While flowcharts typically do not specify “time”, an ASM explicitly specifies a sequence of actions and their timing relationships.
Algorithmic State Machine (ASM) A flowchart is a convenient way to specify a sequence of procedural steps and decision paths for an algorithm. ASM chart provides not only sequence of events, but it distinguished by the fact that it describes the timing relationship between states of the CU and the datapath actions in response to clock pulses.
Algorithmic State Machine (ASM) ASM Chart has 3 basic elements: State box Decision box – Scalar or Vector Conditional output box
ASM Chart : 1. State Box Consist of a rectangle with: The symbolic name for the state marked outside the upper left top Containing register transfer operations and outputs activated within or while leaving the state An optional state code, if assigned, outside the Entry Exit
ASM Chart : 1. State Box Explanation: • The register transfer indicates that the register R is to be reset to 0 on any clock pulse that occurs while the control is in state IDLE. • RUN indicates that the output signal RUN is to be 1 during the time that the control in state IDLE. Entry Exit
ASM Chart : 2. Scalar Decision Box Consist of a diamond with: One input path (entry point). One input condition, placed in the center of the box, that is tested. (in this case START) A TRUE exit path taken if the condition is true (logic 1). A FALSE exit path taken if the condition is false (logic 0). Entry Exit 0 Exit 1 (Refers to 1 bit condition)
ASM Chart : 4. Vector decision box Consist of a hexagon with: One Input Path (entry point). A vector of input conditions, placed in the center of the box, that is tested. Entry Exit 0 Exit 2 Exit 1 Exit 2 n - 1 (Refers to 2 bit scondition) Up to 2 n output paths. The path taken has a binary vector value that matches the vector input condition
ASM Chart : 3. Conditional Output Box Consist of an oval with: One input path from a decision box or decision boxes. One output path Register transfers or outputs that occur only if the conditional path to the box is taken.
ASM Chart • • Moore type : Dependent only on state Transfers and outputs in a state box Mealy type : Dependent on both state and inputs Transfers and outputs in a conditional output box
ASM Block Consist of ONE State box and all of the decision and conditional output box connected between the state box exit and entry paths to the same or other boxes. Figure 8. 2 : Morris Mano, pg 367
Name Summary. State box Decision Box Output Box Drawing symbol
Exercise - Moore Model The output of the system is Z 1 and Z 2, input is X and Y 00, 01 01, 11 S 0/00 S 1/11 00 10, 11 01, 11 S 2/10 10 00, 01 11 00, 10 10 S 3/01
Exercise - Mealy Model The output of the system is Z 1 and Z 2, input X and Y 01, 11/11 00, 01/11 A B 00/00 10, 11/10 01, 11/00 C 10/01 00, 01/00 00, 10/01 10/10 D 11/01
Exercise (MTE 2 0708) Given is a state diagram for the sequence detector system. The input and output for the system is labeled as X and Z respectively. Assume initial state is S 0. i) Generate the corresponding state table. [10 m] ii) Design the logic circuit using D-FFs. [15 m] iii)Produce the corresponding Algorithm State Diagram (ASM) chart. [10 m]
Test 2 0708 iii) ASM Chart: Present State Q 1 Q 0 0 1 1 Inpu Next State Output t X Q 1+ Q 0+ Z 0 0 1 0 0 0 1 1 1 0 0 X X X 1 X X X
Exercise Draw the ASM charts for the following state transitions: (1) If x = 0, control goes from state T 1 to state T 2; if x = 1, generate a conditional operation and go from T 1 to T 2. (2) Start from state T 1; then: if xy = 00, go to T 2; if xy = 01, go to T 3; if xy = 10, go to T 1; otherwise go to T 3.
Exercise (FE 2014)
Exercise (FE 2014)