
EEG MEG Experimental Design Preprocessing Lena Kstner Thomas

- Slides: 43
EEG / MEG: Experimental Design & Preprocessing Lena Kästner Thomas Ditye
Outline Experimental Design Preprocessing in SPM 8 • • • • Technology Signal Inferences Design Limitations Combined Measures Data Conversion Montage Mapping Epoching Downsampling Filtering Artefact Removal Referencing
Outline Experimental Design Preprocessing in SPM 8 • • • • Technology Signal Inferences Design Limitations Combined Measures Data Conversion Montage Mapping Epoching Downsampling Filtering Artefact Removal Referencing
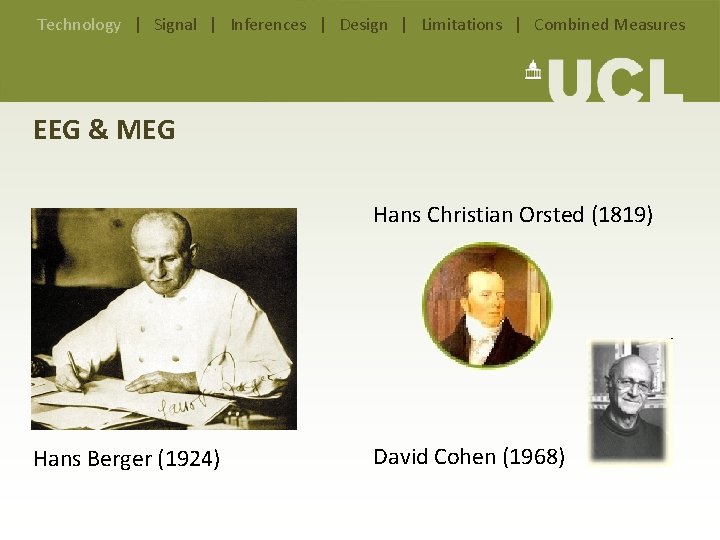
Technology | Signal | Inferences | Design | Limitations | Combined Measures EEG & MEG Hans Christian Orsted (1819) Hans Berger (1924) David Cohen (1968)
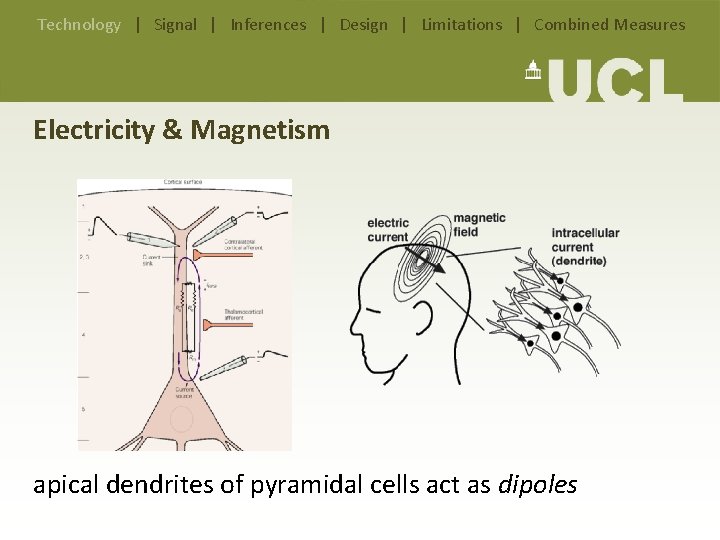
Technology | Signal | Inferences | Design | Limitations | Combined Measures Electricity & Magnetism apical dendrites of pyramidal cells act as dipoles
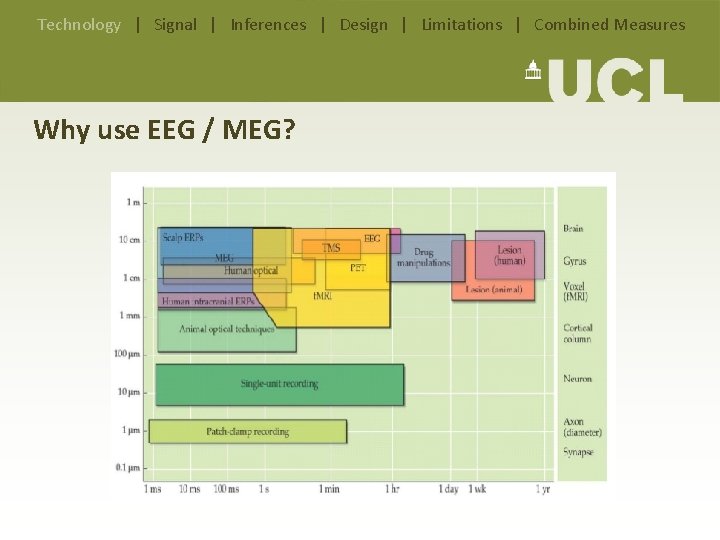
Technology | Signal | Inferences | Design | Limitations | Combined Measures Why use EEG / MEG?
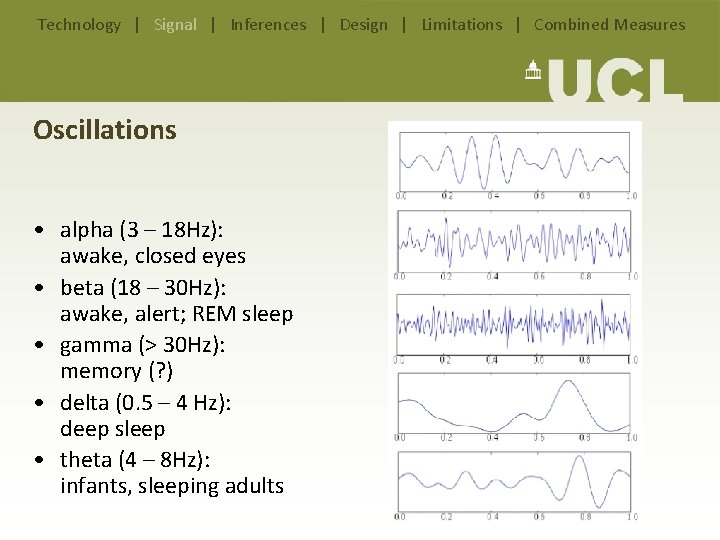
Technology | Signal | Inferences | Design | Limitations | Combined Measures Oscillations • alpha (3 – 18 Hz): awake, closed eyes • beta (18 – 30 Hz): awake, alert; REM sleep • gamma (> 30 Hz): memory (? ) • delta (0. 5 – 4 Hz): deep sleep • theta (4 – 8 Hz): infants, sleeping adults
Technology | Signal | Inferences | Design | Limitations | Combined Measures EP vs. ERP / ERF • evoked potential – short latencies (< 100 ms) – small amplitudes (< 1μV) – sensory processes • event related potential / field – longer latencies (100 – 600 ms), – higher amplitudes (10 – 100μV) – higher cognitive processes
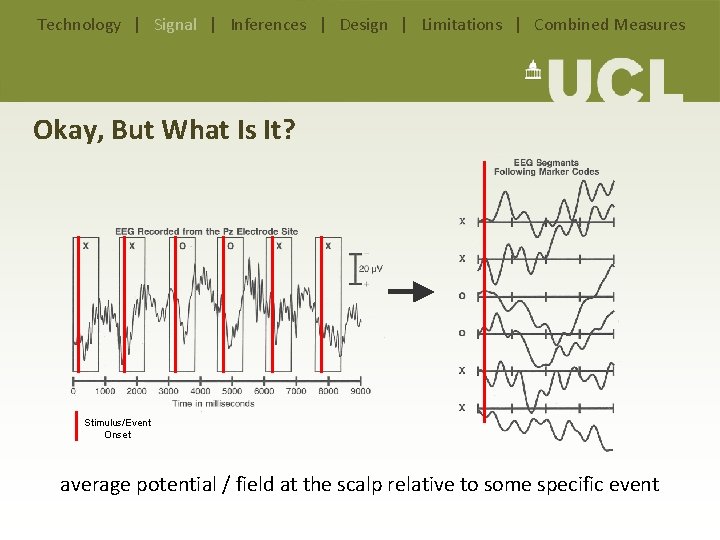
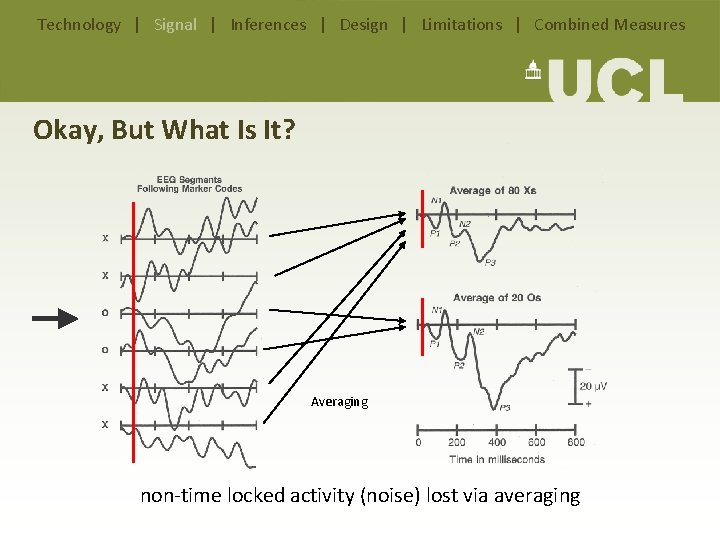
Technology | Signal | Inferences | Design | Limitations | Combined Measures Okay, But What Is It? Stimulus/Event Onset average potential / field at the scalp relative to some specific event
Technology | Signal | Inferences | Design | Limitations | Combined Measures Okay, But What Is It? Averaging non-time locked activity (noise) lost via averaging
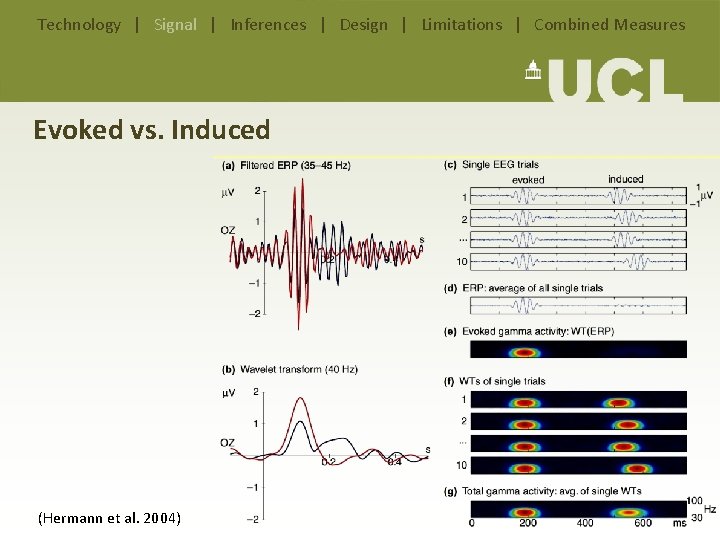
Technology | Signal | Inferences | Design | Limitations | Combined Measures Evoked vs. Induced (Hermann et al. 2004)
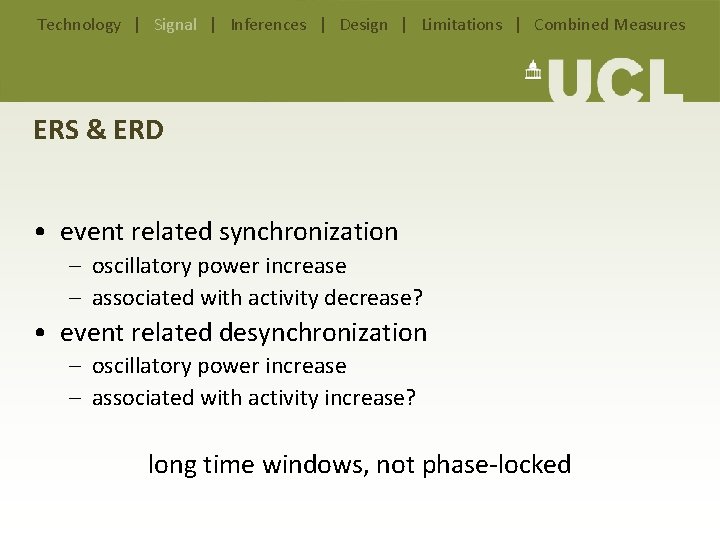
Technology | Signal | Inferences | Design | Limitations | Combined Measures ERS & ERD • event related synchronization – oscillatory power increase – associated with activity decrease? • event related desynchronization – oscillatory power increase – associated with activity increase? long time windows, not phase-locked
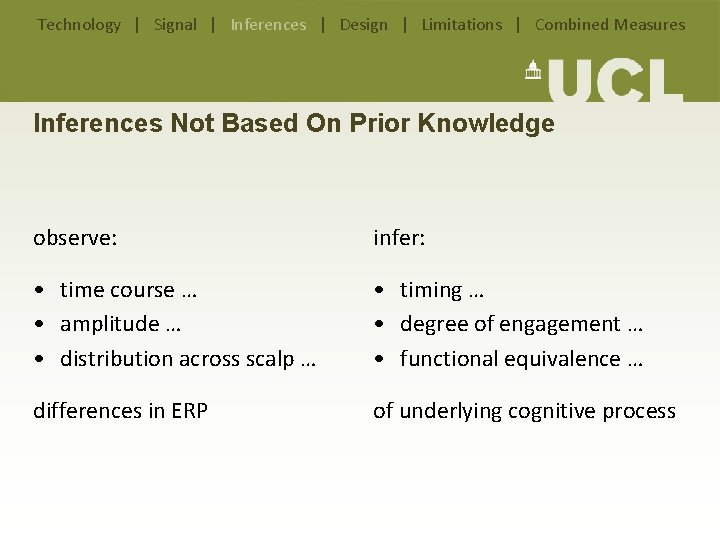
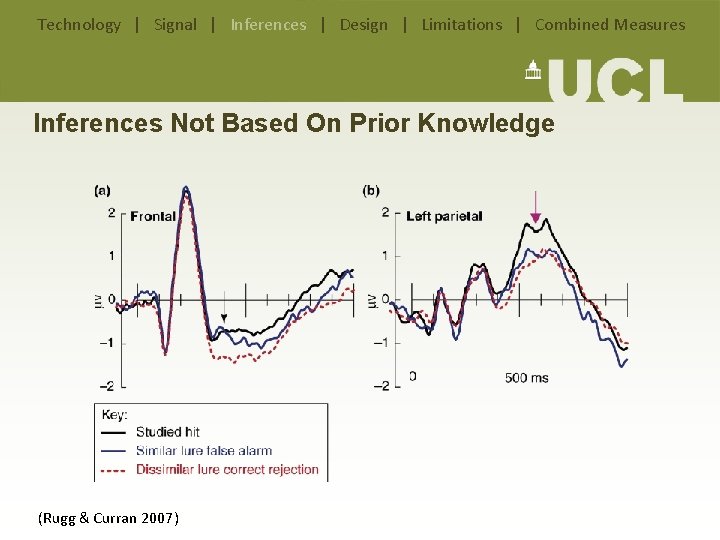
Technology | Signal | Inferences | Design | Limitations | Combined Measures Inferences Not Based On Prior Knowledge observe: infer: • time course … • amplitude … • distribution across scalp … • timing … • degree of engagement … • functional equivalence … differences in ERP of underlying cognitive process
Technology | Signal | Inferences | Design | Limitations | Combined Measures Inferences Not Based On Prior Knowledge (Rugg & Curran 2007)
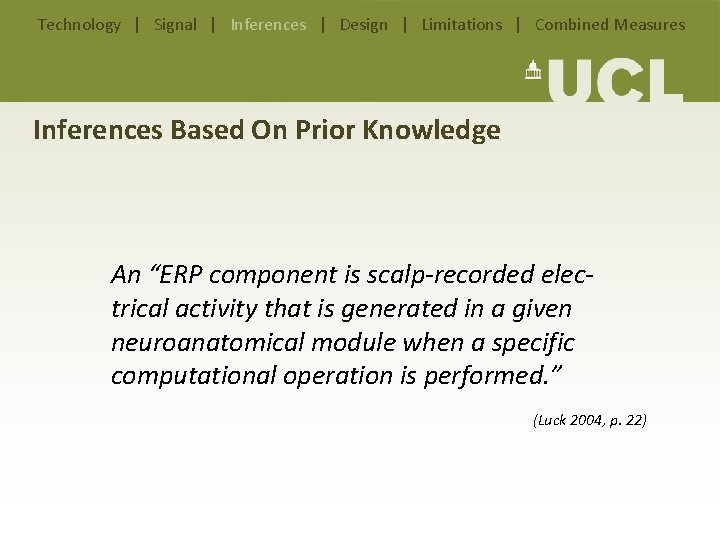
Technology | Signal | Inferences | Design | Limitations | Combined Measures Inferences Based On Prior Knowledge An “ERP component is scalp-recorded electrical activity that is generated in a given neuroanatomical module when a specific computational operation is performed. ” (Luck 2004, p. 22)
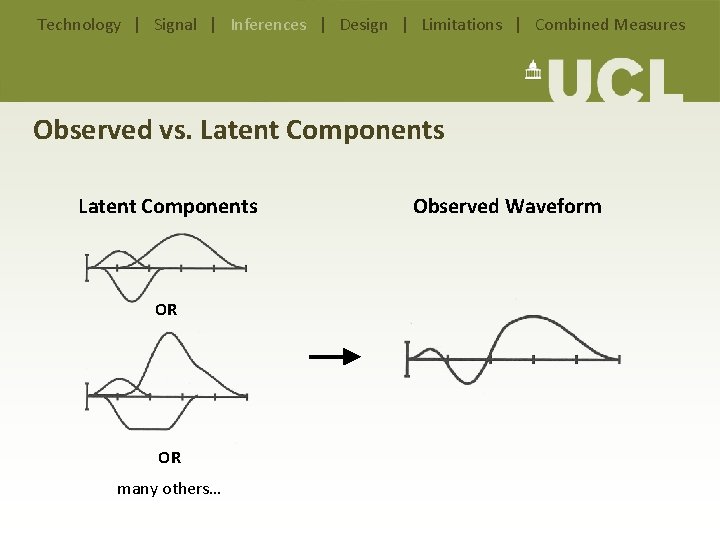
Technology | Signal | Inferences | Design | Limitations | Combined Measures Observed vs. Latent Components OR OR many others… Observed Waveform
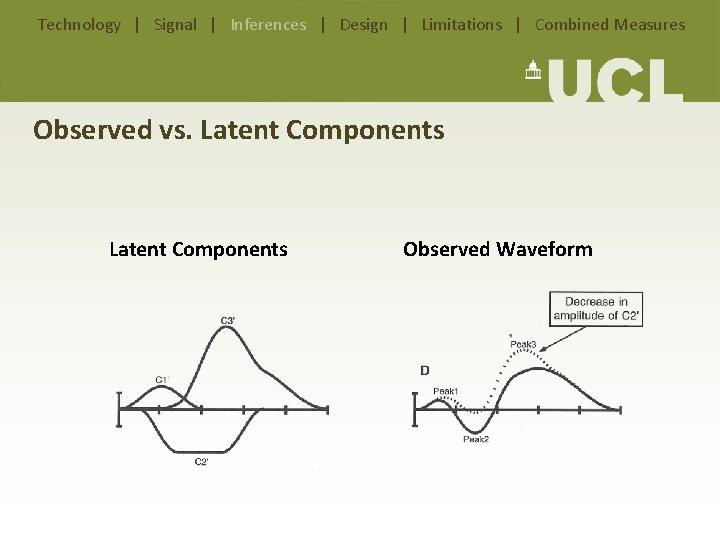
Technology | Signal | Inferences | Design | Limitations | Combined Measures Observed vs. Latent Components Observed Waveform
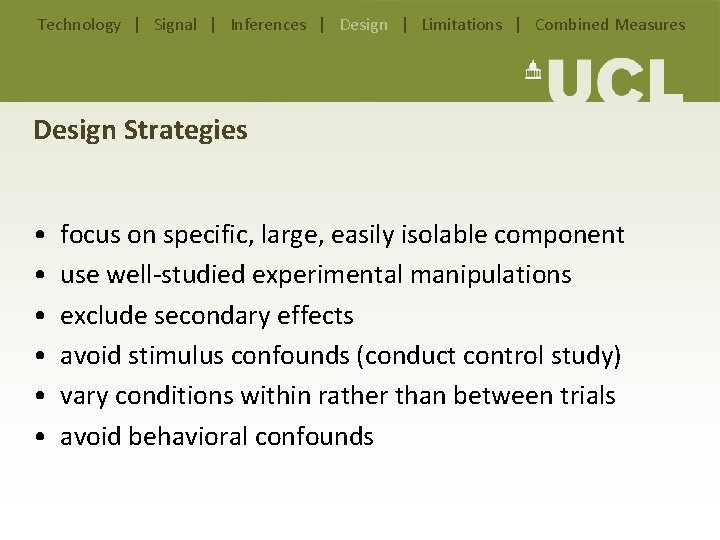
Technology | Signal | Inferences | Design | Limitations | Combined Measures Design Strategies • • • focus on specific, large, easily isolable component use well-studied experimental manipulations exclude secondary effects avoid stimulus confounds (conduct control study) vary conditions within rather than between trials avoid behavioral confounds
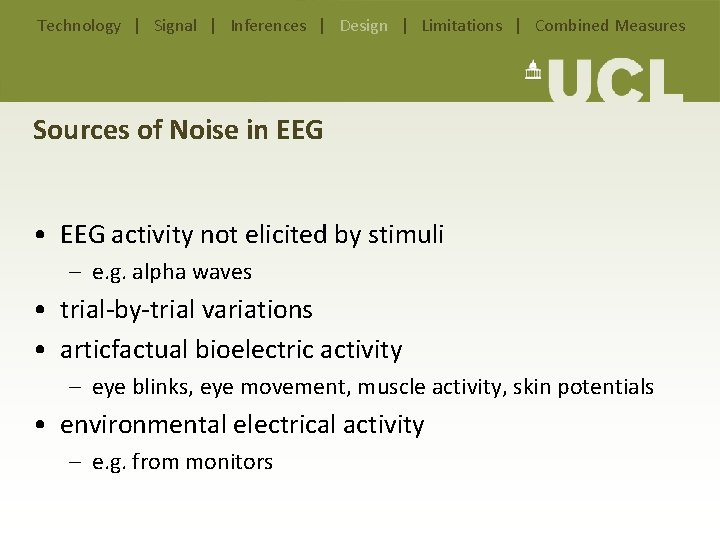
Technology | Signal | Inferences | Design | Limitations | Combined Measures Sources of Noise in EEG • EEG activity not elicited by stimuli – e. g. alpha waves • trial-by-trial variations • articfactual bioelectric activity – eye blinks, eye movement, muscle activity, skin potentials • environmental electrical activity – e. g. from monitors
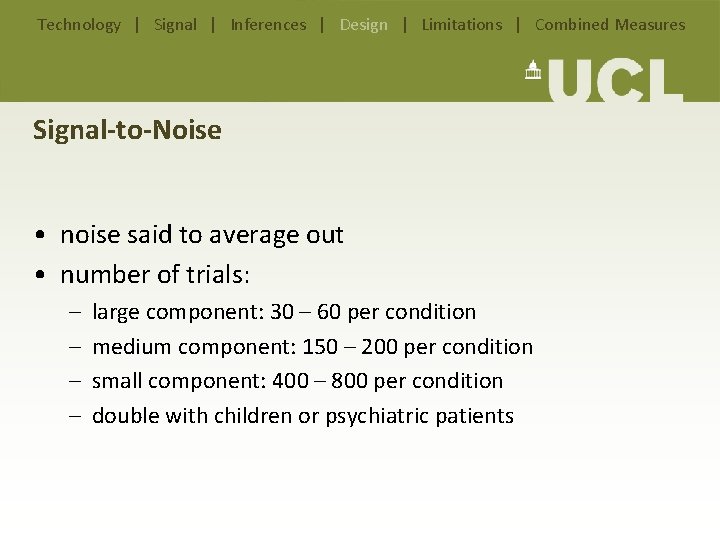
Technology | Signal | Inferences | Design | Limitations | Combined Measures Signal-to-Noise • noise said to average out • number of trials: – – large component: 30 – 60 per condition medium component: 150 – 200 per condition small component: 400 – 800 per condition double with children or psychiatric patients
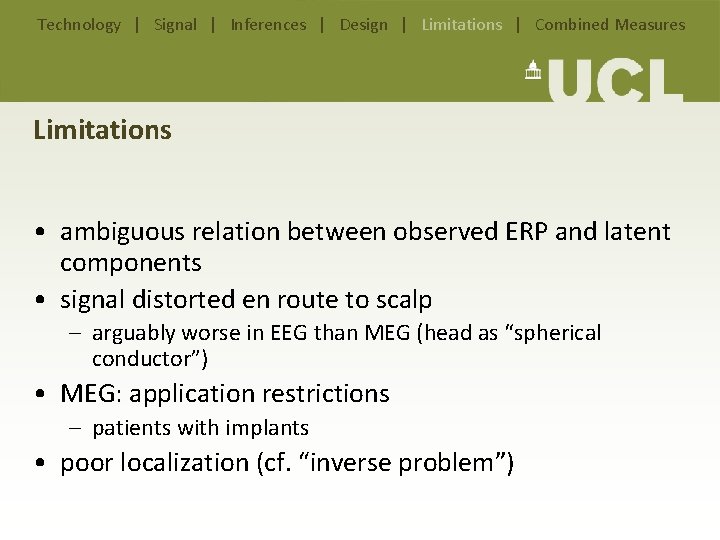
Technology | Signal | Inferences | Design | Limitations | Combined Measures Limitations • ambiguous relation between observed ERP and latent components • signal distorted en route to scalp – arguably worse in EEG than MEG (head as “spherical conductor”) • MEG: application restrictions – patients with implants • poor localization (cf. “inverse problem”)
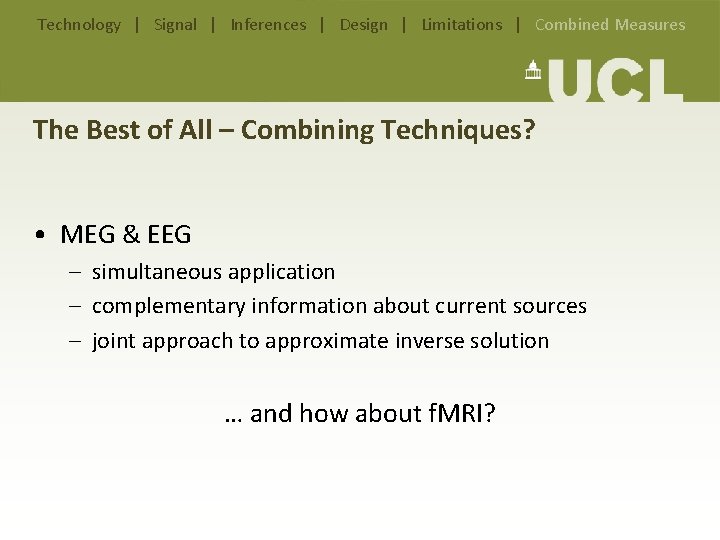
Technology | Signal | Inferences | Design | Limitations | Combined Measures The Best of All – Combining Techniques? • MEG & EEG – simultaneous application – complementary information about current sources – joint approach to approximate inverse solution … and how about f. MRI?
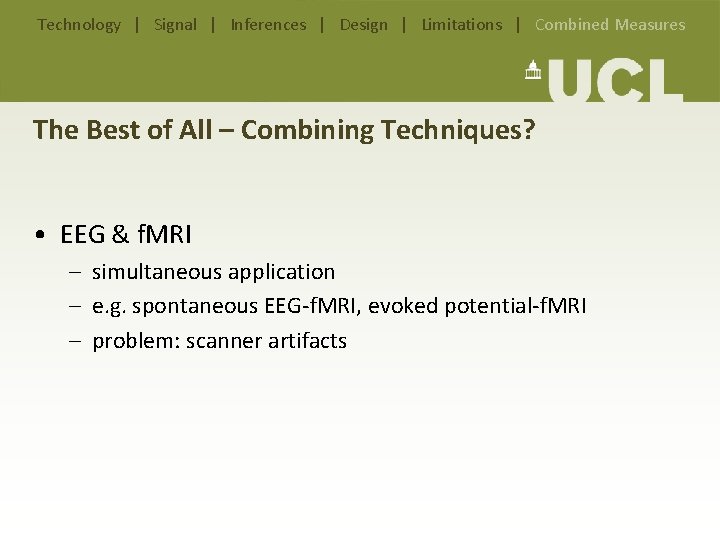
Technology | Signal | Inferences | Design | Limitations | Combined Measures The Best of All – Combining Techniques? • EEG & f. MRI – simultaneous application – e. g. spontaneous EEG-f. MRI, evoked potential-f. MRI – problem: scanner artifacts
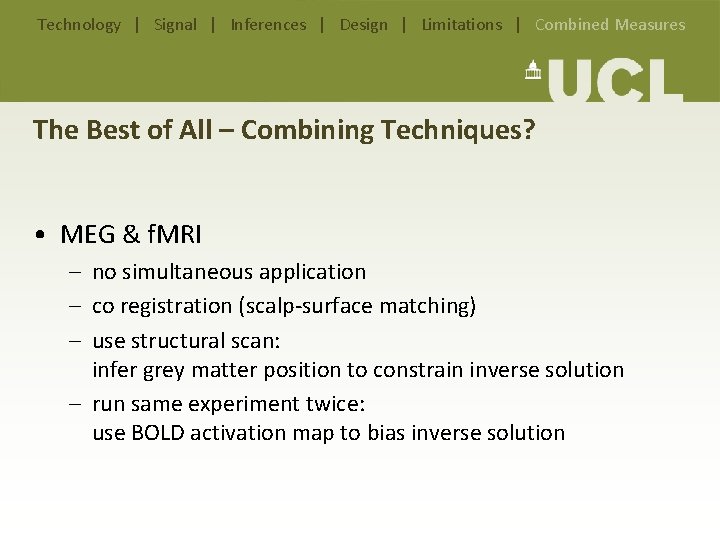
Technology | Signal | Inferences | Design | Limitations | Combined Measures The Best of All – Combining Techniques? • MEG & f. MRI – no simultaneous application – co registration (scalp-surface matching) – use structural scan: infer grey matter position to constrain inverse solution – run same experiment twice: use BOLD activation map to bias inverse solution
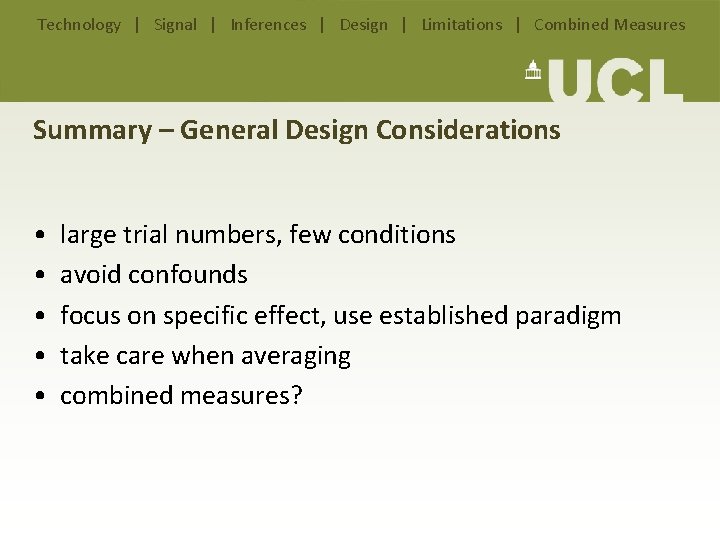
Technology | Signal | Inferences | Design | Limitations | Combined Measures Summary – General Design Considerations • • • large trial numbers, few conditions avoid confounds focus on specific effect, use established paradigm take care when averaging combined measures?
Technology | Signal | Inferences | Design | Limitations | Combined Measures Summary – Specific EEG Considerations • • • amplifier and filter settings sampling frequency number, type, location of electrodes reference electrodes additional physiological measures?
Technology | Signal | Inferences | Design | Limitations | Combined Measures Summary – Specific MEG Considerations • • amplifier and filter settings sampling frequency equipment and participant compatible with MEG? need to digitize 3 D head or recording position?
Outline Experimental Design Preprocessing in SPM 8 • • • • Technology Signal Inferences Design Limitations Combined Measures Data Conversion Downsampling Montage Mapping Epoching Filtering Artefact Removal Referencing
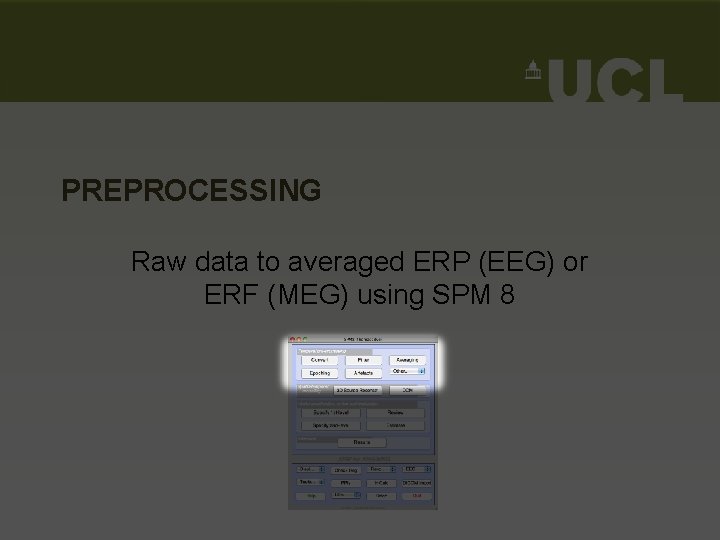
PREPROCESSING Raw data to averaged ERP (EEG) or ERF (MEG) using SPM 8
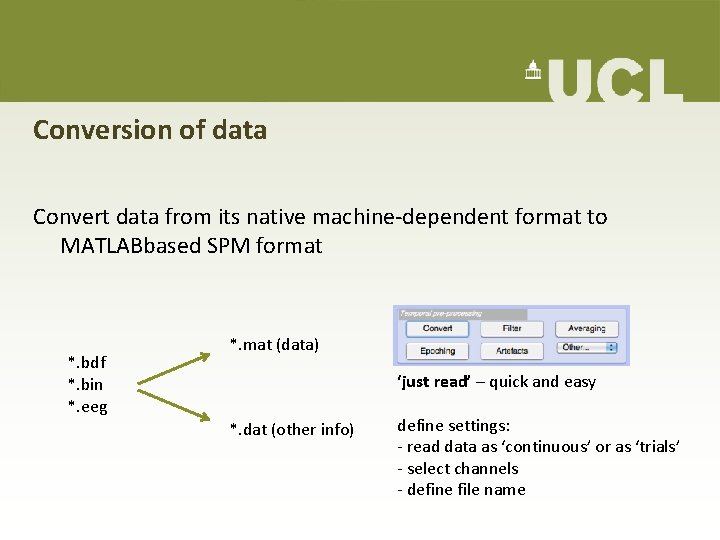
Conversion of data Convert data from its native machine-dependent format to MATLABbased SPM format *. bdf *. bin *. eeg *. mat (data) ‘just read’ – quick and easy *. dat (other info) define settings: - read data as ‘continuous’ or as ‘trials’ - select channels - define file name
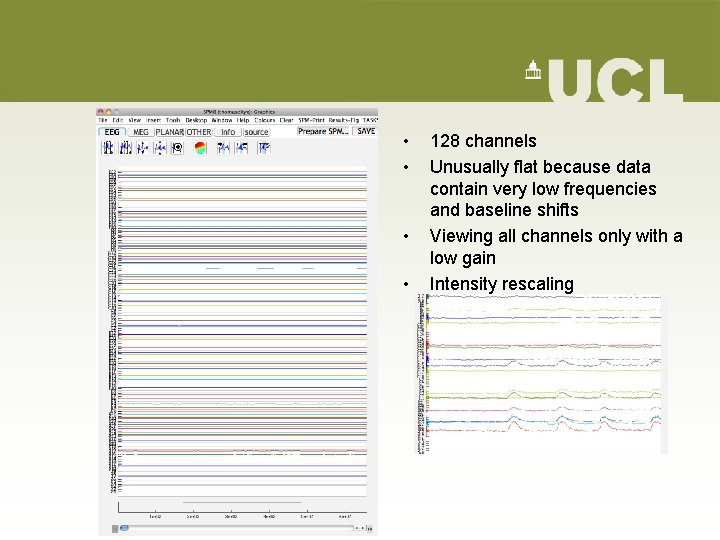
• • 128 channels Unusually flat because data contain very low frequencies and baseline shifts Viewing all channels only with a low gain Intensity rescaling
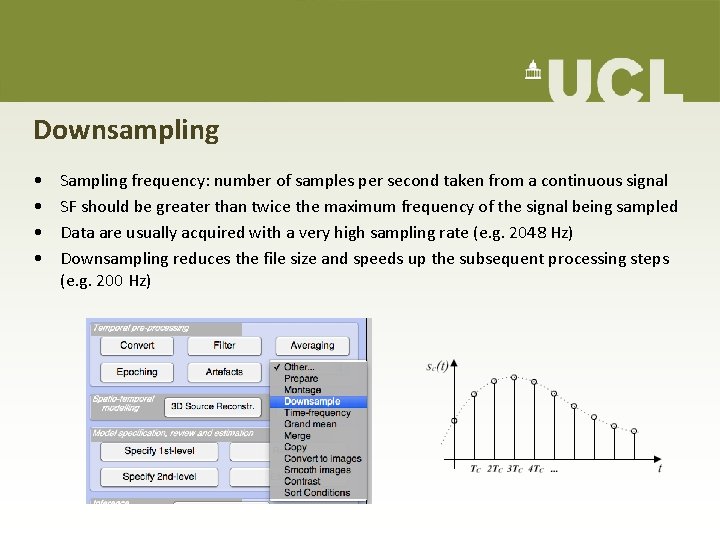
Downsampling • • Sampling frequency: number of samples per second taken from a continuous signal SF should be greater than twice the maximum frequency of the signal being sampled Data are usually acquired with a very high sampling rate (e. g. 2048 Hz) Downsampling reduces the file size and speeds up the subsequent processing steps (e. g. 200 Hz)
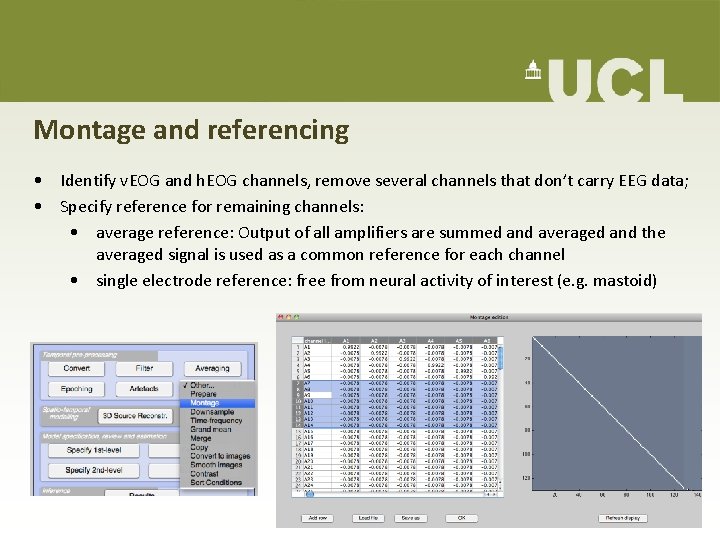
Montage and referencing • Identify v. EOG and h. EOG channels, remove several channels that don’t carry EEG data; • Specify reference for remaining channels: • average reference: Output of all amplifiers are summed and averaged and the averaged signal is used as a common reference for each channel • single electrode reference: free from neural activity of interest (e. g. mastoid)
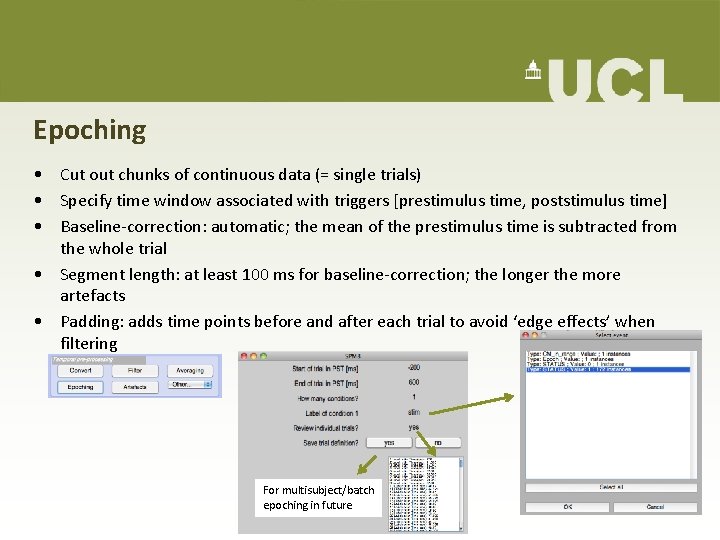
Epoching • Cut out chunks of continuous data (= single trials) • Specify time window associated with triggers [prestimulus time, poststimulus time] • Baseline-correction: automatic; the mean of the prestimulus time is subtracted from the whole trial • Segment length: at least 100 ms for baseline-correction; the longer the more artefacts • Padding: adds time points before and after each trial to avoid ‘edge effects’ when filtering For multisubject/batch epoching in future
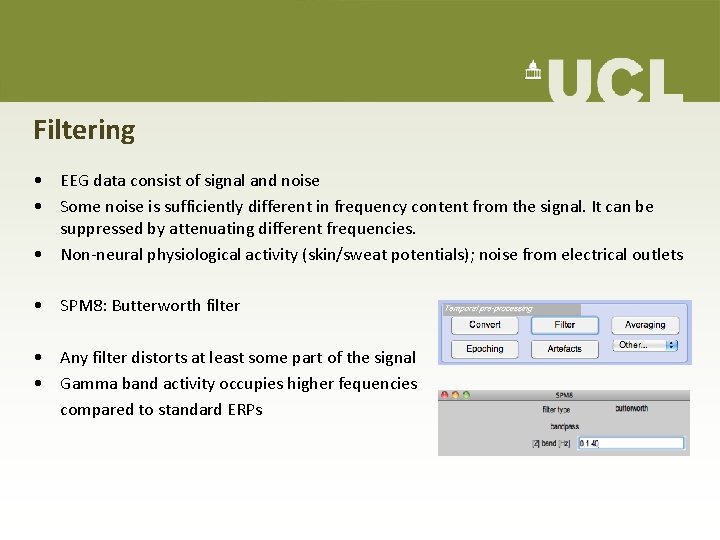
Filtering • EEG data consist of signal and noise • Some noise is sufficiently different in frequency content from the signal. It can be suppressed by attenuating different frequencies. • Non-neural physiological activity (skin/sweat potentials); noise from electrical outlets • SPM 8: Butterworth filter • Any filter distorts at least some part of the signal • Gamma band activity occupies higher fequencies compared to standard ERPs
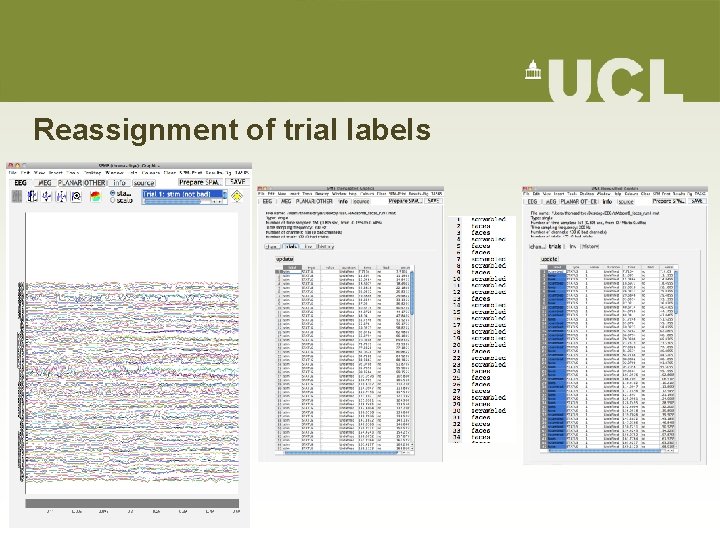
Reassignment of trial labels
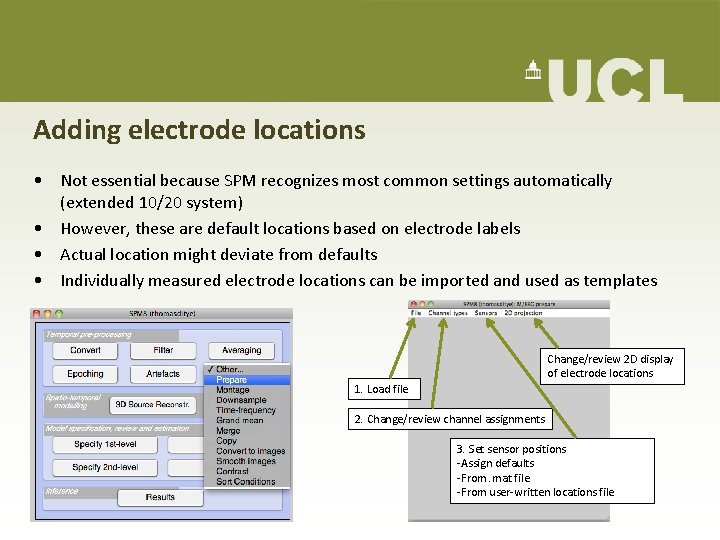
Adding electrode locations • Not essential because SPM recognizes most common settings automatically (extended 10/20 system) • However, these are default locations based on electrode labels • Actual location might deviate from defaults • Individually measured electrode locations can be imported and used as templates Change/review 2 D display of electrode locations 1. Load file 2. Change/review channel assignments 3. Set sensor positions -Assign defaults -From. mat file -From user-written locations file
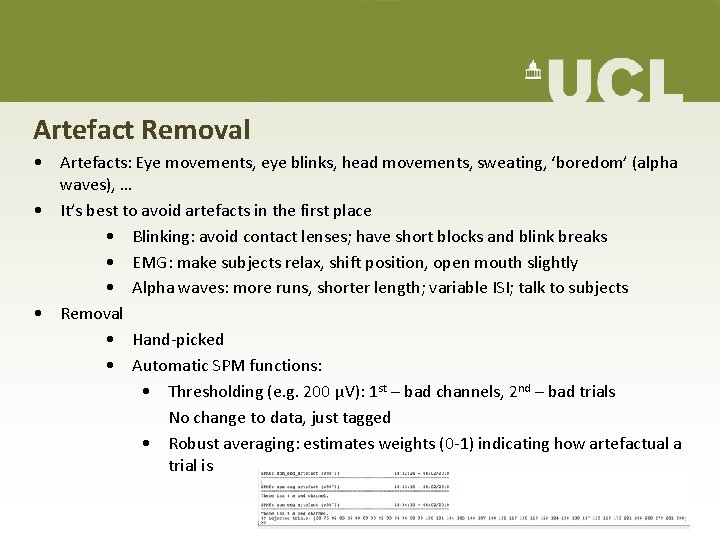
Artefact Removal • Artefacts: Eye movements, eye blinks, head movements, sweating, ‘boredom’ (alpha waves), … • It’s best to avoid artefacts in the first place • Blinking: avoid contact lenses; have short blocks and blink breaks • EMG: make subjects relax, shift position, open mouth slightly • Alpha waves: more runs, shorter length; variable ISI; talk to subjects • Removal • Hand-picked • Automatic SPM functions: • Thresholding (e. g. 200 μV): 1 st – bad channels, 2 nd – bad trials No change to data, just tagged • Robust averaging: estimates weights (0 -1) indicating how artefactual a trial is
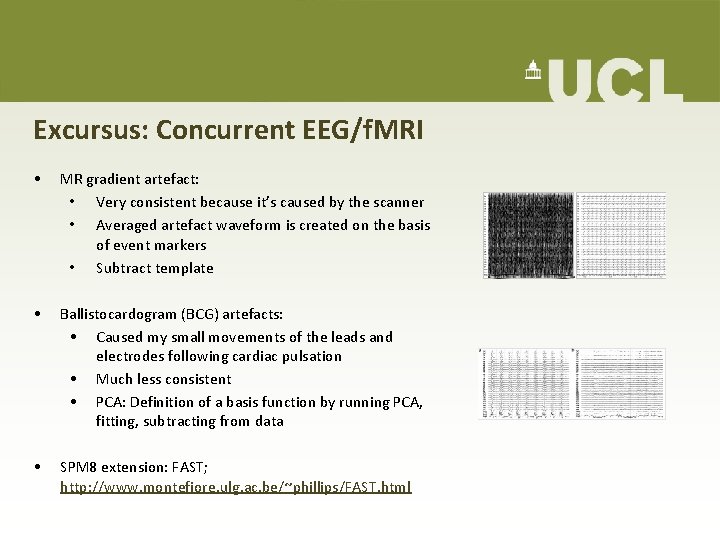
Excursus: Concurrent EEG/f. MRI • MR gradient artefact: • Very consistent because it’s caused by the scanner • Averaged artefact waveform is created on the basis of event markers • Subtract template • Ballistocardogram (BCG) artefacts: • Caused my small movements of the leads and electrodes following cardiac pulsation • Much less consistent • PCA: Definition of a basis function by running PCA, fitting, subtracting from data • SPM 8 extension: FAST; http: //www. montefiore. ulg. ac. be/~phillips/FAST. html
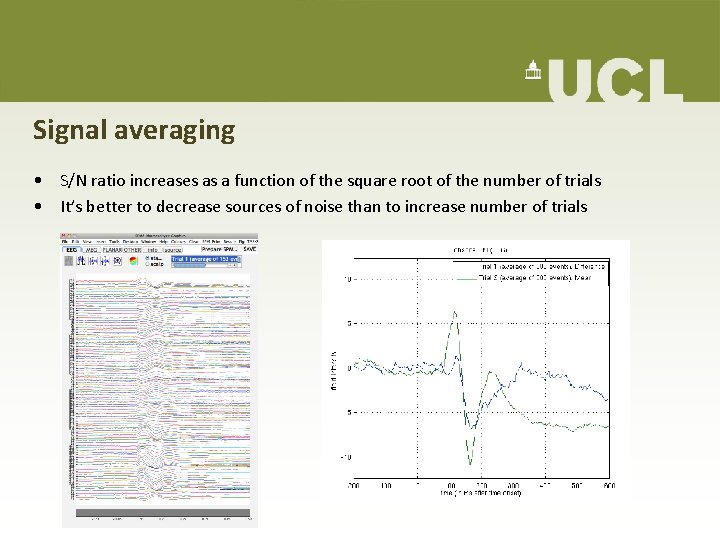
Signal averaging • S/N ratio increases as a function of the square root of the number of trials • It’s better to decrease sources of noise than to increase number of trials
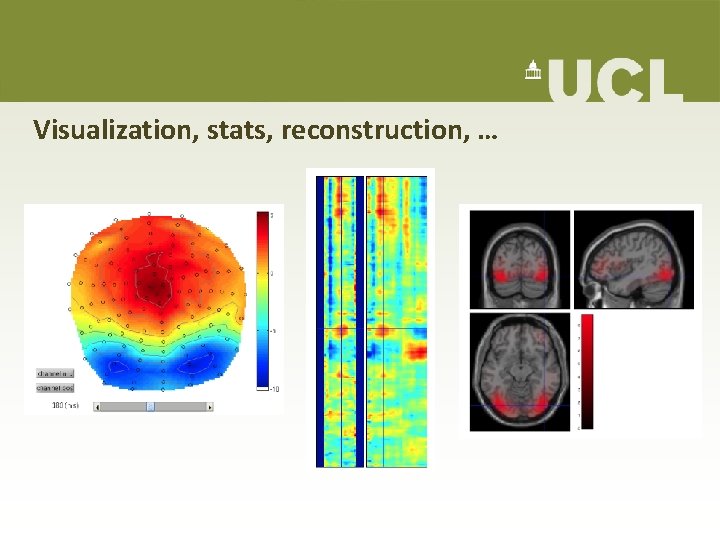
Visualization, stats, reconstruction, …
References • • Ashburner, J. et al. (2010). SPM 8 Manual. http: //www. fil. ion. ucl. ac. uk/spm/ Hermann, C. et al. (2004). Cognitive functions of gammaband activity: memory match and utilization. Trends in Cognitive Science, 8(8), 347 -355. Luck, R. L. (2005). Ten simple rules for designing ERP experiments. In T. C. Handy (Ed. ), Eventrelated potentials: a methods handbook. Cambridge, MA: MIT Press. Otten, L. J. & Rugg, M. D. (2005). Interpreting event-related brain potentials. In T. C. Handy (Ed. ), Event-related potentials: a methods handbook. Cambridge, MA: MIT Press. Rippon, G. (2006). Electroencephalography. In C. Senior, T. Russell, & M. S. Gazzaniga (Eds. ), Methods in Mind. Rugg, M. D. & Curran, T. (2007). Event-related potentials and recognition memory. Trends in Cognitive Science, 11(6), 251 -257. Singh, K. D. (2006). Magnetoencephalography. In C. Senior, T. Russell, & M. S. Gazzaniga (Eds. ), Methods in Mind. Mf. D slides from previous years (with special thanks to Matthias Gruber and Nick Abreu for their EEG signal illustrations)
Thank You! … and next week: contrasts, inference and source localization