
EE 7700 Pattern Classification Bahadir K Gunturk Classification
EE 7700 Pattern Classification Bahadir K. Gunturk
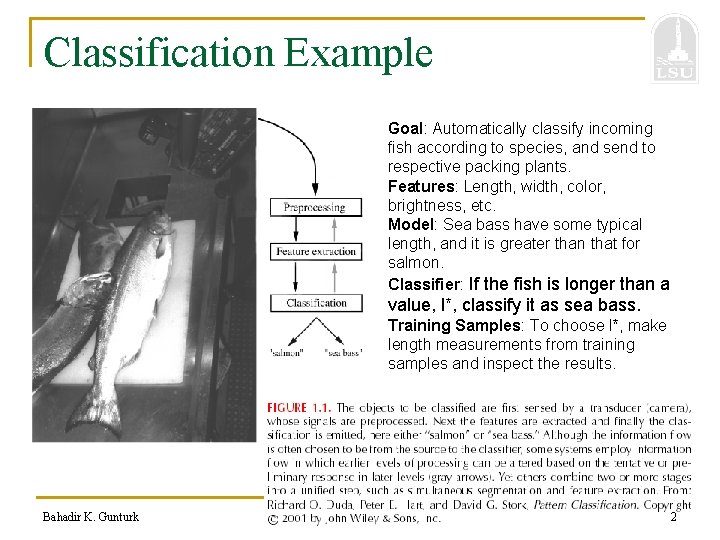
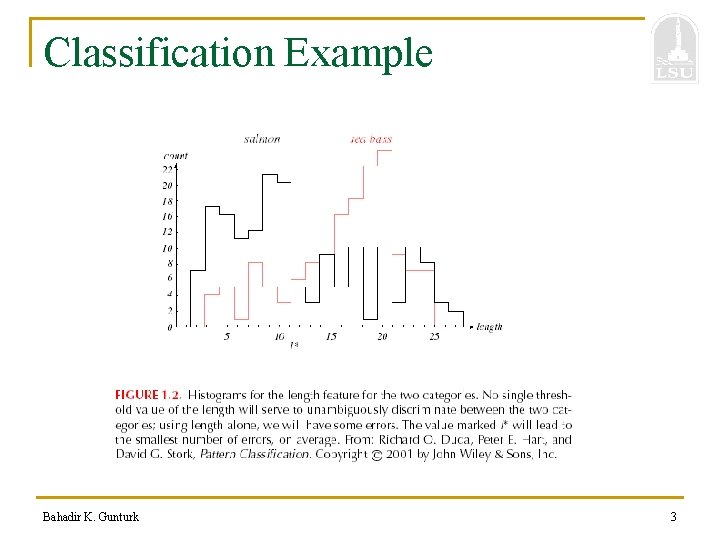
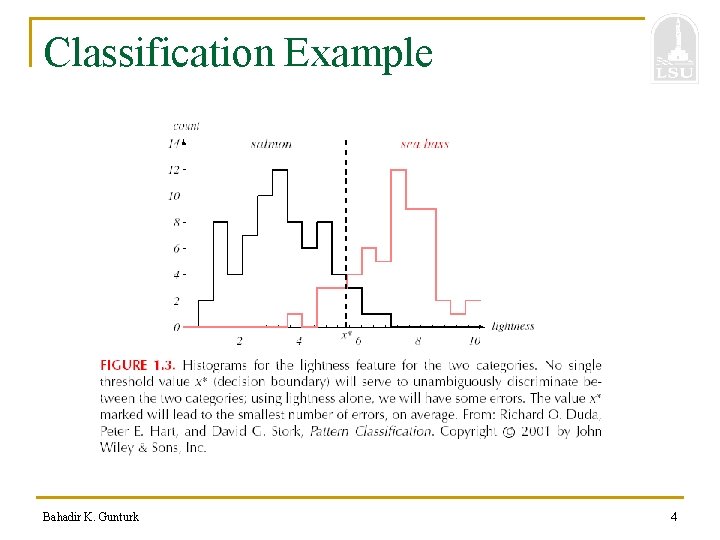
Classification Example Goal: Automatically classify incoming fish according to species, and send to respective packing plants. Features: Length, width, color, brightness, etc. Model: Sea bass have some typical length, and it is greater than that for salmon. Classifier: If the fish is longer than a value, l*, classify it as sea bass. Training Samples: To choose l*, make length measurements from training samples and inspect the results. Bahadir K. Gunturk 2
Classification Example Bahadir K. Gunturk 3
Classification Example Bahadir K. Gunturk 4
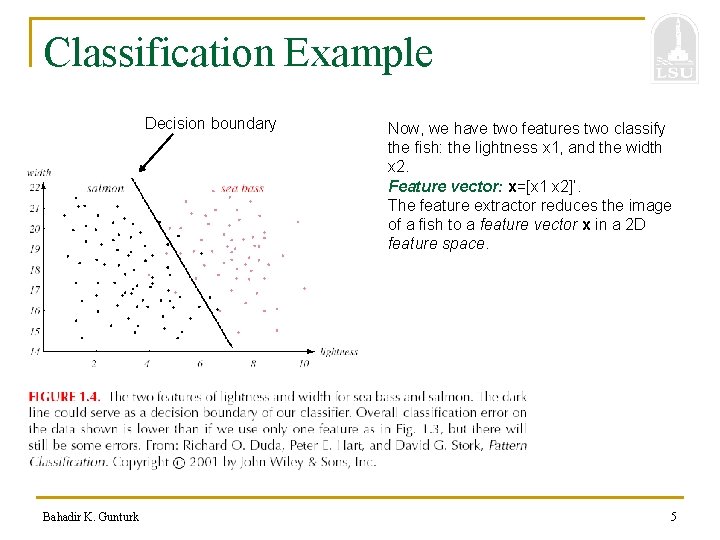
Classification Example Decision boundary Bahadir K. Gunturk Now, we have two features two classify the fish: the lightness x 1, and the width x 2. Feature vector: x=[x 1 x 2]’. The feature extractor reduces the image of a fish to a feature vector x in a 2 D feature space. 5
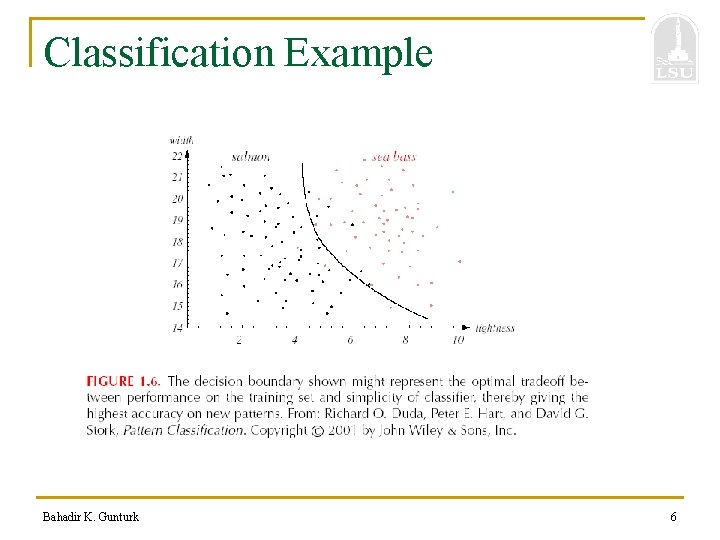
Classification Example Bahadir K. Gunturk 6
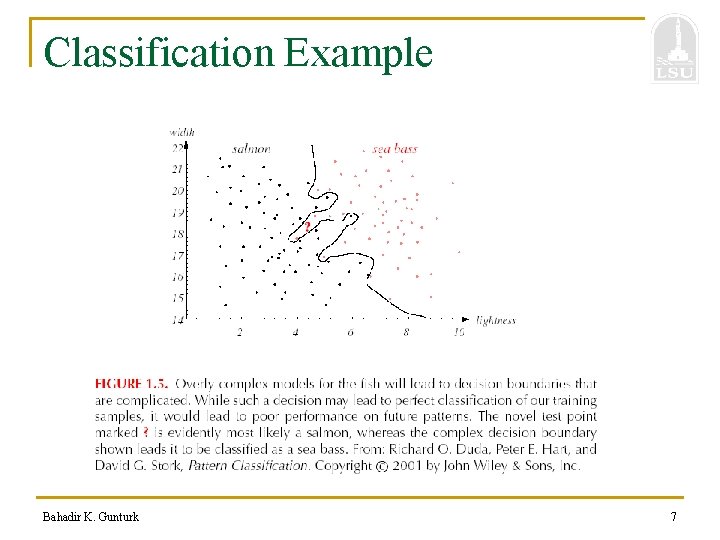
Classification Example Bahadir K. Gunturk 7
Feature Extraction n n The goal of feature extractor is to characterize an object to be recognized by measurements whose values are very similar for objects in the same category, and very different for objects in different categories. The features should be invariant to the irrelevant transformation of the input. For example, the location of a fish on the belt is irrelevant, and thus the representation should be insensitive to the location of the fish. Bahadir K. Gunturk 8
Classification n The task of the classifier is to use feature vectors (provided by the feature extractor) to assign the object to a category. Perfect classification is often impossible, a more general task is to determine the probability for each of the possible categories. The process of using data to determine the classifier is referred to as training the classifier. Bahadir K. Gunturk 9
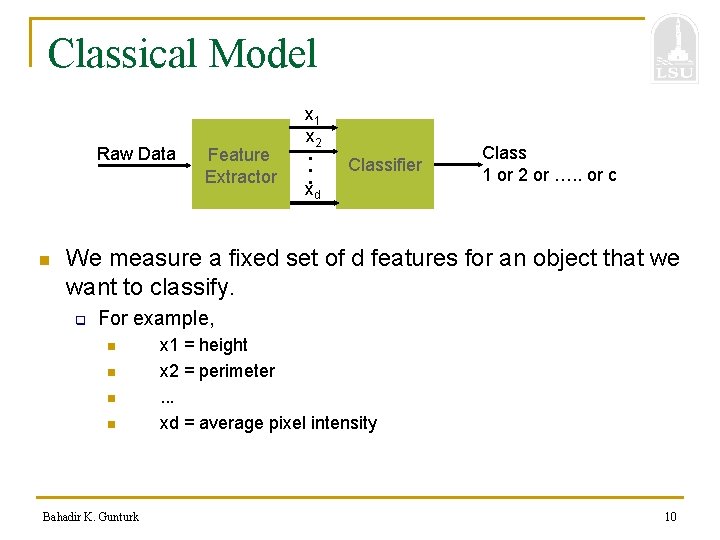
Classical Model Raw Data n Feature Extractor x 1 x 2 • • • Classifier xd Class 1 or 2 or …. . or c We measure a fixed set of d features for an object that we want to classify. q For example, n n Bahadir K. Gunturk x 1 = height x 2 = perimeter. . . xd = average pixel intensity 10
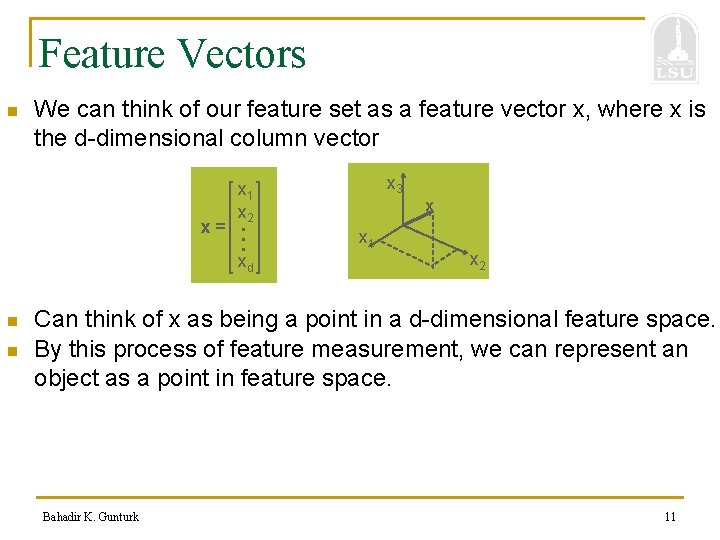
Feature Vectors n We can think of our feature set as a feature vector x, where x is the d-dimensional column vector x= • • • xd n n x 3 x 1 x 2 x x 1 x 2 Can think of x as being a point in a d-dimensional feature space. By this process of feature measurement, we can represent an object as a point in feature space. Bahadir K. Gunturk 11
What is ahead n n n Bahadir K. Gunturk Template matching Minimum-distance classifiers Metrics Inner products Linear discriminants Bayesian approach 12
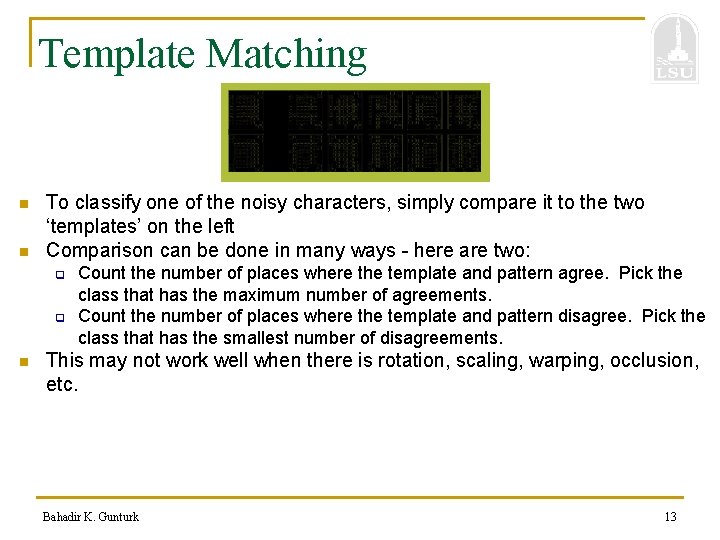
Template Matching n n To classify one of the noisy characters, simply compare it to the two ‘templates’ on the left Comparison can be done in many ways - here are two: q q n Count the number of places where the template and pattern agree. Pick the class that has the maximum number of agreements. Count the number of places where the template and pattern disagree. Pick the class that has the smallest number of disagreements. This may not work well when there is rotation, scaling, warping, occlusion, etc. Bahadir K. Gunturk 13
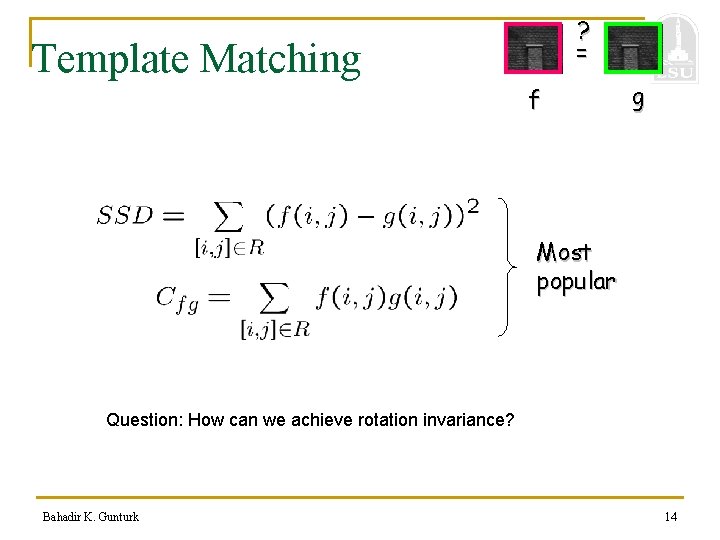
? = Template Matching f g Most popular Question: How can we achieve rotation invariance? Bahadir K. Gunturk 14
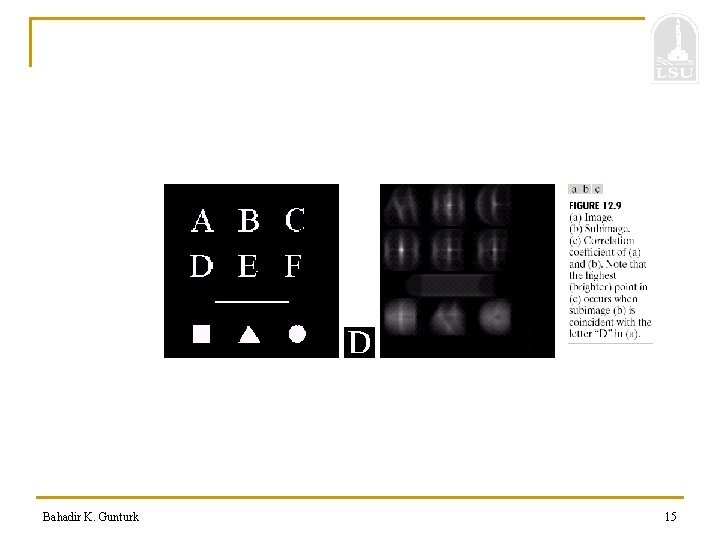
Bahadir K. Gunturk 15
Minimum Distance Classifiers n Template matching can be expressed mathematically through a notion of distance. n Let x be the feature vector for the unknown input, and let m 1, m 2, . . . , m c be templates (i. e. , perfect, noise-free feature vectors) for the c classes. n The error in matching x against mk is given by || x - mk ||. n Choose the class for which the error is a minimum. n Since || x - mk || is the distance from x to mk, the technique is called minimum distance classification. Bahadir K. Gunturk 16
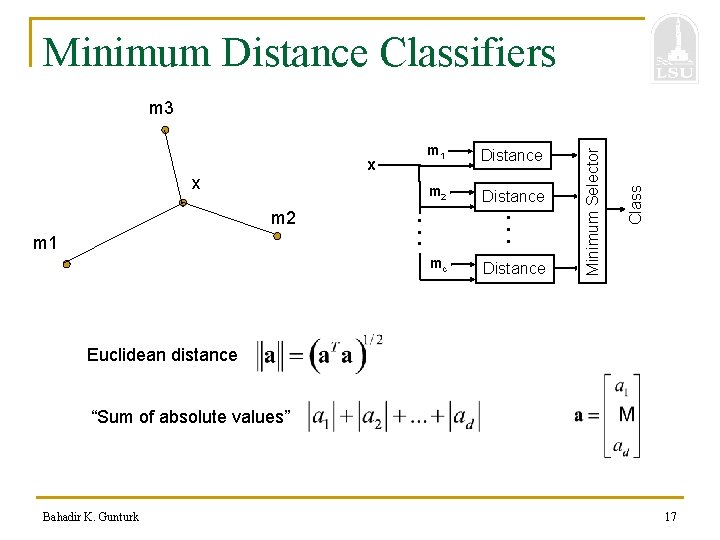
Minimum Distance Classifiers x m 2 m 1 Distance m 2 Distance • • • mc Distance Class x m 1 Minimum Selector m 3 Euclidean distance “Sum of absolute values” Bahadir K. Gunturk 17
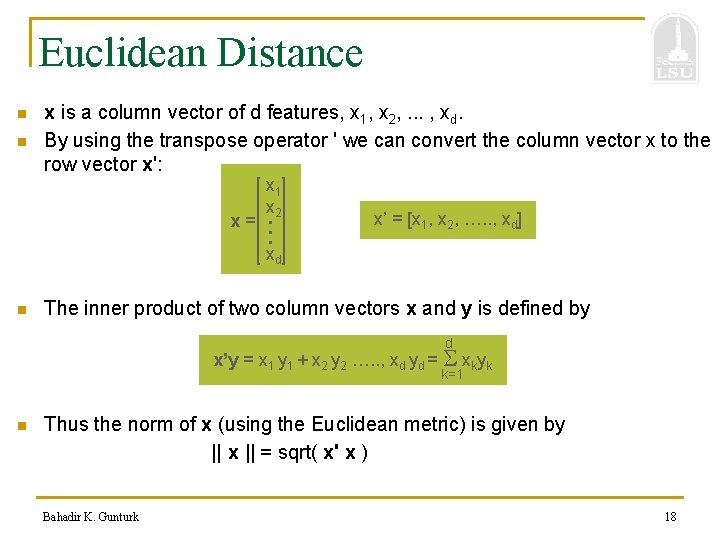
Euclidean Distance n n x is a column vector of d features, x 1, x 2, . . . , xd. By using the transpose operator ' we can convert the column vector x to the row vector x': x= x 1 x 2 • • • x’ = [x 1, x 2, …. . , xd] xd n The inner product of two column vectors x and y is defined by d x’y = x 1 y 1 + x 2 y 2 …. . , xd yd = S xkyk k=1 n Thus the norm of x (using the Euclidean metric) is given by || x || = sqrt( x' x ) Bahadir K. Gunturk 18
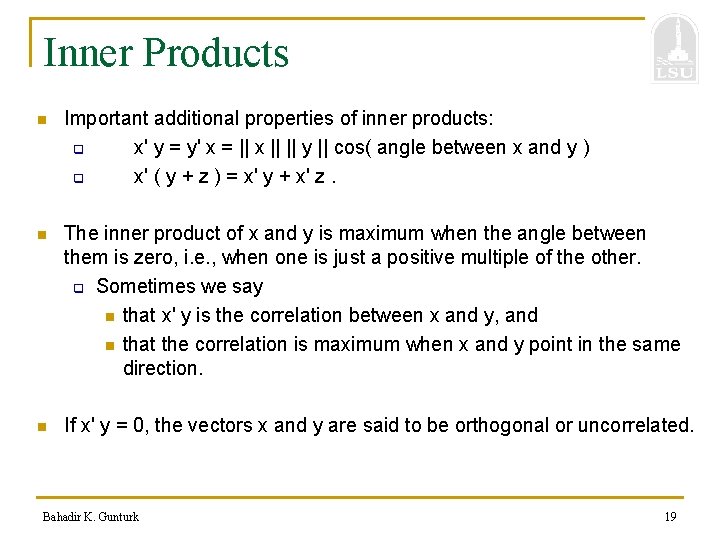
Inner Products n Important additional properties of inner products: q x' y = y' x = || x || || y || cos( angle between x and y ) q x' ( y + z ) = x' y + x' z. n The inner product of x and y is maximum when the angle between them is zero, i. e. , when one is just a positive multiple of the other. q Sometimes we say n that x' y is the correlation between x and y, and n that the correlation is maximum when x and y point in the same direction. n If x' y = 0, the vectors x and y are said to be orthogonal or uncorrelated. Bahadir K. Gunturk 19
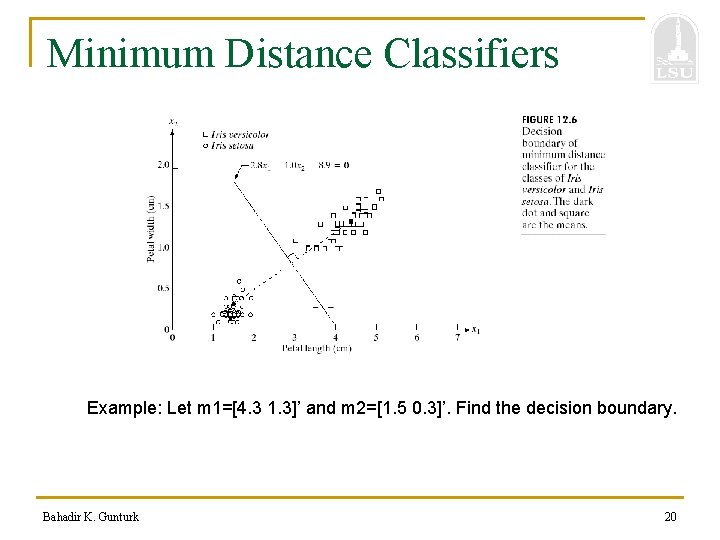
Minimum Distance Classifiers Example: Let m 1=[4. 3 1. 3]’ and m 2=[1. 5 0. 3]’. Find the decision boundary. Bahadir K. Gunturk 20
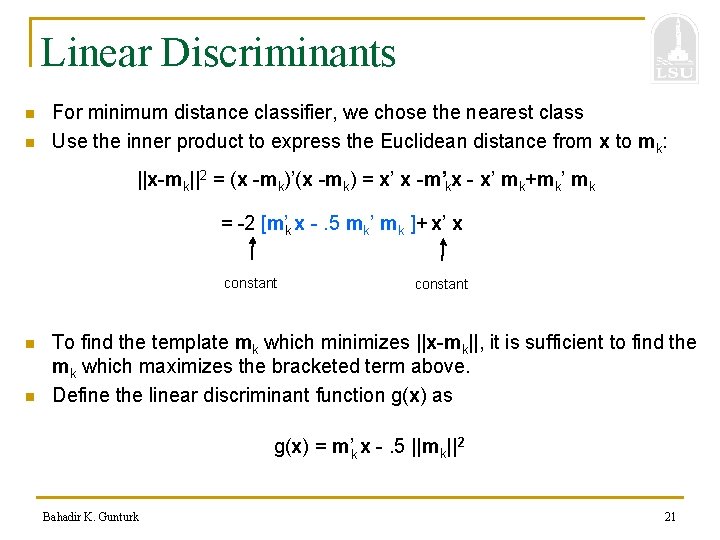
Linear Discriminants n n For minimum distance classifier, we chose the nearest class Use the inner product to express the Euclidean distance from x to mk: ||x-mk||2 = (x -mk)’(x -mk) = x’ x -m’kx - x’ mk+mk’ mk = -2 [m’k x -. 5 mk’ mk ]+ x’ x constant n n constant To find the template mk which minimizes ||x-mk||, it is sufficient to find the mk which maximizes the bracketed term above. Define the linear discriminant function g(x) as g(x) = m’k x -. 5 ||mk||2 Bahadir K. Gunturk 21
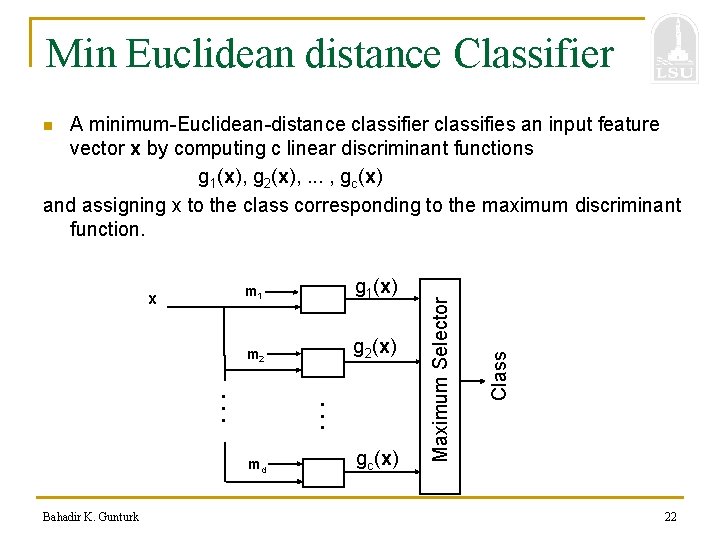
Min Euclidean distance Classifier A minimum-Euclidean-distance classifier classifies an input feature vector x by computing c linear discriminant functions g 1(x), g 2(x), . . . , gc(x) and assigning x to the class corresponding to the maximum discriminant function. m 1 g 1(x) m 2 g 2(x) • • • md Bahadir K. Gunturk gc(x) Class x Maximum Selector n 22
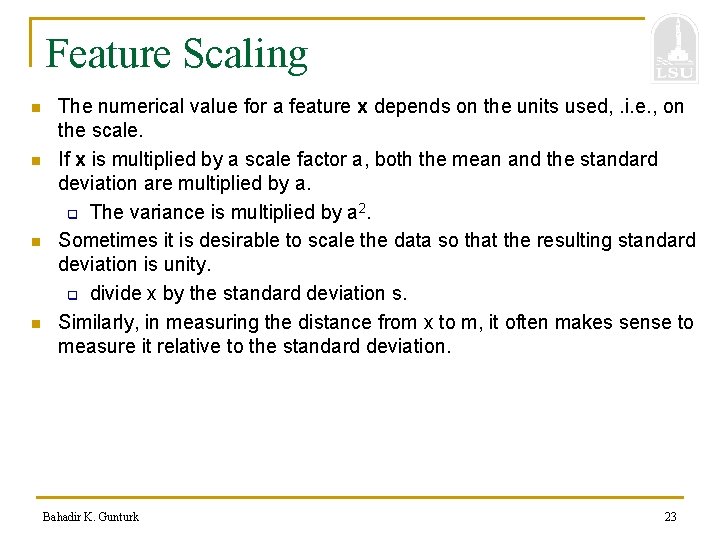
Feature Scaling n n The numerical value for a feature x depends on the units used, . i. e. , on the scale. If x is multiplied by a scale factor a, both the mean and the standard deviation are multiplied by a. q The variance is multiplied by a 2. Sometimes it is desirable to scale the data so that the resulting standard deviation is unity. q divide x by the standard deviation s. Similarly, in measuring the distance from x to m, it often makes sense to measure it relative to the standard deviation. Bahadir K. Gunturk 23
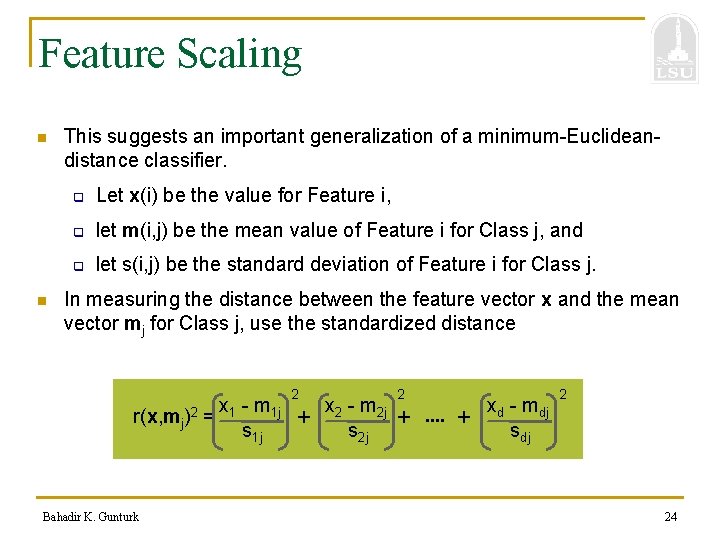
Feature Scaling n n This suggests an important generalization of a minimum-Euclideandistance classifier. q Let x(i) be the value for Feature i, q let m(i, j) be the mean value of Feature i for Class j, and q let s(i, j) be the standard deviation of Feature i for Class j. In measuring the distance between the feature vector x and the mean vector mj for Class j, use the standardized distance r(x, mj)2 = Bahadir K. Gunturk x 1 - m 1 j s 1 j 2 + x 2 - m 2 j s 2 j 2 + • • + xd - mdj sdj 2 24
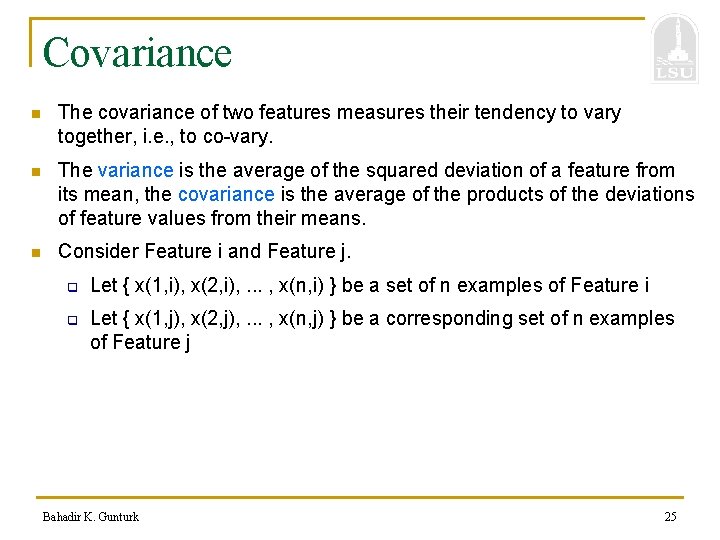
Covariance n The covariance of two features measures their tendency to vary together, i. e. , to co-vary. n The variance is the average of the squared deviation of a feature from its mean, the covariance is the average of the products of the deviations of feature values from their means. n Consider Feature i and Feature j. q q Let { x(1, i), x(2, i), . . . , x(n, i) } be a set of n examples of Feature i Let { x(1, j), x(2, j), . . . , x(n, j) } be a corresponding set of n examples of Feature j Bahadir K. Gunturk 25
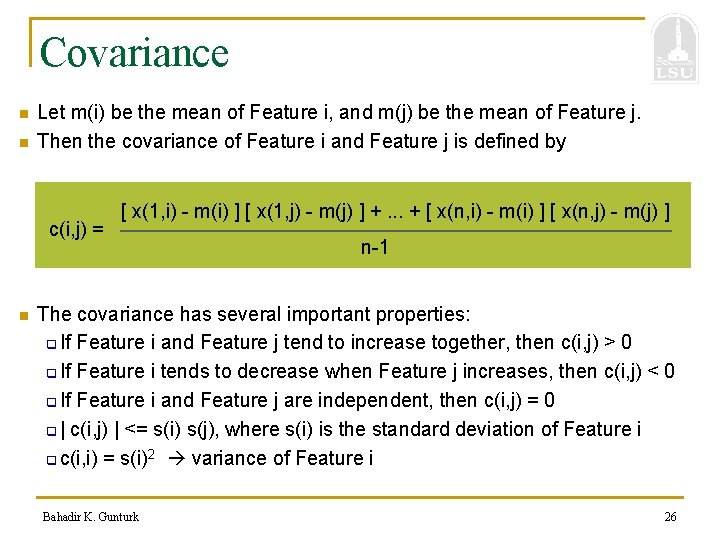
Covariance n n Let m(i) be the mean of Feature i, and m(j) be the mean of Feature j. Then the covariance of Feature i and Feature j is defined by c(i, j) = n [ x(1, i) - m(i) ] [ x(1, j) - m(j) ] +. . . + [ x(n, i) - m(i) ] [ x(n, j) - m(j) ] n-1 The covariance has several important properties: q If Feature i and Feature j tend to increase together, then c(i, j) > 0 q If Feature i tends to decrease when Feature j increases, then c(i, j) < 0 q If Feature i and Feature j are independent, then c(i, j) = 0 q | c(i, j) | <= s(i) s(j), where s(i) is the standard deviation of Feature i q c(i, i) = s(i)2 variance of Feature i Bahadir K. Gunturk 26
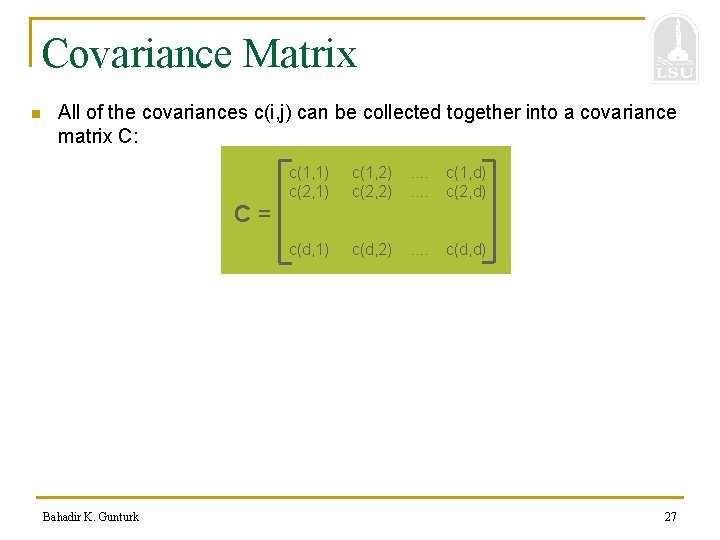
Covariance Matrix n All of the covariances c(i, j) can be collected together into a covariance matrix C: C= Bahadir K. Gunturk c(1, 1) c(2, 1) c(1, 2) c(2, 2) . . . . c(1, d) c(2, d) c(d, 1) c(d, 2) . . c(d, d) 27
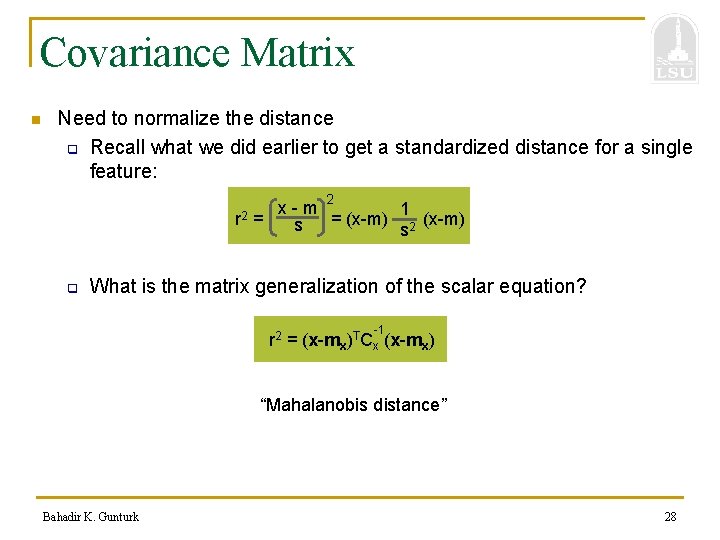
Covariance Matrix n Need to normalize the distance q Recall what we did earlier to get a standardized distance for a single feature: 2 r 2 q x-m 1 = = (x-m) s s 2 What is the matrix generalization of the scalar equation? -1 r 2 = (x-mx)TCx (x-mx) “Mahalanobis distance” Bahadir K. Gunturk 28
Pros and Cons n n The use of the Mahalanobis distance removes several of the limitations of the Euclidean metric: q It automatically accounts for the scaling of the coordinate axes q It corrects for correlation between the different features q It can provide curved as well as linear decision boundaries Cons: q Covariance matrices can be hard to determine accurately, q Memory and time requirements grow with the number of features. Bahadir K. Gunturk 29
Bayesian Decision Theory n n n Return to fish example. There are two categories. Denote these categories as w 1 for sea bass and w 2 for salmon. Assume that there is some prior probability (or simply prior) P(w 1) that the next fish is sea bass, and some prior probability that P(w 2) that it is salmon. Suppose that we make a decision without making a measurement. The logical decision rule is Decide w 1 if P(w 1) > P(w 2); otherwise decide w 2 Bahadir K. Gunturk 30
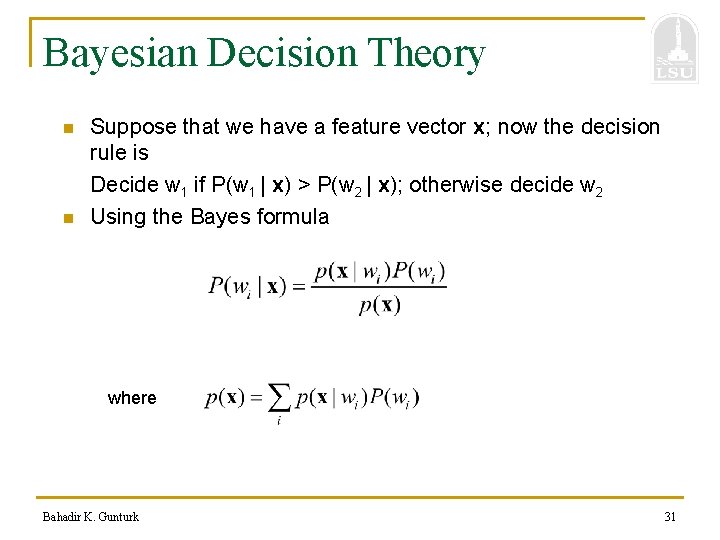
Bayesian Decision Theory n n Suppose that we have a feature vector x; now the decision rule is Decide w 1 if P(w 1 | x) > P(w 2 | x); otherwise decide w 2 Using the Bayes formula where Bahadir K. Gunturk 31

Bayesian Decision Theory n Define a set of discriminant functions gi(x), i=1, …, c Bahadir K. Gunturk 32
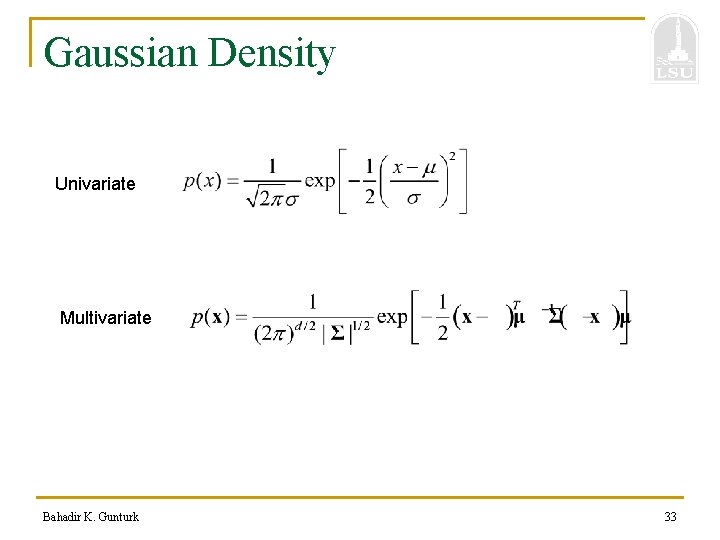
Gaussian Density Univariate Multivariate Bahadir K. Gunturk 33
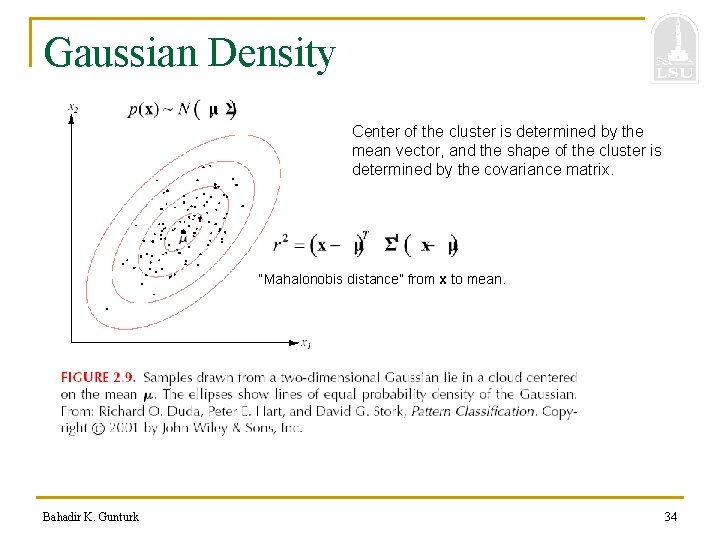
Gaussian Density Center of the cluster is determined by the mean vector, and the shape of the cluster is determined by the covariance matrix. “Mahalonobis distance” from x to mean. Bahadir K. Gunturk 34
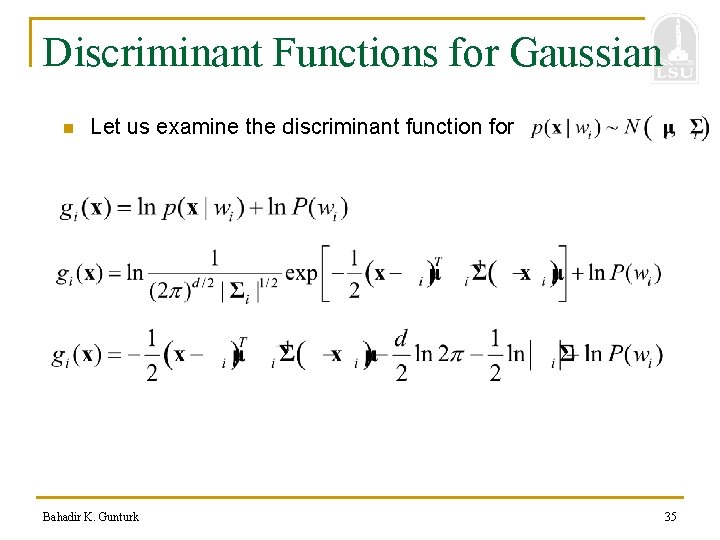
Discriminant Functions for Gaussian n Let us examine the discriminant function for Bahadir K. Gunturk 35
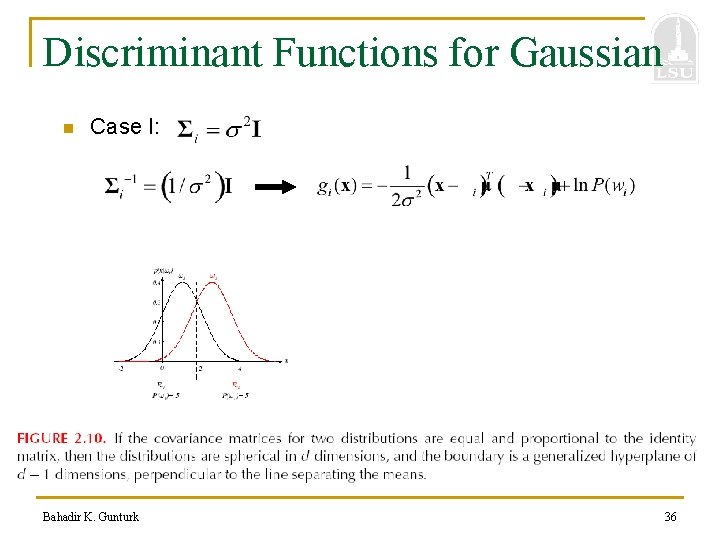
Discriminant Functions for Gaussian n Case I: Bahadir K. Gunturk 36
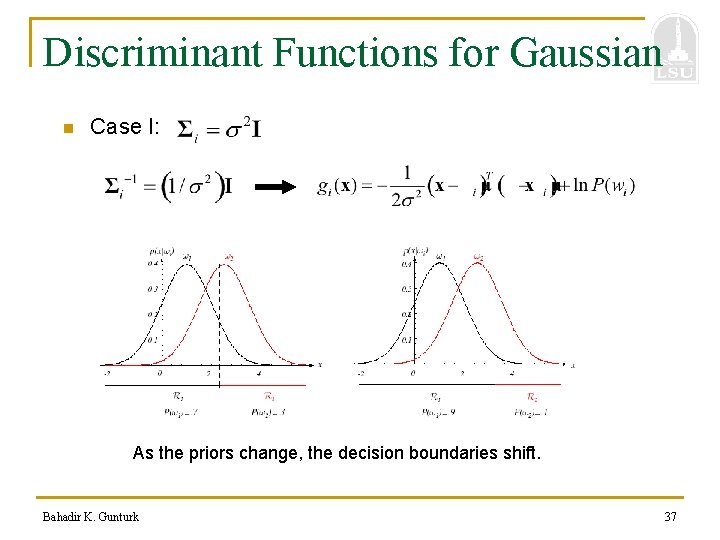
Discriminant Functions for Gaussian n Case I: As the priors change, the decision boundaries shift. Bahadir K. Gunturk 37
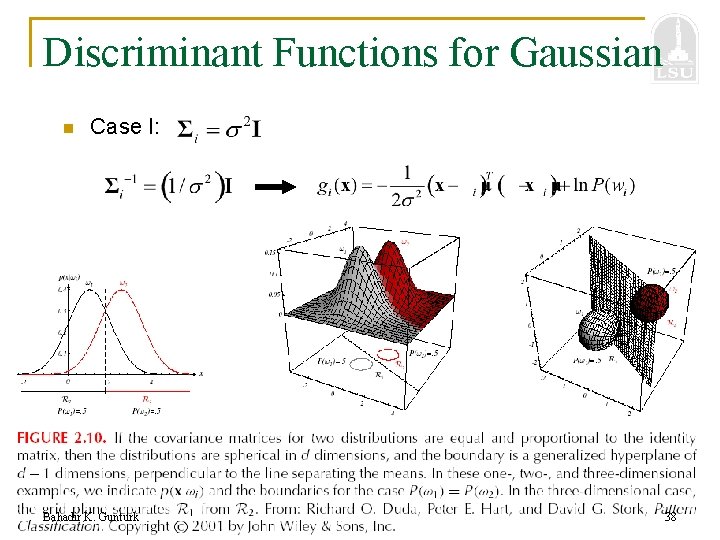
Discriminant Functions for Gaussian n Case I: Bahadir K. Gunturk 38
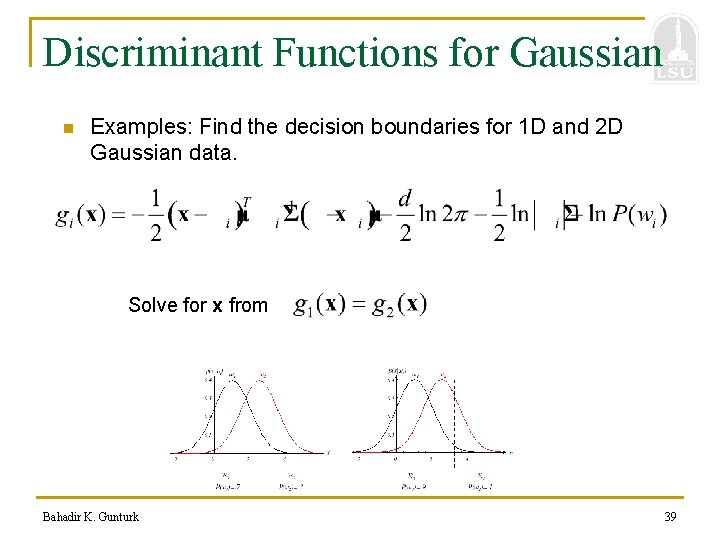
Discriminant Functions for Gaussian n Examples: Find the decision boundaries for 1 D and 2 D Gaussian data. Solve for x from Bahadir K. Gunturk 39
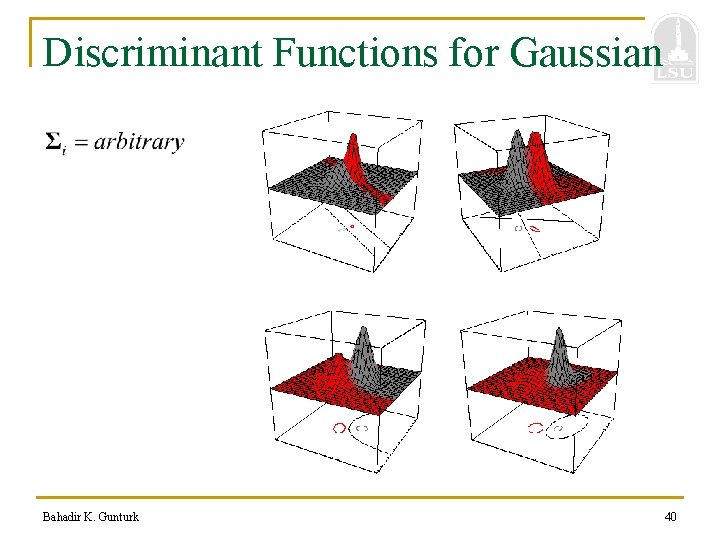
Discriminant Functions for Gaussian Bahadir K. Gunturk 40
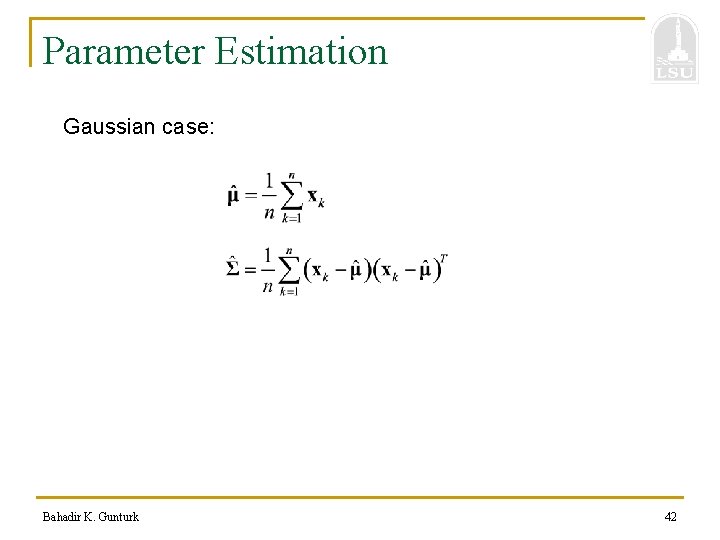
Parameter Estimation n n We learned how we could design an optimal classifier if we knew the prior probabilities P(wi) and the class-conditional densities p(x|wi). In a typical application, we rarely have complete knowledge. We typically have some general knowledge and a number of design samples (or training data). We use the samples to estimate the unknown probabilities and probability densities, and then use these estimates as if they were true values. If the densities could be parameterized, the problem is simplified significantly. (For example, for Gaussian distribution, mean and covariance matrix are the only parameters we need to estimate. ) Bahadir K. Gunturk 41
Parameter Estimation Gaussian case: Bahadir K. Gunturk 42
Dimensionality n n The accuracy degrades when the dimensionality is large. The dimensionality can be reduced by combining features. Linear combinations are attractive because they are simple to compute and analytically tractable. Dimensionality reduction techniques include q q Principal Component Analysis Fisher’s Discriminant Analysis Bahadir K. Gunturk 43
Principal Component Analysis (PCA) n Find a lower dimensional space that best represents the data in a least-squares sense. Full N-dimensional space (here N = 2) Bahadir K. Gunturk d-dimensional subspace (here d = 1) U. of Delaware 44

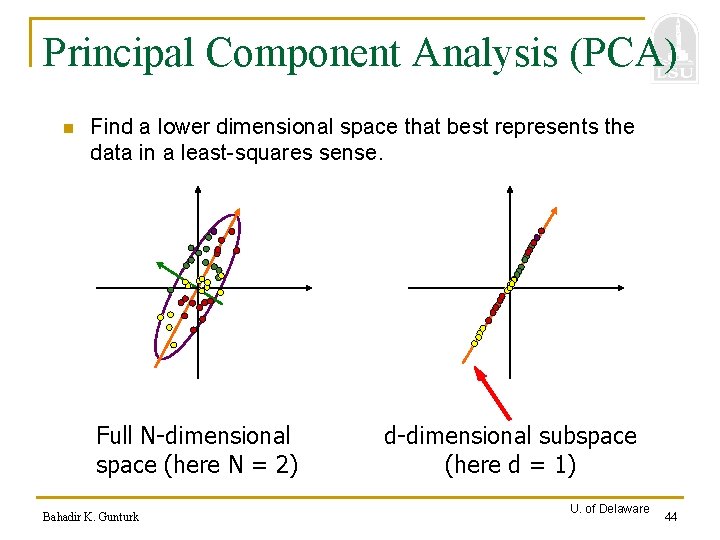
Principal Component Analysis (PCA) n We begin by considering the problem of representing Ndimensional vectors x 1, x 2, …, xn by a single vector x 0. To be more specific, suppose that we want to find a vector x 0 such that the sum of squared differences between x 0 and xk is as small as possible. Define cost function to be minimized: n The solution is the sample mean: n n Bahadir K. Gunturk 45
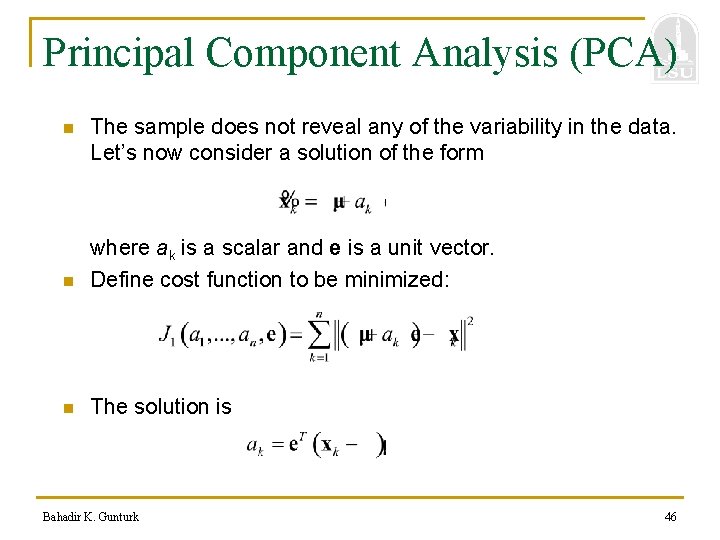
Principal Component Analysis (PCA) n The sample does not reveal any of the variability in the data. Let’s now consider a solution of the form n where ak is a scalar and e is a unit vector. Define cost function to be minimized: n The solution is Bahadir K. Gunturk 46
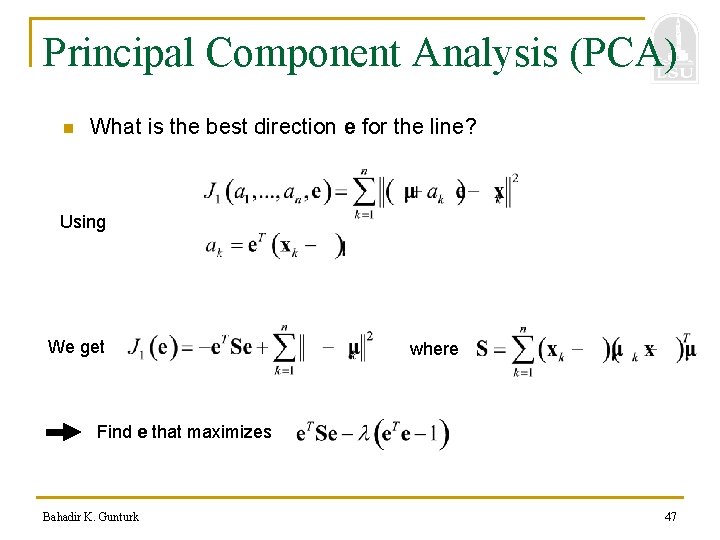
Principal Component Analysis (PCA) n What is the best direction e for the line? Using We get where Find e that maximizes Bahadir K. Gunturk 47
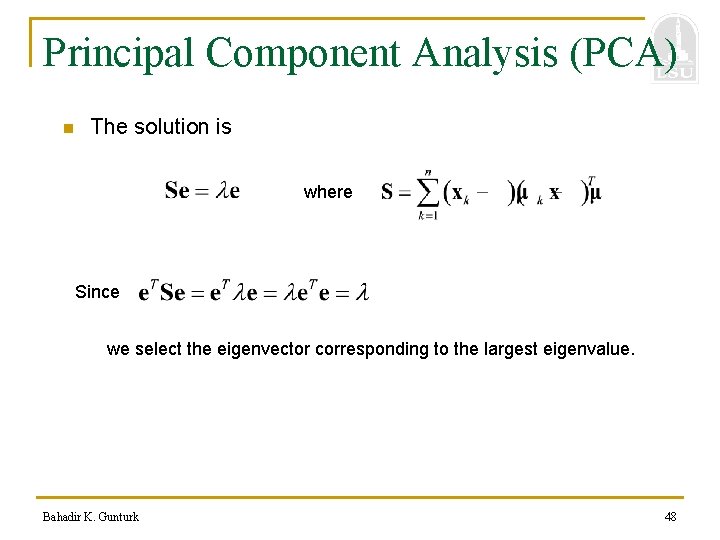
Principal Component Analysis (PCA) n The solution is where Since we select the eigenvector corresponding to the largest eigenvalue. Bahadir K. Gunturk 48
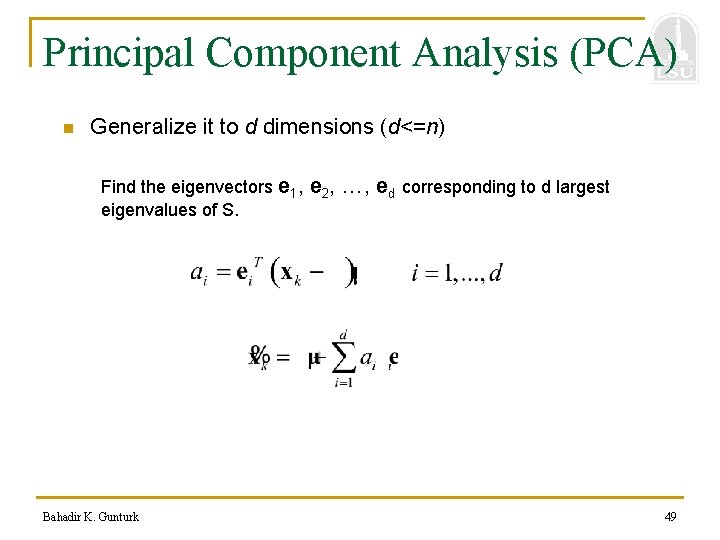
Principal Component Analysis (PCA) n Generalize it to d dimensions (d<=n) Find the eigenvectors e 1, eigenvalues of S. Bahadir K. Gunturk e 2, …, ed corresponding to d largest 49
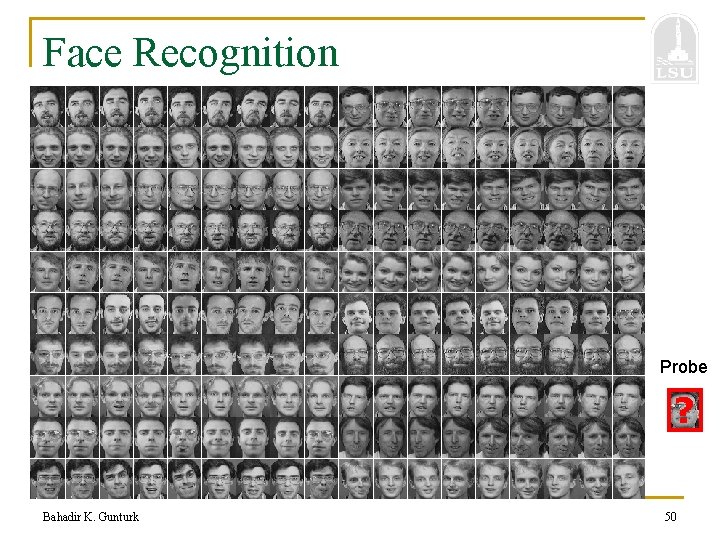
Face Recognition Probe ? Bahadir K. Gunturk 50
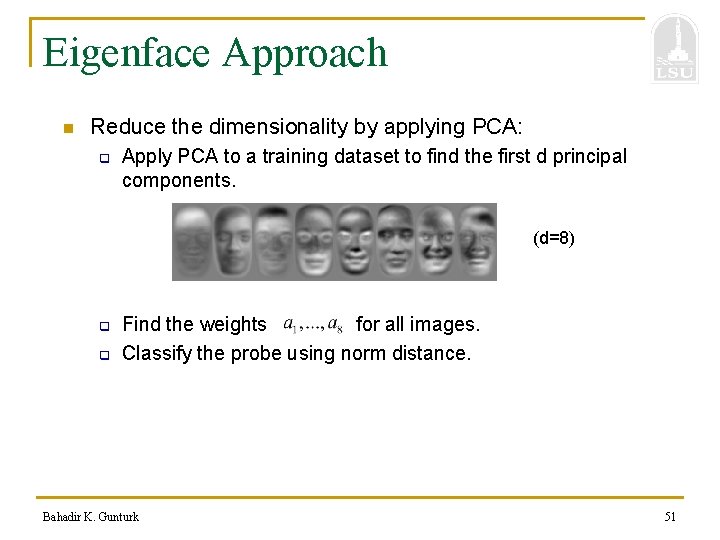
Eigenface Approach n Reduce the dimensionality by applying PCA: q Apply PCA to a training dataset to find the first d principal components. (d=8) q q Find the weights for all images. Classify the probe using norm distance. Bahadir K. Gunturk 51
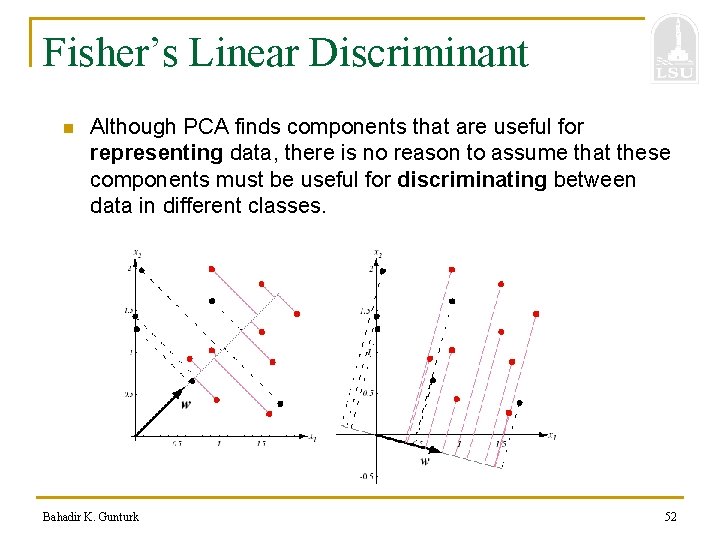
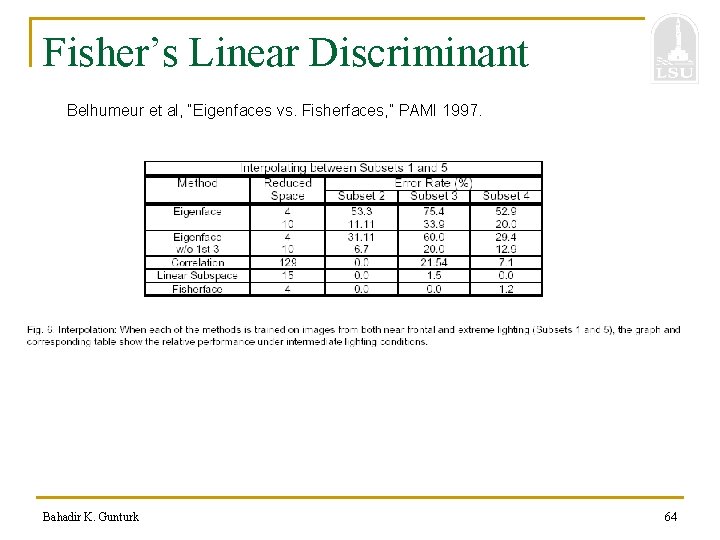
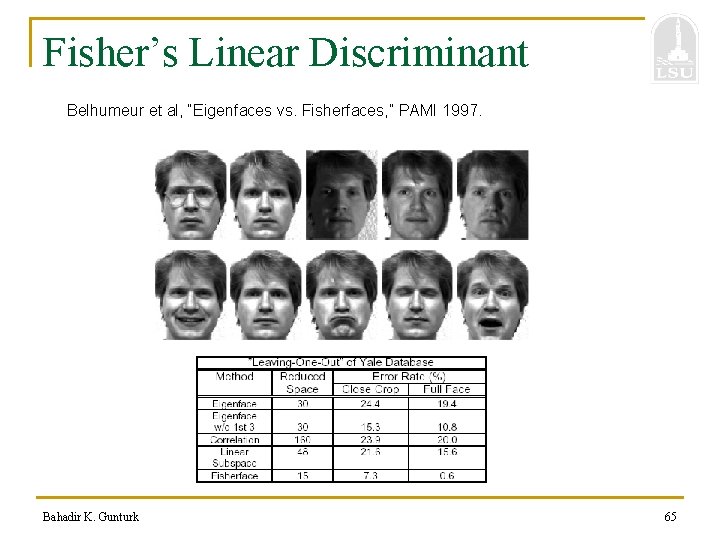
Fisher’s Linear Discriminant n Although PCA finds components that are useful for representing data, there is no reason to assume that these components must be useful for discriminating between data in different classes. Bahadir K. Gunturk 52
Fisher’s Linear Discriminant n Suppose that we have a set of N-dimensional vectors x 1, x 2, …, xn. n 1 of them is in the subset D 1; and n 2 of them is in the subset D 2. n We want to find a unit vector w that enables accurate classification. n We would like to have the means of the projected points well separated. Bahadir K. Gunturk 53
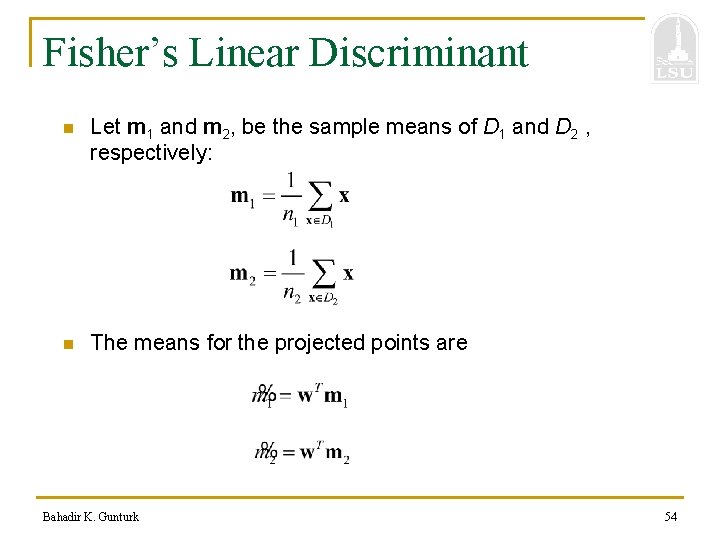
Fisher’s Linear Discriminant n Let m 1 and m 2, be the sample means of D 1 and D 2 , respectively: n The means for the projected points are Bahadir K. Gunturk 54
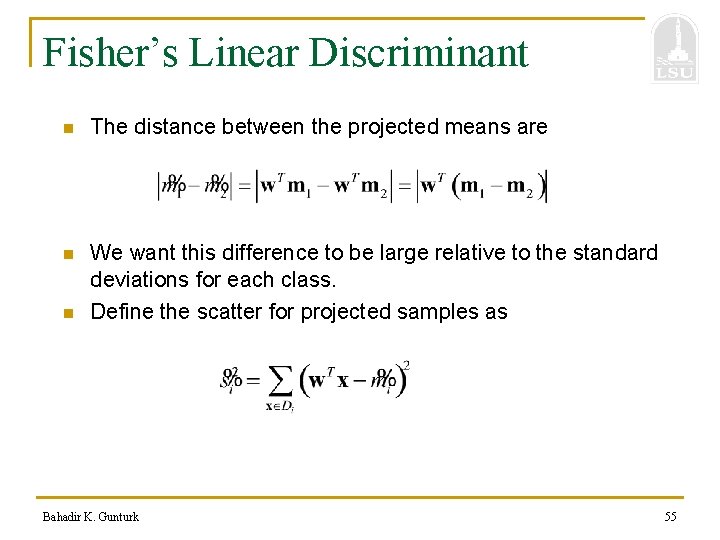
Fisher’s Linear Discriminant n The distance between the projected means are n We want this difference to be large relative to the standard deviations for each class. Define the scatter for projected samples as n Bahadir K. Gunturk 55
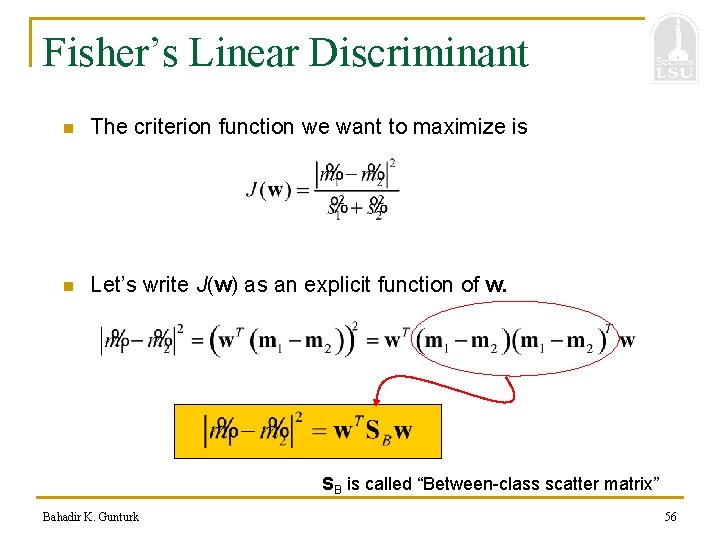
Fisher’s Linear Discriminant n The criterion function we want to maximize is n Let’s write J(w) as an explicit function of w. SB is called “Between-class scatter matrix” Bahadir K. Gunturk 56

Fisher’s Linear Discriminant n Let’s write J(w) as an explicit function of w. Sw is called “Within-class scatter matrix” Bahadir K. Gunturk 57
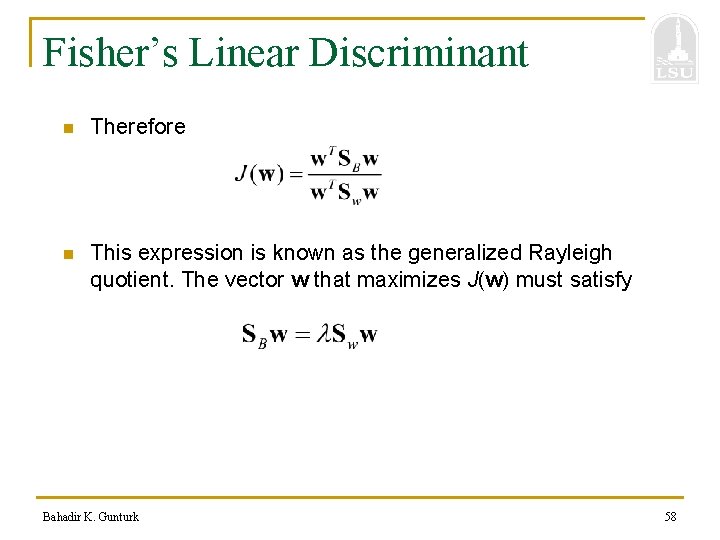
Fisher’s Linear Discriminant n Therefore n This expression is known as the generalized Rayleigh quotient. The vector w that maximizes J(w) must satisfy Bahadir K. Gunturk 58
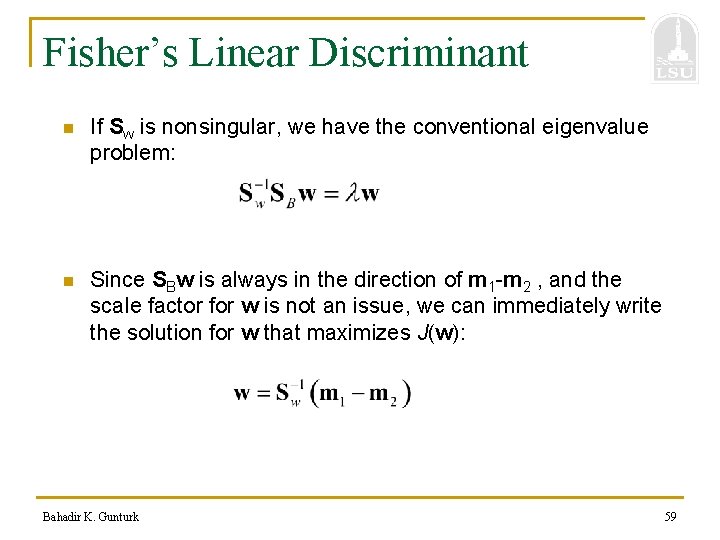
Fisher’s Linear Discriminant n If Sw is nonsingular, we have the conventional eigenvalue problem: n Since SBw is always in the direction of m 1 -m 2 , and the scale factor for w is not an issue, we can immediately write the solution for w that maximizes J(w): Bahadir K. Gunturk 59
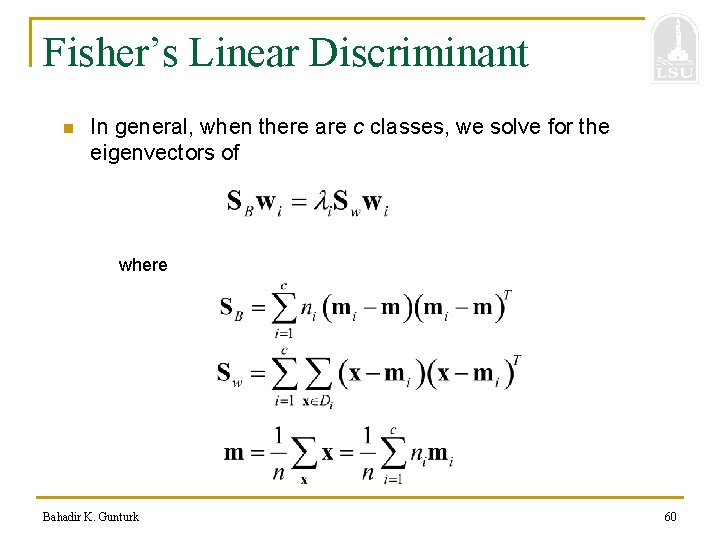
Fisher’s Linear Discriminant n In general, when there are c classes, we solve for the eigenvectors of where Bahadir K. Gunturk 60
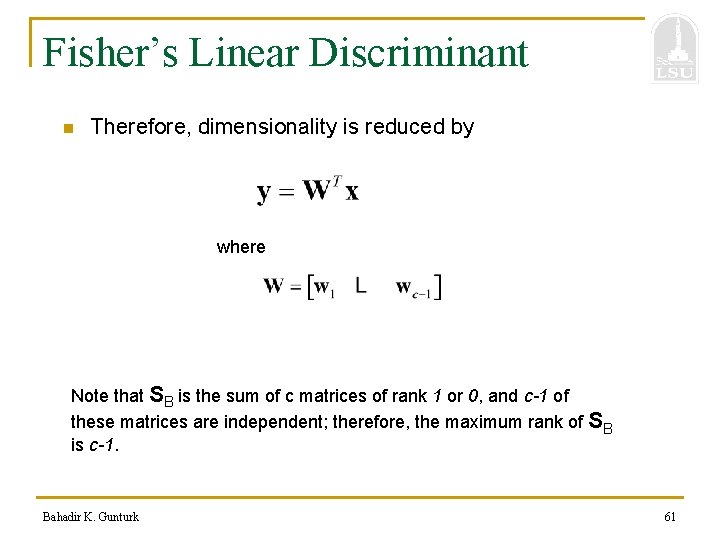
Fisher’s Linear Discriminant n Therefore, dimensionality is reduced by where Note that SB is the sum of c matrices of rank 1 or 0, and c-1 of these matrices are independent; therefore, the maximum rank of SB is c-1. Bahadir K. Gunturk 61
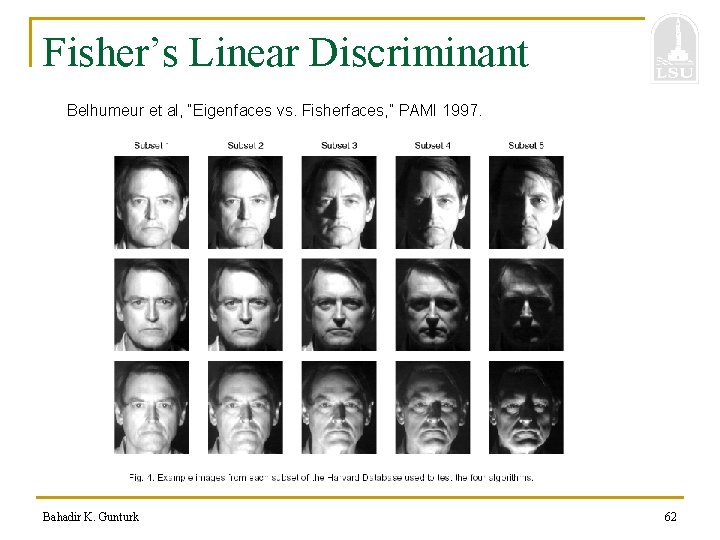
Fisher’s Linear Discriminant Belhumeur et al, “Eigenfaces vs. Fisherfaces, ” PAMI 1997. Bahadir K. Gunturk 62
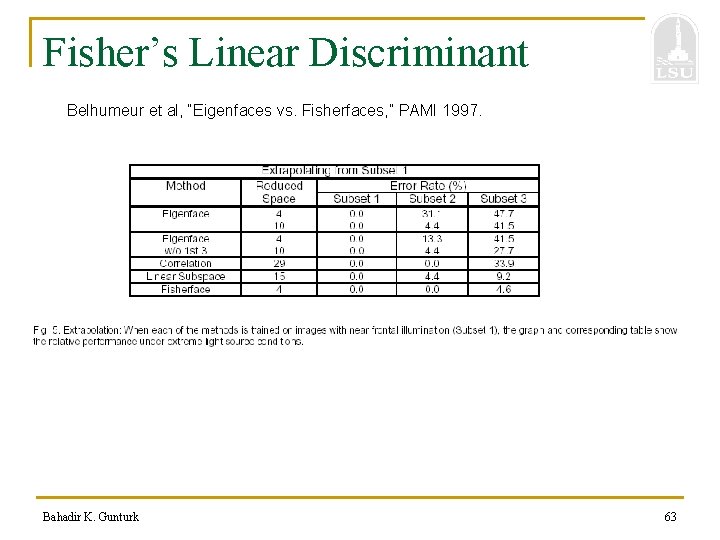
Fisher’s Linear Discriminant Belhumeur et al, “Eigenfaces vs. Fisherfaces, ” PAMI 1997. Bahadir K. Gunturk 63
Fisher’s Linear Discriminant Belhumeur et al, “Eigenfaces vs. Fisherfaces, ” PAMI 1997. Bahadir K. Gunturk 64
Fisher’s Linear Discriminant Belhumeur et al, “Eigenfaces vs. Fisherfaces, ” PAMI 1997. Bahadir K. Gunturk 65

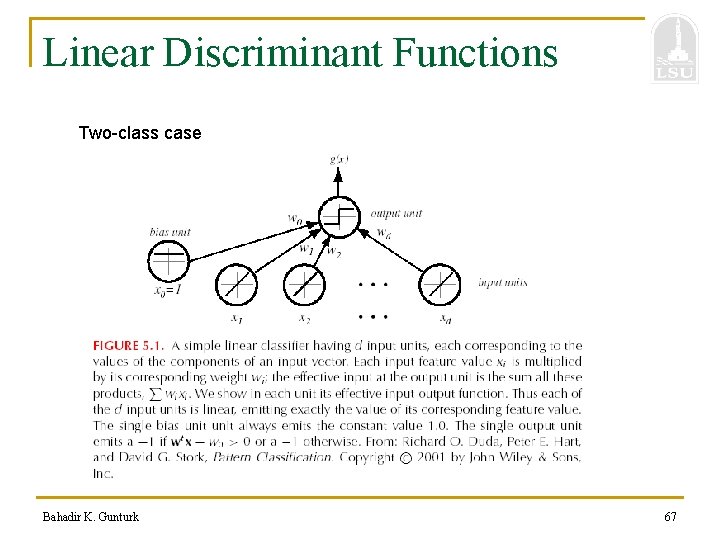
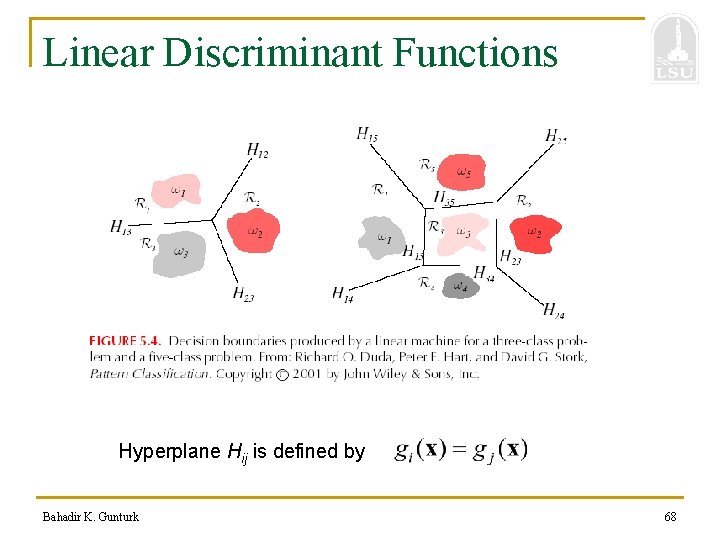
Linear Discriminant Functions n Define linear discriminant functions Assign x to wi if Bahadir K. Gunturk 66
Linear Discriminant Functions Two-class case Bahadir K. Gunturk 67
Linear Discriminant Functions Hyperplane Hij is defined by Bahadir K. Gunturk 68
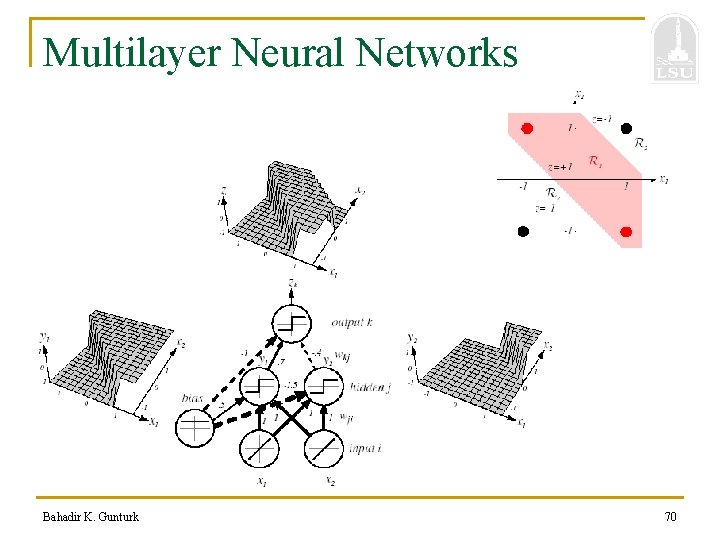
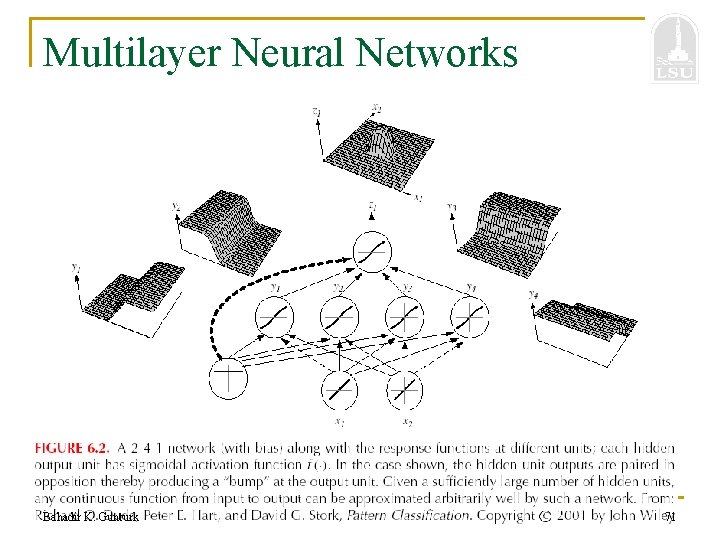
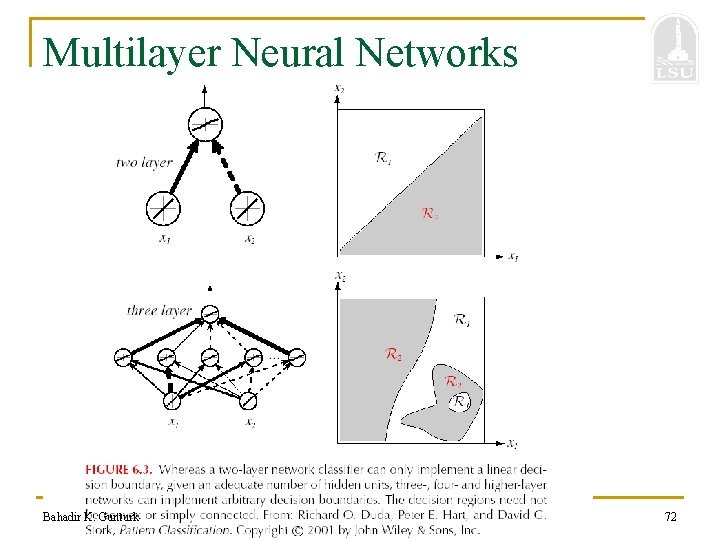
Multilayer Neural Networks n n Linear decision boundaries are useful, but often not very powerful. One way to get more complex boundaries is to apply several linear classifiers, and apply a classifier to their output. Bahadir K. Gunturk 69
Multilayer Neural Networks Bahadir K. Gunturk 70
Multilayer Neural Networks Bahadir K. Gunturk 71
Multilayer Neural Networks Bahadir K. Gunturk 72
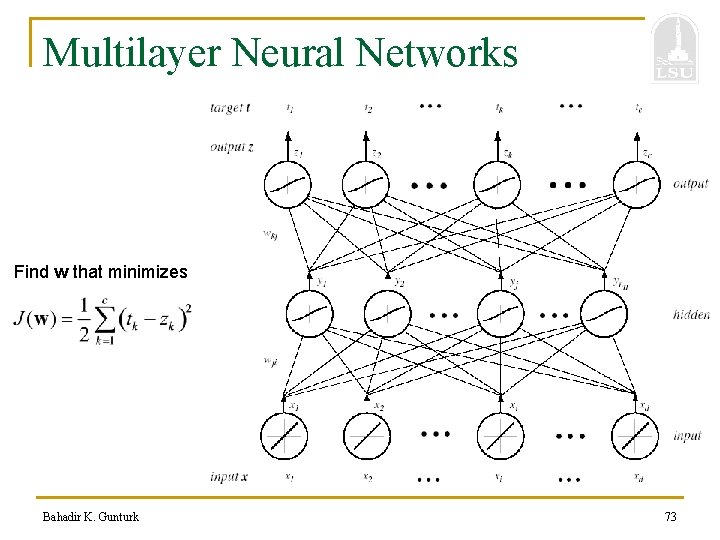
Multilayer Neural Networks Find w that minimizes Bahadir K. Gunturk 73
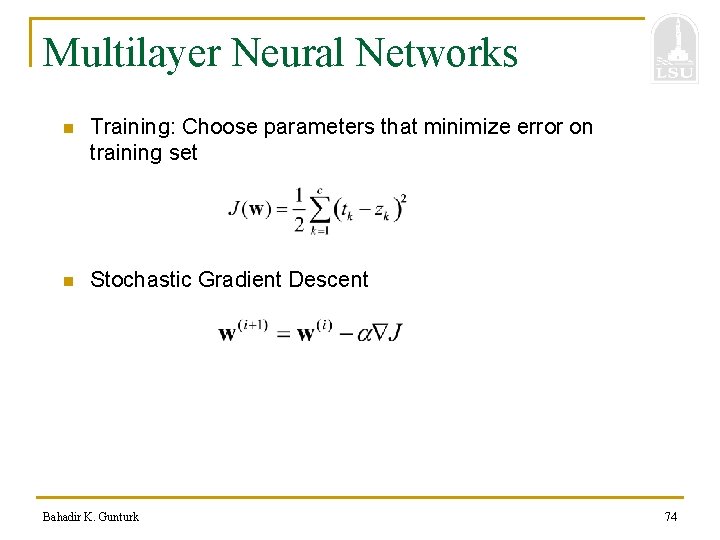
Multilayer Neural Networks n Training: Choose parameters that minimize error on training set n Stochastic Gradient Descent Bahadir K. Gunturk 74
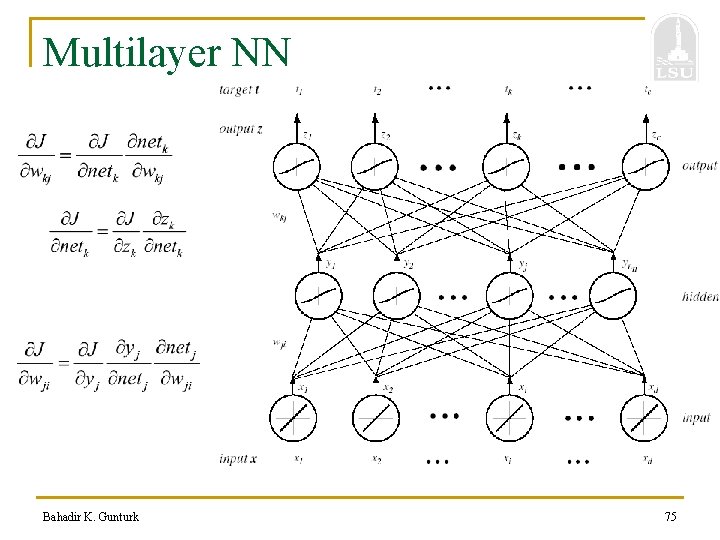
Multilayer NN Bahadir K. Gunturk 75
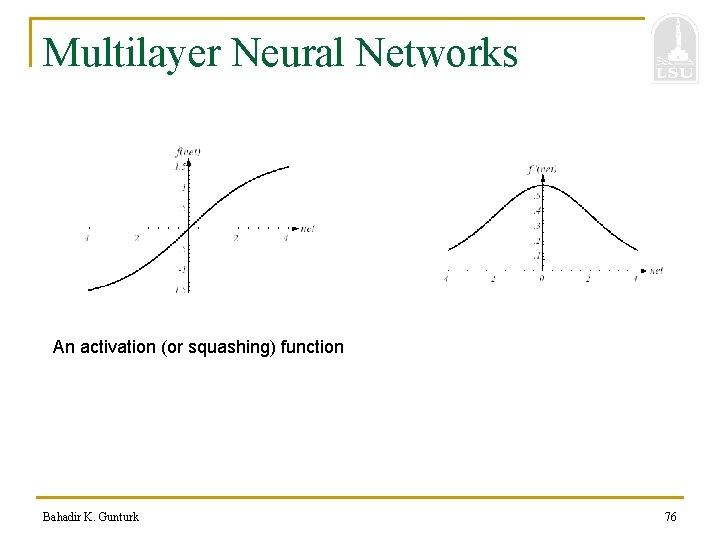
Multilayer Neural Networks An activation (or squashing) function Bahadir K. Gunturk 76
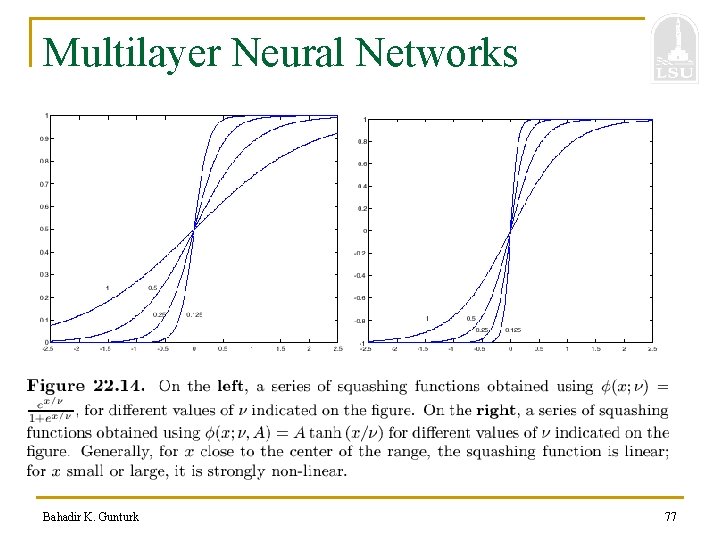
Multilayer Neural Networks Bahadir K. Gunturk 77
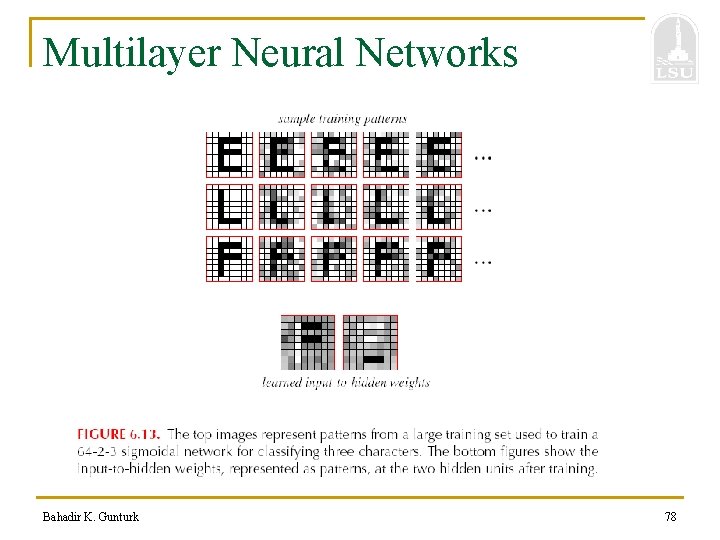
Multilayer Neural Networks Bahadir K. Gunturk 78

Multilayer Neural Networks Bahadir K. Gunturk 79
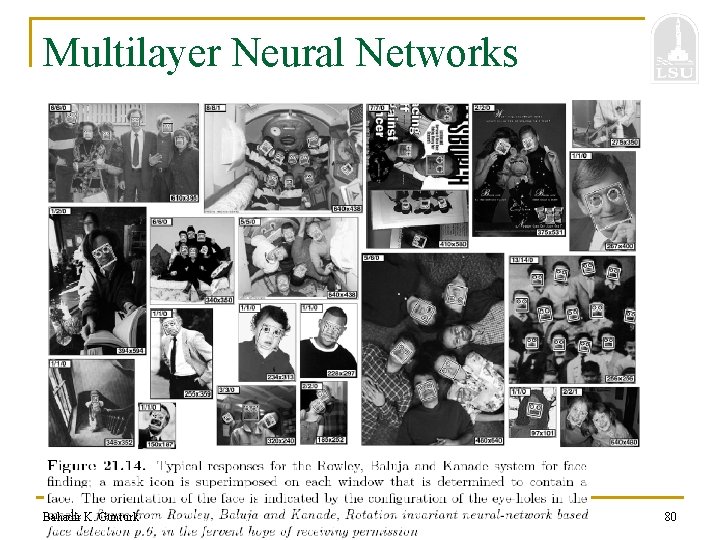
Multilayer Neural Networks Bahadir K. Gunturk 80
- Slides: 80