
EE 379 KEE 394 V Smart Grids The

- Slides: 56
EE 379 K/EE 394 V Smart Grids: The Retail Perspective Paul Wattles Senior Analyst, Market Design & Development, ERCOT Ross Baldick Department of Electrical and Computer Engineering UT-Austin March 26, 2019
Outline • ERCOT Overview • Demand charge avoidance – 4 CP response • Advanced Metering – 15 -minute Data & 15 -minute Settlement • Retail price response – Retail choice customers on dynamic price offerings – Non-Opt In Entities (NOIEs) – Impacts on the regional load curve PUBLIC 2
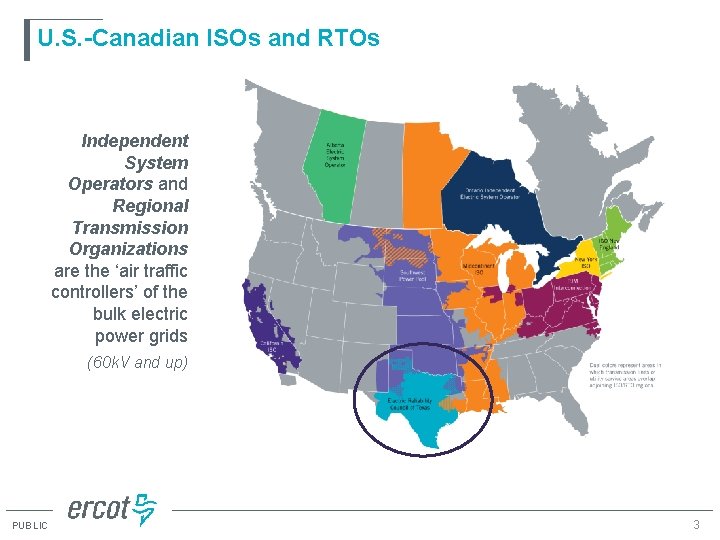
U. S. -Canadian ISOs and RTOs Independent System Operators and Regional Transmission Organizations are the ‘air traffic controllers’ of the bulk electric power grids (60 k. V and up) PUBLIC 3
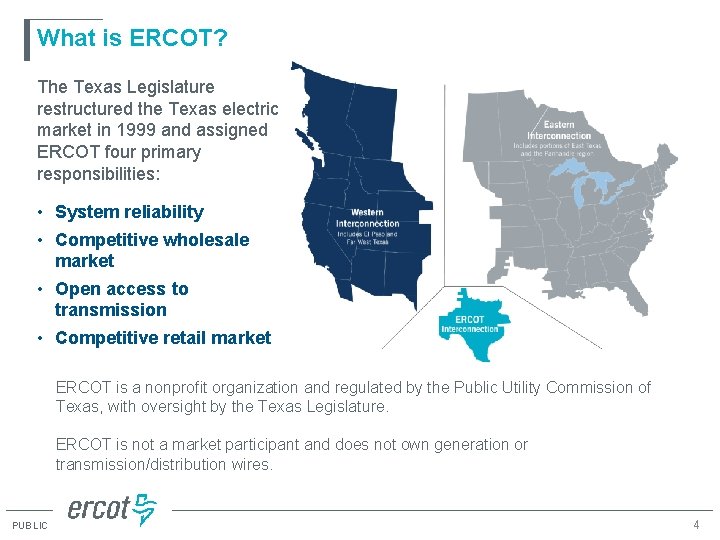
What is ERCOT? The Texas Legislature restructured the Texas electric market in 1999 and assigned ERCOT four primary responsibilities: • System reliability • Competitive wholesale market • Open access to transmission • Competitive retail market ERCOT is a nonprofit organization and regulated by the Public Utility Commission of Texas, with oversight by the Texas Legislature. ERCOT is not a market participant and does not own generation or transmission/distribution wires. PUBLIC 4
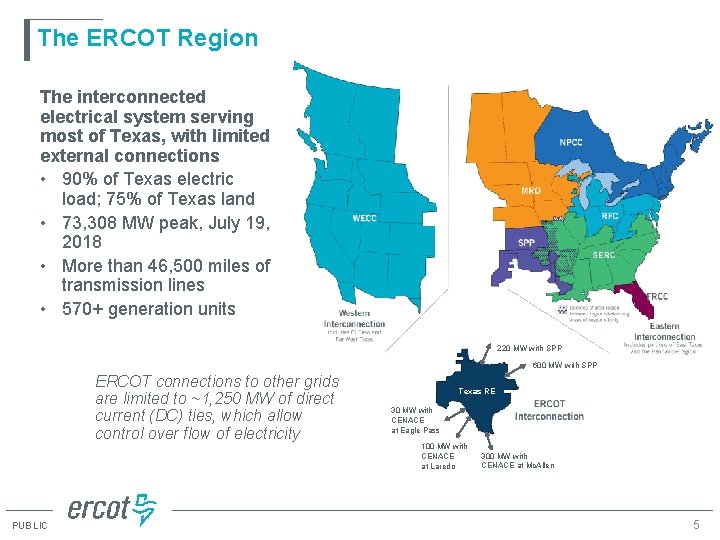
The ERCOT Region The interconnected electrical system serving most of Texas, with limited external connections • 90% of Texas electric load; 75% of Texas land • 73, 308 MW peak, July 19, 2018 • More than 46, 500 miles of transmission lines • 570+ generation units 220 MW with SPP 600 MW with SPP ERCOT connections to other grids are limited to ~1, 250 MW of direct current (DC) ties, which allow control over flow of electricity Texas RE 30 MW with CENACE at Eagle Pass 100 MW with CENACE at Laredo PUBLIC 300 MW with CENACE at Mc. Allen 5
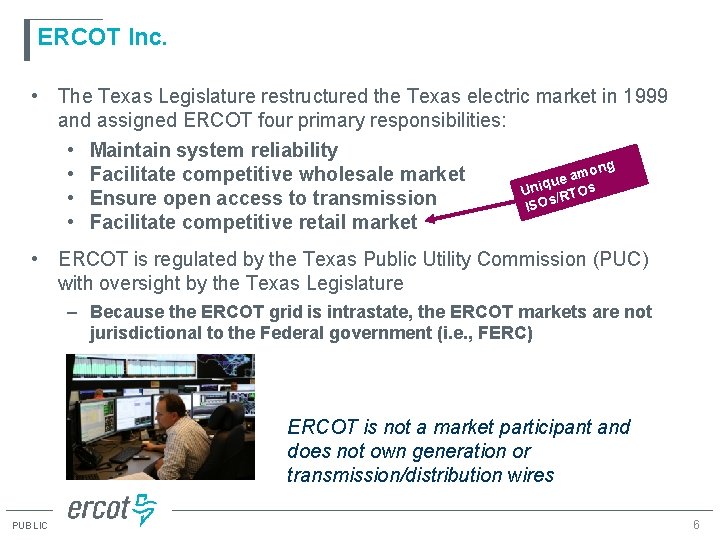
ERCOT Inc. • The Texas Legislature restructured the Texas electric market in 1999 and assigned ERCOT four primary responsibilities: • Maintain system reliability ong m • Facilitate competitive wholesale market a ue Uniq RTOs / • Ensure open access to transmission ISOs • Facilitate competitive retail market • ERCOT is regulated by the Texas Public Utility Commission (PUC) with oversight by the Texas Legislature – Because the ERCOT grid is intrastate, the ERCOT markets are not jurisdictional to the Federal government (i. e. , FERC) ERCOT is not a market participant and does not own generation or transmission/distribution wires PUBLIC 6
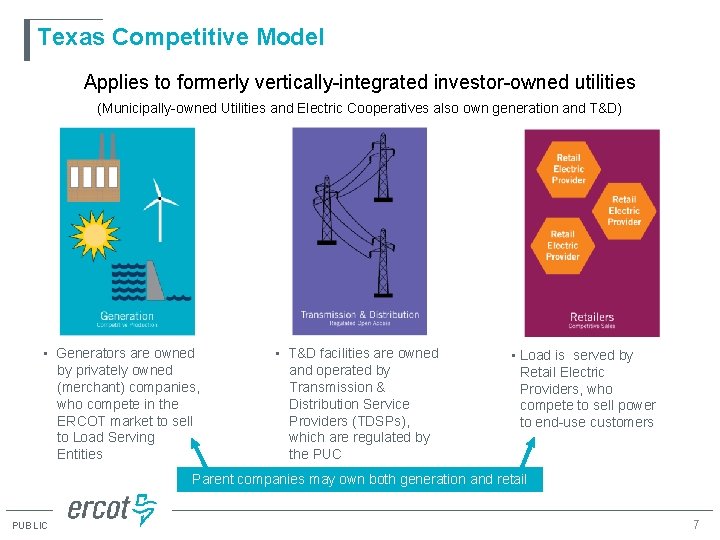
Texas Competitive Model Applies to formerly vertically-integrated investor-owned utilities (Municipally-owned Utilities and Electric Cooperatives also own generation and T&D) • Generators are owned by privately owned (merchant) companies, who compete in the ERCOT market to sell to Load Serving Entities • T&D facilities are owned and operated by Transmission & Distribution Service Providers (TDSPs), which are regulated by the PUC • Load is served by Retail Electric Providers, who compete to sell power to end-use customers Parent companies may own both generation and retail PUBLIC 7
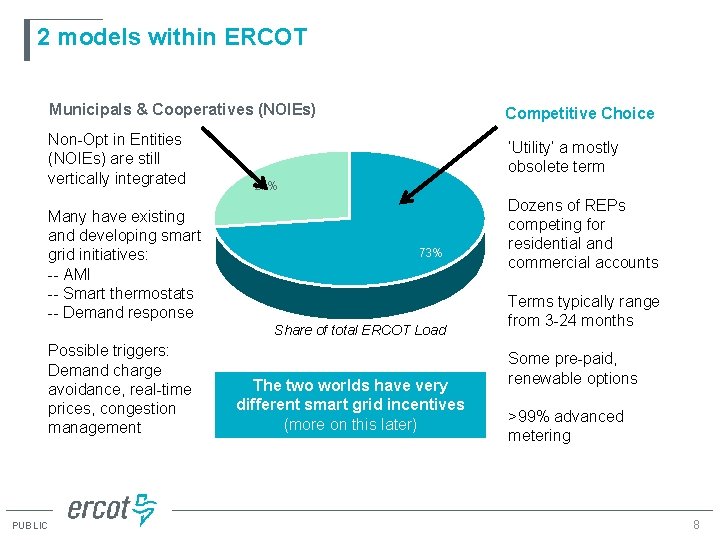
2 models within ERCOT Municipals & Cooperatives (NOIEs) Competitive Choice Non-Opt in Entities (NOIEs) are still vertically integrated ‘Utility’ a mostly obsolete term Many have existing and developing smart grid initiatives: -- AMI -- Smart thermostats -- Demand response 27% 73% Share of total ERCOT Load Possible triggers: Demand charge avoidance, real-time prices, congestion management PUBLIC The two worlds have very different smart grid incentives (more on this later) Dozens of REPs competing for residential and commercial accounts Terms typically range from 3 -24 months Some pre-paid, renewable options >99% advanced metering 8
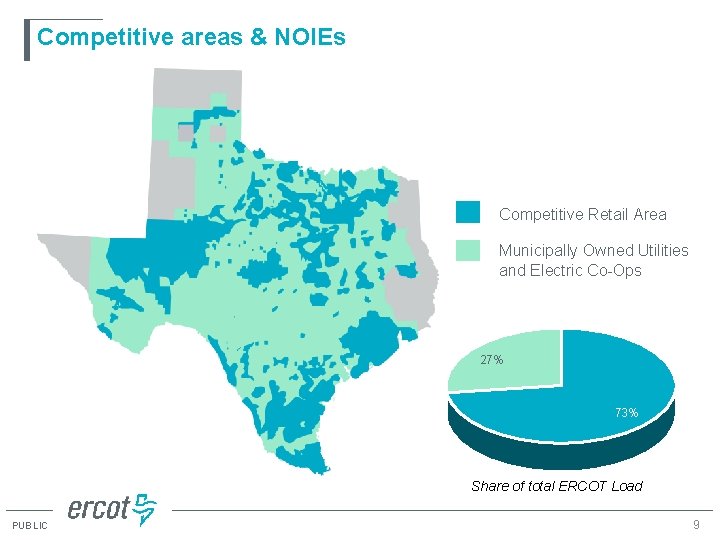
Competitive areas & NOIEs Competitive Retail Area Municipally Owned Utilities and Electric Co-Ops 27% 73% Share of total ERCOT Load PUBLIC 9
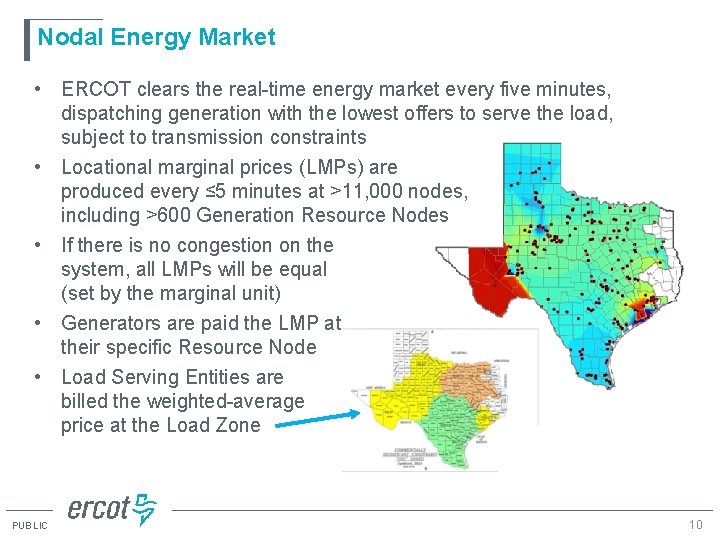
Nodal Energy Market • ERCOT clears the real-time energy market every five minutes, dispatching generation with the lowest offers to serve the load, subject to transmission constraints • Locational marginal prices (LMPs) are produced every ≤ 5 minutes at >11, 000 nodes, including >600 Generation Resource Nodes • If there is no congestion on the system, all LMPs will be equal (set by the marginal unit) • Generators are paid the LMP at their specific Resource Node • Load Serving Entities are billed the weighted-average price at the Load Zone PUBLIC 10
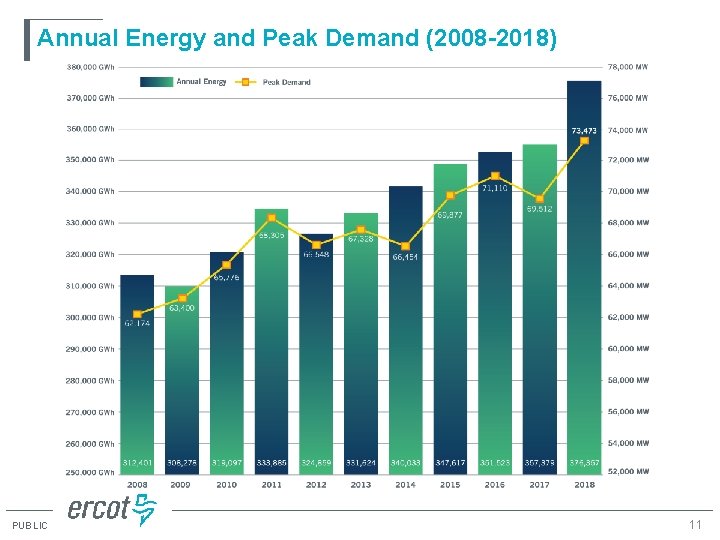
Annual Energy and Peak Demand (2008 -2018) PUBLIC 11
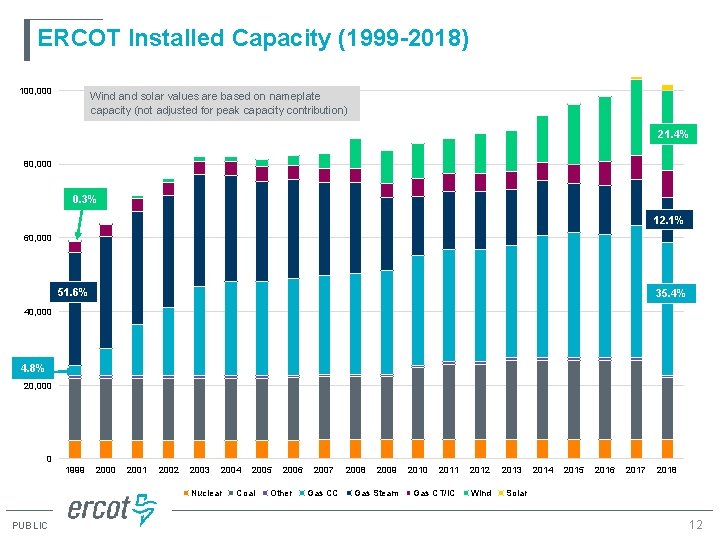
ERCOT Installed Capacity (1999 -2018) 100, 000 Wind and solar values are based on nameplate capacity (not adjusted for peak capacity contribution) 21. 4% 80, 000 0. 3% 12. 1% 60, 000 51. 6% 35. 4% 40, 000 4. 8% 20, 000 0 1999 2000 2001 2002 2003 2004 Nuclear PUBLIC 2005 Coal 2006 Other 2007 Gas CC 2008 2009 Gas Steam 2010 2011 Gas CT/IC 2012 Wind 2013 2014 2015 2016 2017 2018 Solar 12
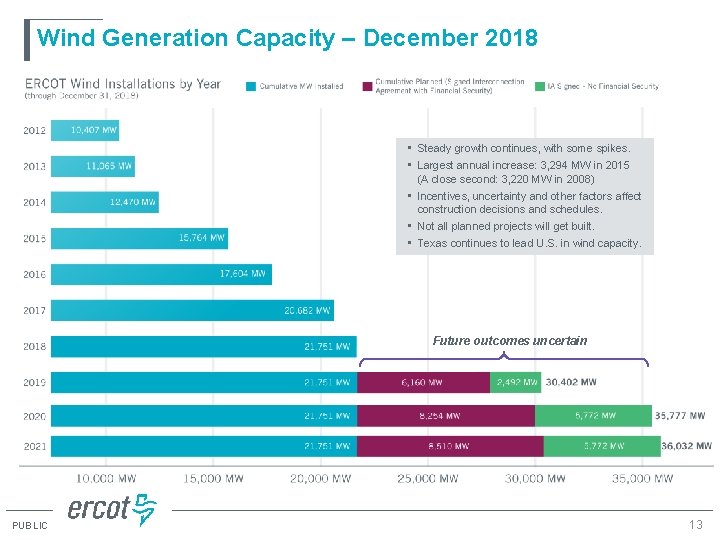
Wind Generation Capacity – December 2018 • Steady growth continues, with some spikes. • Largest annual increase: 3, 294 MW in 2015 (A close second: 3, 220 MW in 2008) • Incentives, uncertainty and other factors affect construction decisions and schedules. • Not all planned projects will get built. • Texas continues to lead U. S. in wind capacity. Future outcomes uncertain PUBLIC 13
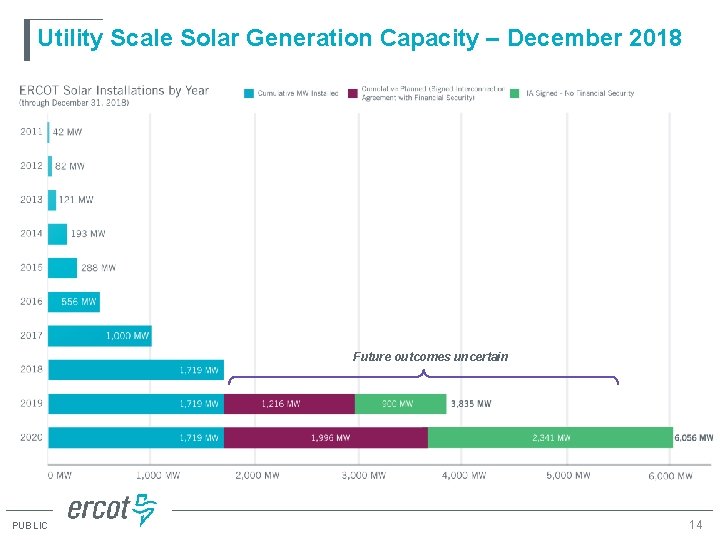
Utility Scale Solar Generation Capacity – December 2018 Future outcomes uncertain PUBLIC 14
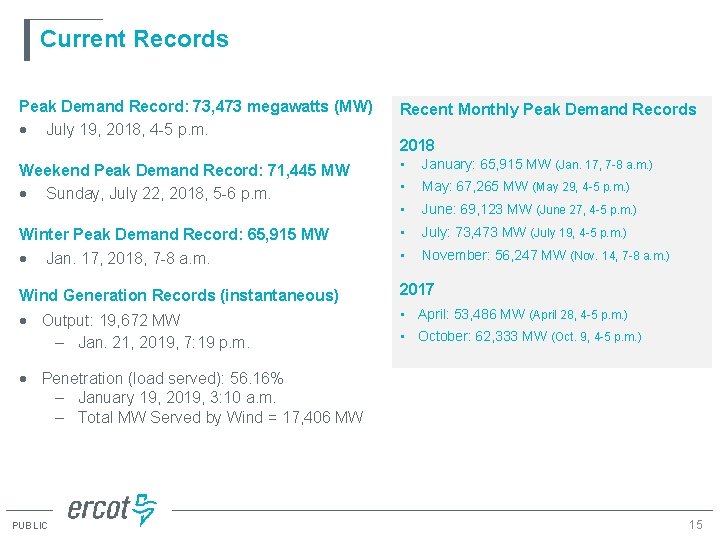
Current Records Peak Demand Record: 73, 473 megawatts (MW) July 19, 2018, 4 -5 p. m. Recent Monthly Peak Demand Records Weekend Peak Demand Record: 71, 445 MW Sunday, July 22, 2018, 5 -6 p. m. • January: 65, 915 MW (Jan. 17, 7 -8 a. m. ) • May: 67, 265 MW (May 29, 4 -5 p. m. ) • June: 69, 123 MW (June 27, 4 -5 p. m. ) Winter Peak Demand Record: 65, 915 MW Jan. 17, 2018, 7 -8 a. m. • July: 73, 473 MW (July 19, 4 -5 p. m. ) • November: 56, 247 MW (Nov. 14, 7 -8 a. m. ) Wind Generation Records (instantaneous) 2017 Output: 19, 672 MW ‒ Jan. 21, 2019, 7: 19 p. m. • April: 53, 486 MW (April 28, 4 -5 p. m. ) 2018 • October: 62, 333 MW (Oct. 9, 4 -5 p. m. ) Penetration (load served): 56. 16% ‒ January 19, 2019, 3: 10 a. m. ‒ Total MW Served by Wind = 17, 406 MW PUBLIC 15
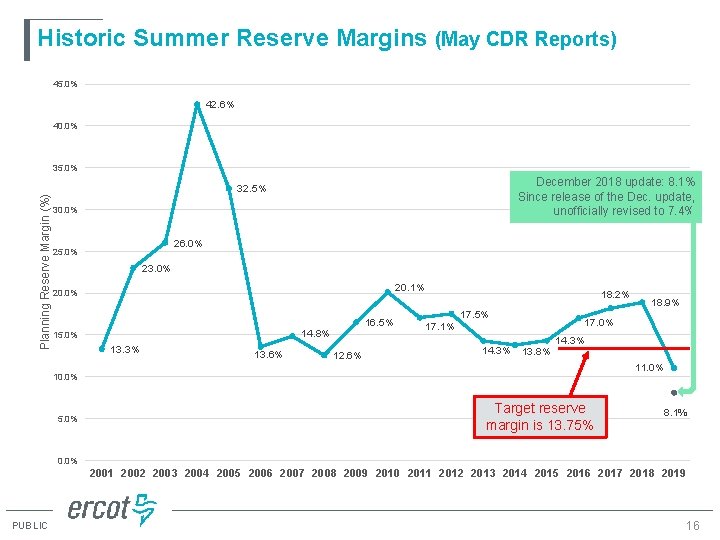
Historic Summer Reserve Margins (May CDR Reports) 45. 0% 42. 6% 40. 0% Planning Reserve Margin (%) 35. 0% December 2018 update: 8. 1% Since release of the Dec. update, unofficially revised to 7. 4% 32. 5% 30. 0% 26. 0% 25. 0% 23. 0% 20. 1% 20. 0% 16. 5% 14. 8% 15. 0% 13. 3% 13. 6% 12. 6% 18. 2% 17. 5% 17. 1% 14. 3% 13. 8% 17. 0% 14. 3% 11. 0% 10. 0% 5. 0% 18. 9% Target reserve margin is 13. 75% 8. 1% 0. 0% 2001 2002 2003 2004 2005 2006 2007 2008 2009 2010 2011 2012 2013 2014 2015 2016 2017 2018 2019 PUBLIC 16
Demand Charge Avoidance (4 CP)
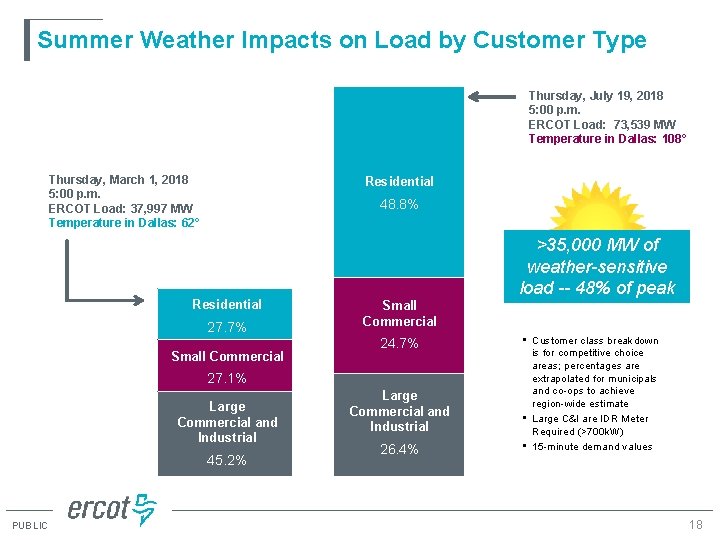
Summer Weather Impacts on Load by Customer Type Thursday, July 19, 2018 5: 00 p. m. ERCOT Load: 73, 539 MW Temperature in Dallas: 108° Thursday, March 1, 2018 5: 00 p. m. ERCOT Load: 37, 997 MW Temperature in Dallas: 62° Residential 48. 8% Residential 27. 7% Small Commercial >35, 000 MW of weather-sensitive load -- 48% of peak Small Commercial 24. 7% 27. 1% Large Commercial and Industrial 45. 2% PUBLIC Large Commercial and Industrial 26. 4% • Customer class breakdown is for competitive choice areas; percentages are extrapolated for municipals and co-ops to achieve region-wide estimate • Large C&I are IDR Meter Required (>700 k. W) • 15 -minute demand values 18
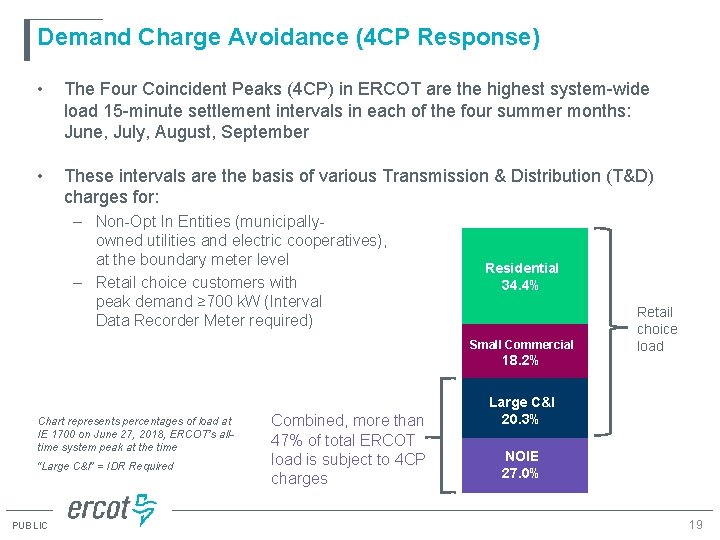
Demand Charge Avoidance (4 CP Response) • The Four Coincident Peaks (4 CP) in ERCOT are the highest system-wide load 15 -minute settlement intervals in each of the four summer months: June, July, August, September • These intervals are the basis of various Transmission & Distribution (T&D) charges for: – Non-Opt In Entities (municipallyowned utilities and electric cooperatives), at the boundary meter level – Retail choice customers with peak demand ≥ 700 k. W (Interval Data Recorder Meter required) Residential 34. 4% Small Commercial 18. 2% Chart represents percentages of load at IE 1700 on June 27, 2018, ERCOT’s alltime system peak at the time “Large C&I” = IDR Required PUBLIC Combined, more than 47% of total ERCOT load is subject to 4 CP charges Retail choice load Large C&I 20. 3% NOIE 27. 0% 19
4 CP Demand Charges • Transmission Service Providers’ (TSPs) recoverable costs are pooled and then billed to Distribution Service Providers (DSPs), based on the DSP’s load ratio share and a uniform ‘postage stamp’ rate approved by PUC • Rate is the same across the region, regardless of the location of the transmission facilities • Simple average of the DSP’s metered load during the 4 CP intervals is multiplied by the prevailing postage stamp rate • DSPs then pay into the pool; funds are disbursed to TSPs based on their share of the recoverable costs • DSPs collect funds from customers via tariffs approved by the PUC (for investor-owned TDSPs), city governments (for municipally-owned utilities) or boards of directors (for electric cooperatives) PUBLIC 20
Retail Choice Customers Exposed to 4 CP • IDR-Metered customers (≥ 700 k. W in peak demand) in retail choice areas are billed for various T&D charges based on 4 CP – Includes all rates for transmission – Also may include distribution and other rates, depending on TDSP tariff and customer type • How it works: – Simple average of the customer’s metered load during the 4 CP intervals – Multiplied by the applicable prevailing TDSP tariff – Is the basis for the customer’s monthly 4 CP-based rates for the following calendar year PUBLIC 21
4 CP Charges as a DR Incentive • 4 CP was not created as an incentive for demand response, but… • Reducing load during these intervals yields considerable savings – NOIE DSPs can reduce their 4 CP Load Ratio Share, lowering their share of TCOS obligation – Retail choice loads on 4 CP tariffs can directly reduce charges on their bills for the following year • Many loads and NOIEs have developed or acquired 4 CP predictors • Entities then plan demand response around potential 4 CP intervals • An example of the incentive: $48, 075 per MW – Based on Transmission Cost Recovery Factor tariff for transmission-connected customer in the Oncor service territory – $4. 006269 TCRF (effective 9/1/18) x 1, 000 k. W x 12 months PUBLIC 22
4 CP Response: Risk/Reward • IDR-metered customers have wide variations in ability to curtail load, return to service times and lost opportunity costs – Each customer must weigh those factors against the potential for savings related to 4 CP demand response • In order to correctly anticipate all four 4 CP intervals, a customer would almost certainly need to shed load more than 4 times – Predicting 4 CP is not an exact science – requires a crystal ball for weather & load forecasts • But there are many ‘knowns’: – 4 CP days are always weekdays – Focus on hottest days (air conditioning drives system-wide load) PUBLIC 23
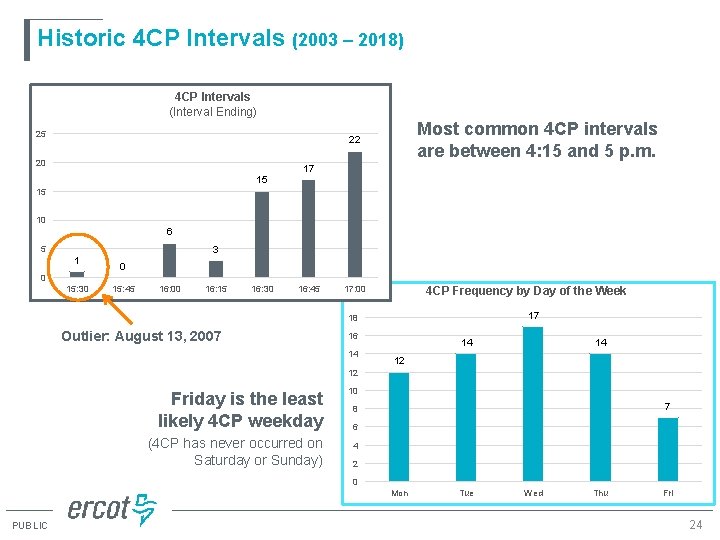
Historic 4 CP Intervals (2003 – 2018) 4 CP Intervals (Interval Ending) 25 Most common 4 CP intervals are between 4: 15 and 5 p. m. 22 20 15 17 15 10 6 3 5 1 0 0 15: 30 15: 45 16: 00 16: 15 16: 30 16: 45 17: 00 4 CP Frequency by Day of the Week 17 18 Outlier: August 13, 2007 16 14 14 14 12 12 Friday is the least likely 4 CP weekday (4 CP has never occurred on Saturday or Sunday) 10 7 8 6 4 2 0 Mon PUBLIC Tue Wed Thu Fri 24
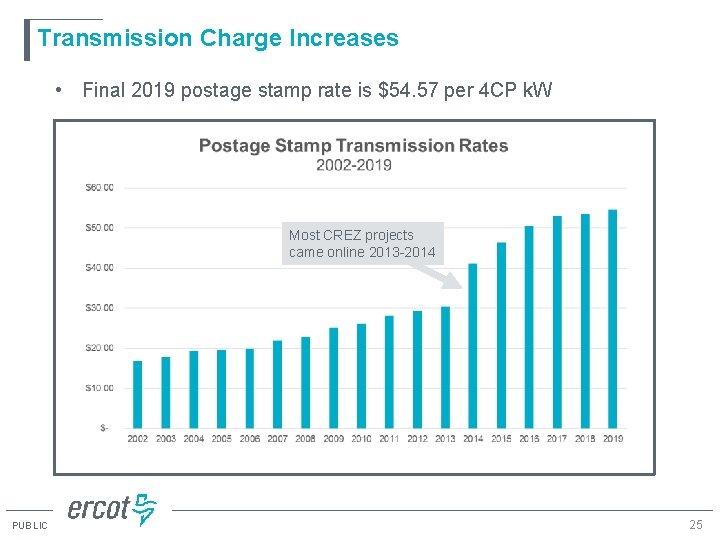
Transmission Charge Increases • Final 2019 postage stamp rate is $54. 57 per 4 CP k. W Most CREZ projects came online 2013 -2014 PUBLIC 25
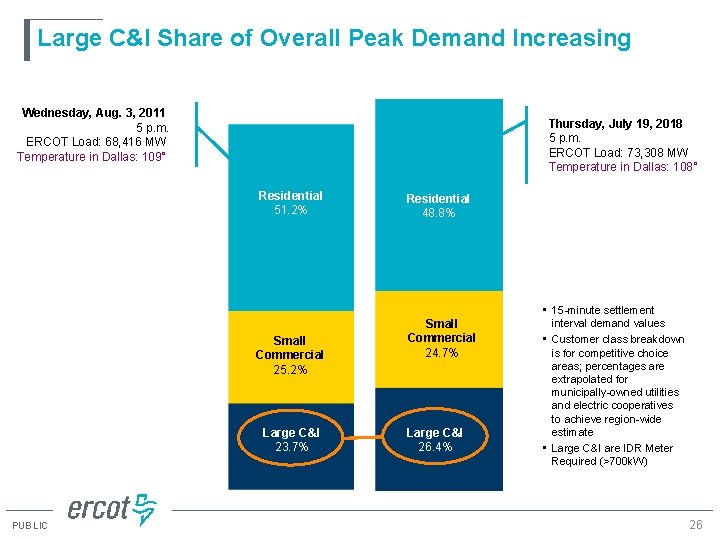
Large C&I Share of Overall Peak Demand Increasing Wednesday, Aug. 3, 2011 5 p. m. ERCOT Load: 68, 416 MW Temperature in Dallas: 109° Thursday, July 19, 2018 5 p. m. ERCOT Load: 73, 308 MW Temperature in Dallas: 108° Residential 51. 2% Small Commercial 25. 2% Large C&I 23. 7% PUBLIC Residential 48. 8% Small Commercial 24. 7% Large C&I 26. 4% • 15 -minute settlement interval demand values • Customer class breakdown is for competitive choice areas; percentages are extrapolated for municipally-owned utilities and electric cooperatives to achieve region-wide estimate • Large C&I are IDR Meter Required (>700 k. W) 26
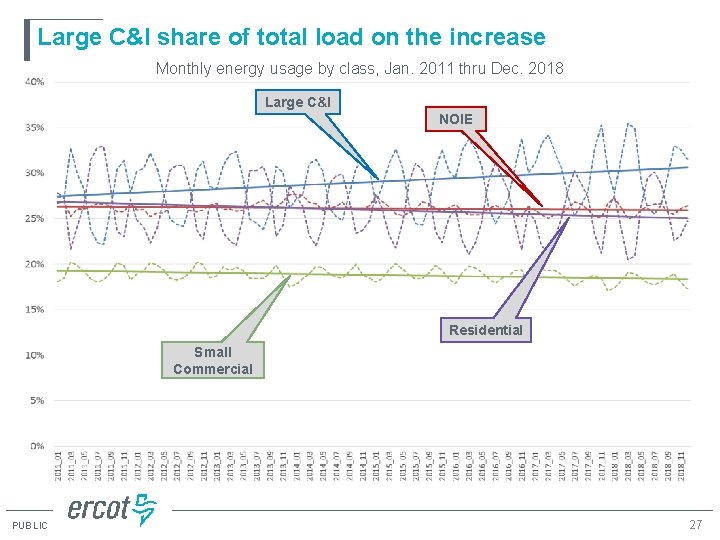
Large C&I share of total load on the increase Monthly energy usage by class, Jan. 2011 thru Dec. 2018 Large C&I NOIE Residential Small Commercial PUBLIC 27
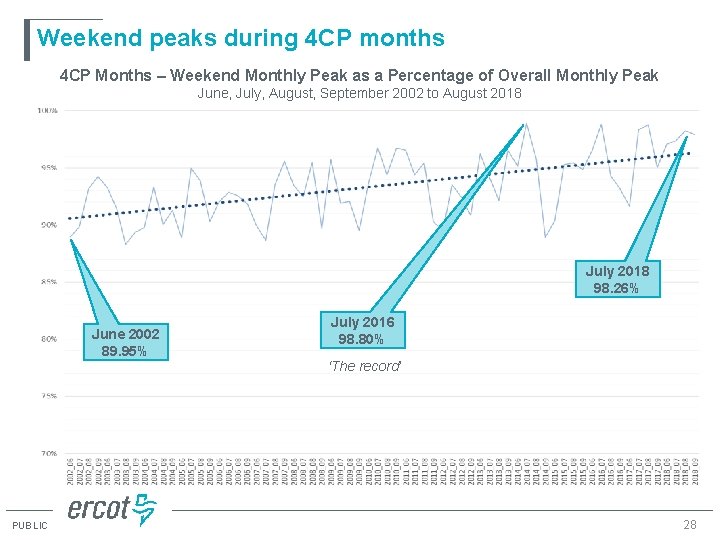
Weekend peaks during 4 CP months 4 CP Months – Weekend Monthly Peak as a Percentage of Overall Monthly Peak June, July, August, September 2002 to August 2018 July 2018 98. 26% June 2002 89. 95% PUBLIC July 2016 98. 80% ‘The record’ 28
Advanced Metering & Retail DR
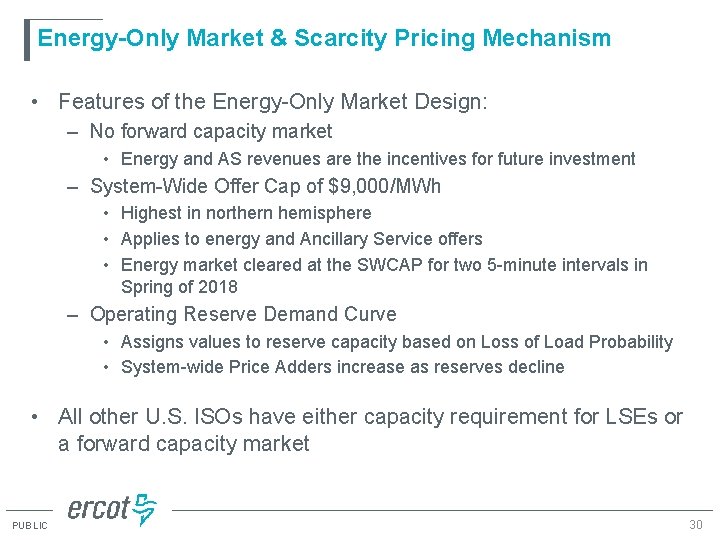
Energy-Only Market & Scarcity Pricing Mechanism • Features of the Energy-Only Market Design: – No forward capacity market • Energy and AS revenues are the incentives for future investment – System-Wide Offer Cap of $9, 000/MWh • Highest in northern hemisphere • Applies to energy and Ancillary Service offers • Energy market cleared at the SWCAP for two 5 -minute intervals in Spring of 2018 – Operating Reserve Demand Curve • Assigns values to reserve capacity based on Loss of Load Probability • System-wide Price Adders increase as reserves decline • All other U. S. ISOs have either capacity requirement for LSEs or a forward capacity market PUBLIC 30
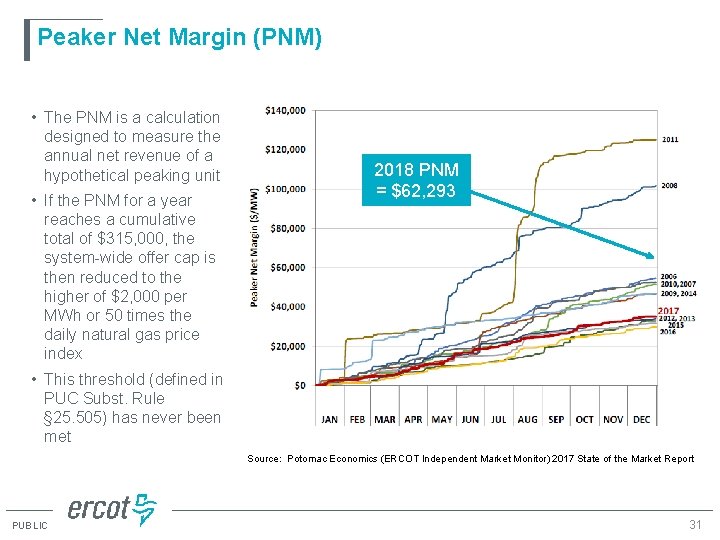
Peaker Net Margin (PNM) • The PNM is a calculation designed to measure the annual net revenue of a hypothetical peaking unit • If the PNM for a year reaches a cumulative total of $315, 000, the system-wide offer cap is then reduced to the higher of $2, 000 per MWh or 50 times the daily natural gas price index 2018 PNM = $62, 293 • This threshold (defined in PUC Subst. Rule § 25. 505) has never been met Source: Potomac Economics (ERCOT Independent Market Monitor) 2017 State of the Market Report PUBLIC 31
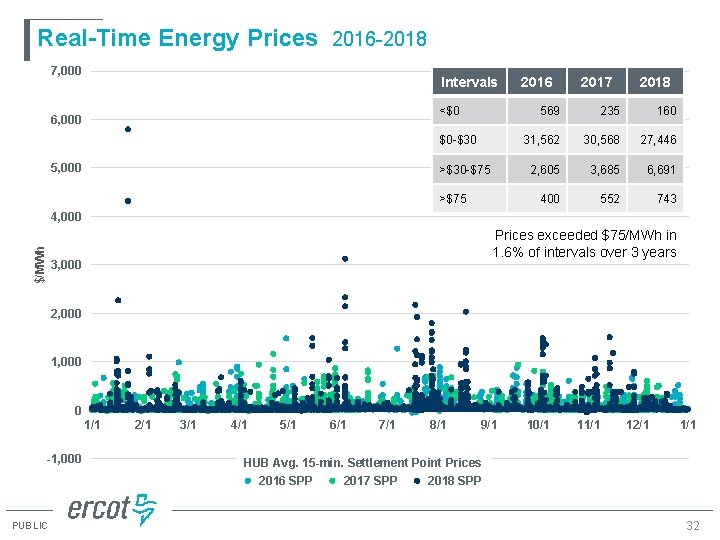
Real-Time Energy Prices 2016 -2018 7, 000 Intervals <$0 6, 000 $0 -$30 5, 000 >$30 -$75 >$75 2016 2017 2018 569 235 160 31, 562 30, 568 27, 446 2, 605 3, 685 6, 691 400 552 743 $/MWh 4, 000 Prices exceeded $75/MWh in 1. 6% of intervals over 3 years 3, 000 2, 000 1, 000 0 1/1 -1, 000 PUBLIC 2/1 3/1 4/1 5/1 6/1 7/1 8/1 9/1 10/1 11/1 12/1 1/1 HUB Avg. 15 -min. Settlement Point Prices 2016 SPP 2017 SPP 2018 SPP 32
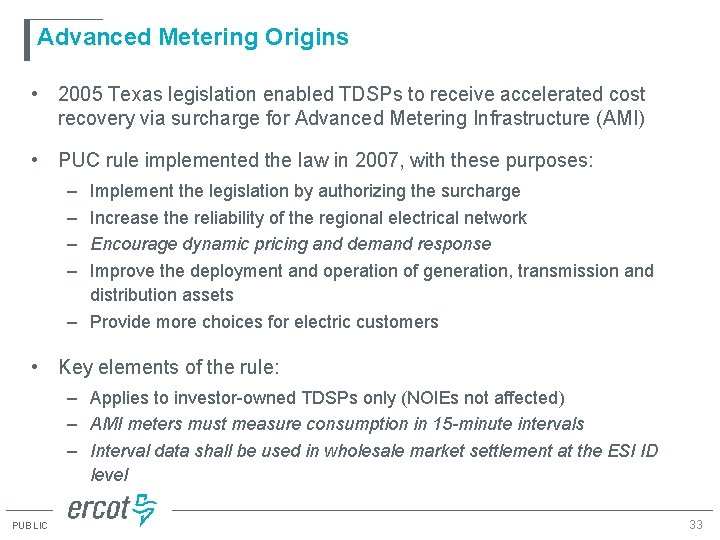
Advanced Metering Origins • 2005 Texas legislation enabled TDSPs to receive accelerated cost recovery via surcharge for Advanced Metering Infrastructure (AMI) • PUC rule implemented the law in 2007, with these purposes: – – Implement the legislation by authorizing the surcharge Increase the reliability of the regional electrical network Encourage dynamic pricing and demand response Improve the deployment and operation of generation, transmission and distribution assets – Provide more choices for electric customers • Key elements of the rule: – Applies to investor-owned TDSPs only (NOIEs not affected) – AMI meters must measure consumption in 15 -minute intervals – Interval data shall be used in wholesale market settlement at the ESI ID level PUBLIC 33
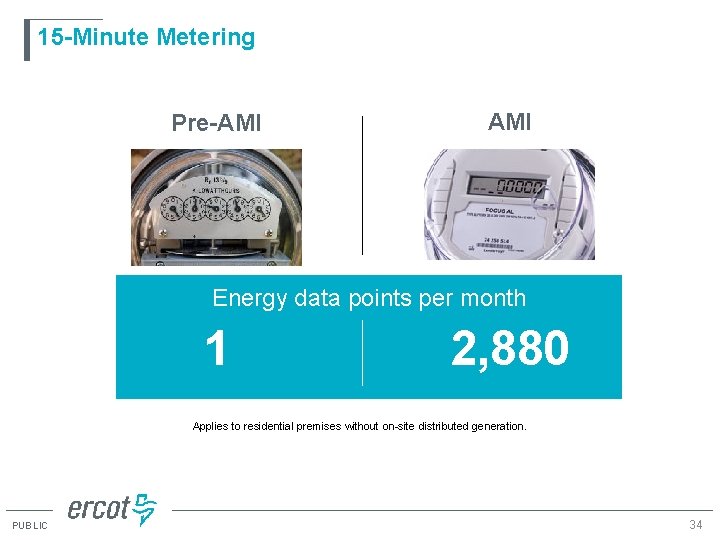
15 -Minute Metering Pre-AMI Energy data points per month 1 2, 880 Applies to residential premises without on-site distributed generation. PUBLIC 34
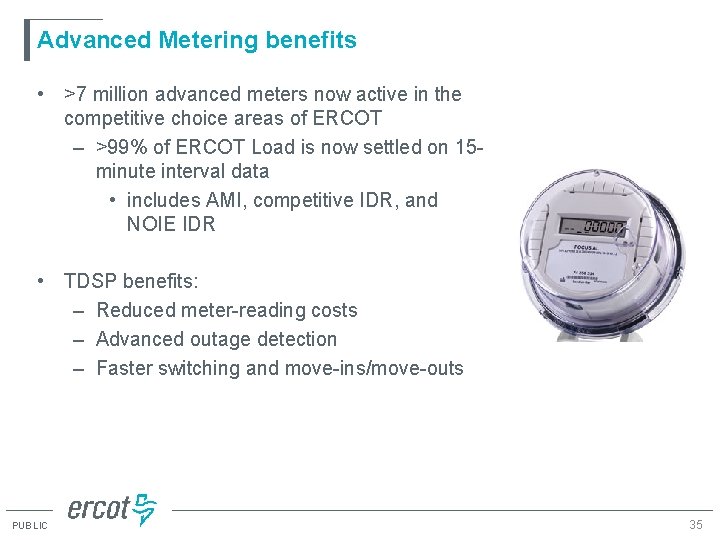
Advanced Metering benefits • >7 million advanced meters now active in the competitive choice areas of ERCOT – >99% of ERCOT Load is now settled on 15 minute interval data • includes AMI, competitive IDR, and NOIE IDR • TDSP benefits: – Reduced meter-reading costs – Advanced outage detection – Faster switching and move-ins/move-outs PUBLIC 35
Advanced Metering benefits • Retail Electric Provider (REP) benefits: – Settlement accuracy (no more load profiles; see next slide) – Real money if customers reduce load during high-priced periods • ISO benefits: – Settlement timeliness & accuracy • Customer benefits: – Access to granular energy usage data – A wider selection of REP products to choose from PUBLIC 36
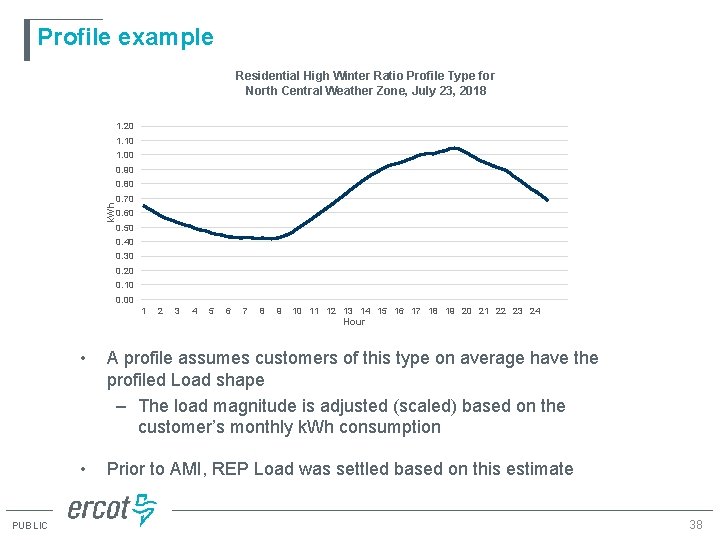
Why settlement is important • In settlement, LSE purchases are reconciled with generators’ sales • Prior to the AMI implementation, REP obligations for residential and small commercial customers were based on Load Profiles – Profiles are estimates of average individual usage, based on statistical samples of data from ‘like’ customers – A Profile for each customer type was created for each Operating Day, using weather & other inputs – Interval-level values were then assigned to each customer according to their Profile type, scaled based on monthly k. Wh usage PUBLIC 37
Profile example Residential High Winter Ratio Profile Type for North Central Weather Zone, July 23, 2018 1. 20 1. 10 1. 00 0. 90 k. Wh 0. 80 0. 70 0. 60 0. 50 0. 40 0. 30 0. 20 0. 10 0. 00 1 2 3 4 5 6 7 8 9 10 11 12 13 14 15 16 17 18 19 20 21 22 23 24 Hour PUBLIC • A profile assumes customers of this type on average have the profiled Load shape – The load magnitude is adjusted (scaled) based on the customer’s monthly k. Wh consumption • Prior to AMI, REP Load was settled based on this estimate 38
Why settlement is important • Settlement based on Load Profiles would be accurate at the REP aggregate load level only if its customers were not deviating from the profiled shapes – REP must accept the settlement outcome even if its customers were making significant changes to their load shapes • In other words… – Profiles are oblivious to intelligent load management – Profiles are hard barriers to price elasticity of demand – Profiles kill demand response PUBLIC 39
Why settlement is important • Settlement on actual 15 -minute data cures this problem – When customers are settled on their actual usage, the benefits of any action taken to reduce Load during a period of high wholesale prices will accrue directly to the LSE – This gives the LSE (in this case, the REP) an incentive proportional to real time prices to promote intelligent load management and demand response for its customers PUBLIC 40
Retail Price/Demand Response • If retail DR and price response penetration are a key metric in measuring the success of the ERCOT retail market and the AMI investment, how are we doing? PUC Subst. R. 25. 505 (e)(5) Load serving entities (LSEs) shall provide ERCOT with complete information on load response capabilities that are self-arranged or pursuant to bilateral agreements between LSEs and their customers. • Leveraging this rule language, ERCOT has worked with REPs since 2013 to collect data on various product offerings, including: – – – Time-of-Use Peak rebates Real-Time pricing Block & Index pricing Other load control products • REPs take snapshots of their customer base on Sept. 30 each year PUBLIC 41
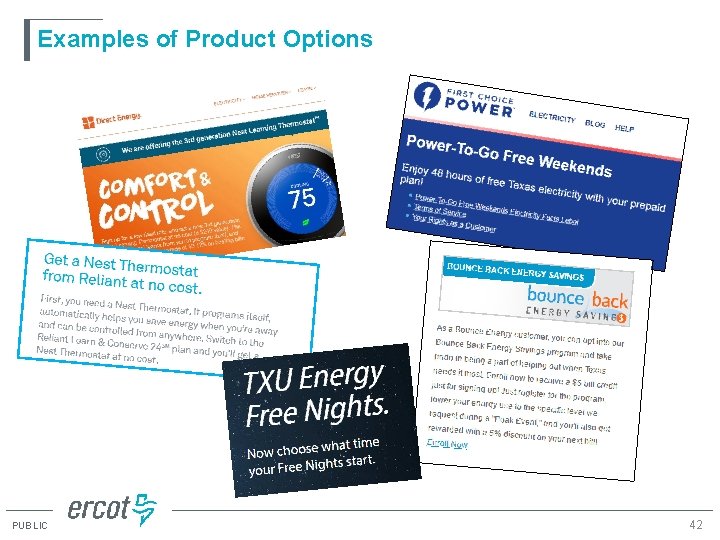
Examples of Product Options PUBLIC 42
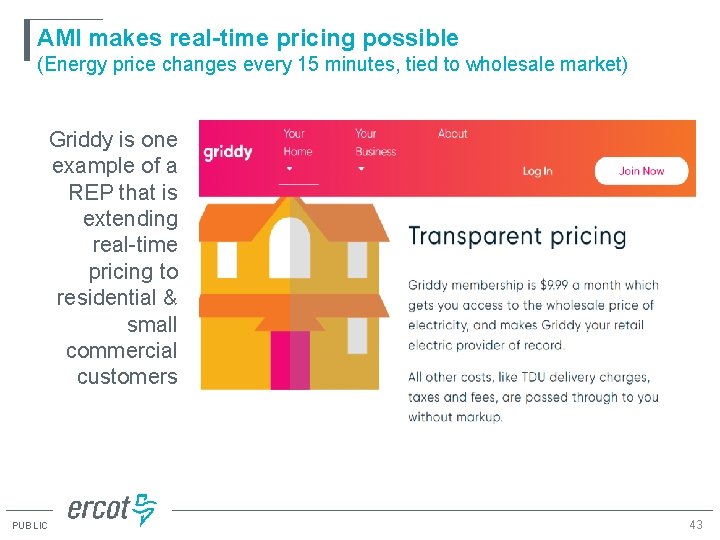
AMI makes real-time pricing possible (Energy price changes every 15 minutes, tied to wholesale market) Griddy is one example of a REP that is extending real-time pricing to residential & small commercial customers PUBLIC 43
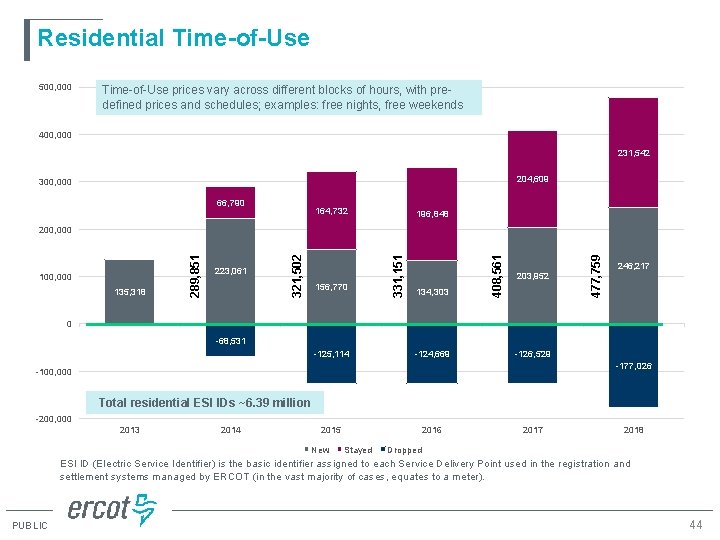
Residential Time-of-Use 500, 000 Time-of-Use prices vary across different blocks of hours, with predefined prices and schedules; examples: free nights, free weekends 400, 000 231, 542 204, 609 300, 000 66, 790 164, 732 196, 848 203, 952 477, 759 134, 303 408, 561 156, 770 331, 151 135, 318 223, 061 321, 502 100, 000 289, 851 200, 000 246, 217 0 -68, 531 -125, 114 -124, 669 -126, 529 -177, 026 -100, 000 Total residential ESI IDs ~6. 39 million -200, 000 2013 2014 2015 New 2016 Stayed 2017 2018 Dropped ESI ID (Electric Service Identifier) is the basic identifier assigned to each Service Delivery Point used in the registration and settlement systems managed by ERCOT (in the vast majority of cases, equates to a meter). PUBLIC 44
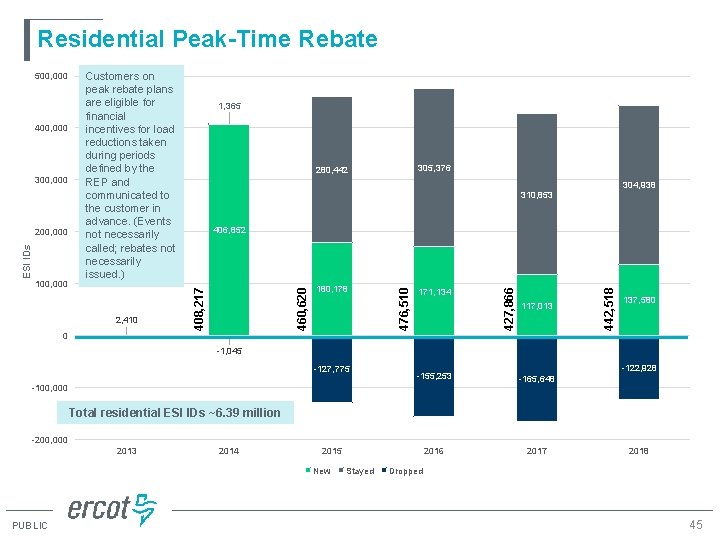
Residential Peak-Time Rebate 2, 410 406, 852 180, 178 171, 134 117, 013 442, 518 100, 000 304, 938 310, 853 427, 866 ESI IDs 200, 000 305, 376 280, 442 476, 510 300, 000 1, 365 460, 620 400, 000 Customers on peak rebate plans are eligible for financial incentives for load reductions taken during periods defined by the REP and communicated to the customer in advance. (Events not necessarily called; rebates not necessarily issued. ) 408, 217 500, 000 137, 580 0 -1, 045 -127, 775 -122, 928 -155, 253 -165, 648 2016 2017 -100, 000 Total residential ESI IDs ~6. 39 million -200, 000 2013 2014 2015 New PUBLIC Stayed 2018 Dropped 45
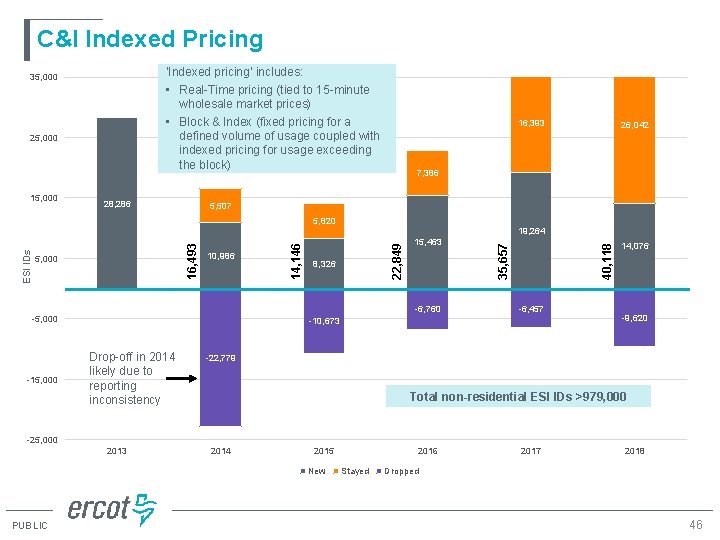
C&I Indexed Pricing ‘Indexed pricing’ includes: • Real-Time pricing (tied to 15 -minute wholesale market prices) • Block & Index (fixed pricing for a defined volume of usage coupled with indexed pricing for usage exceeding the block) 25, 000 15, 000 28, 286 16, 393 7, 386 5, 507 35, 657 8, 326 15, 463 -6, 760 -5, 000 -15, 000 19, 264 22, 849 10, 986 14, 146 16, 493 ESI IDs 5, 820 5, 000 -6, 457 -10, 673 Drop-off in 2014 likely due to reporting inconsistency 26, 042 40, 118 35, 000 14, 076 -9, 620 -22, 779 Total non-residential ESI IDs >979, 000 -25, 000 2013 2014 2015 New PUBLIC 2016 Stayed 2017 2018 Dropped 46
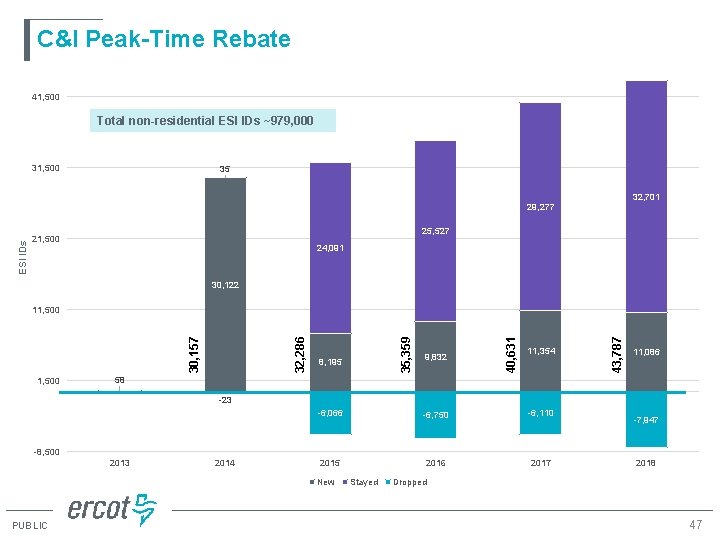
C&I Peak-Time Rebate 41, 500 Total non-residential ESI IDs ~979, 000 31, 500 35 32, 701 ESI IDs 29, 277 25, 527 21, 500 24, 091 30, 122 1, 500 9, 832 11, 354 43, 787 8, 195 40, 631 35, 359 30, 157 32, 286 11, 500 11, 086 58 -23 -6, 066 -6, 750 -6, 110 2015 2016 2017 -7, 947 -8, 500 2013 2014 New PUBLIC Stayed 2018 Dropped 47
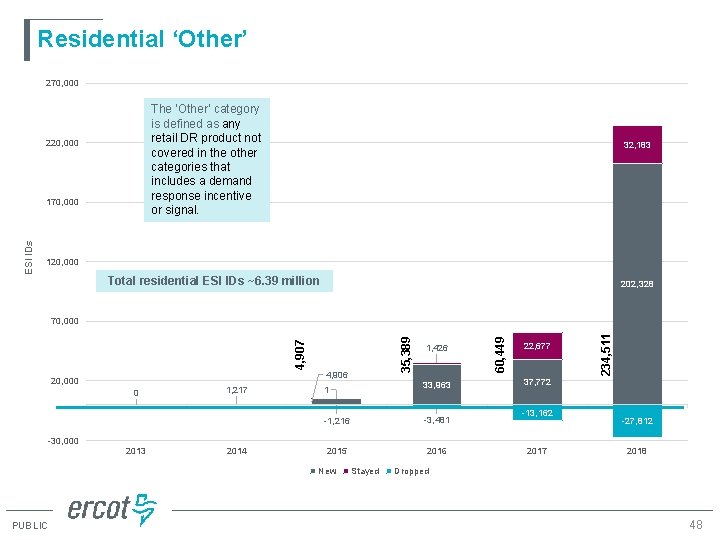
Residential ‘Other’ 270, 000 The ‘Other’ category is defined as any retail DR product not covered in the other categories that includes a demand response incentive or signal. 220, 000 ESI IDs 170, 000 32, 183 120, 000 Total residential ESI IDs ~6. 39 million 202, 328 0 1, 217 33, 963 1 -1, 216 -3, 481 2015 2016 22, 677 234, 511 4, 906 20, 000 1, 426 60, 449 4, 907 35, 389 70, 000 37, 772 -13, 162 -27, 812 -30, 000 2013 2014 New PUBLIC Stayed 2017 2018 Dropped 48
Summary: Impacts on System Load
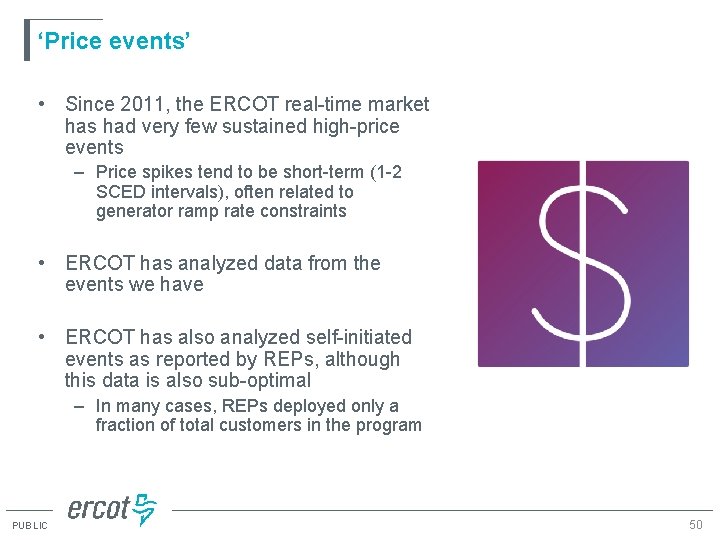
‘Price events’ • Since 2011, the ERCOT real-time market has had very few sustained high-price events – Price spikes tend to be short-term (1 -2 SCED intervals), often related to generator ramp rate constraints • ERCOT has analyzed data from the events we have • ERCOT has also analyzed self-initiated events as reported by REPs, although this data is also sub-optimal – In many cases, REPs deployed only a fraction of total customers in the program PUBLIC 50
4 CP and Price Response Effects • ERCOT has identified retail choice customers and NOIEs that are 4 CP- and/or price-responsive – >33, 000 total retail choice customers demonstrating 4 CP and/or price response • Includes >2, 000 retail choice customers on 4 CP tariffs – >20 NOIEs – Also includes registered distributed generation that exports to grid • ERCOT analyzed their behavior for 2017 • In recent years, 4 CP and near-CP intervals have not coincided with high prices – Pricing events defined as Load Zone prices ≥$200 for at least four consecutive settlement intervals (1 hour) in a Load Zone – Occurred on 25 days in 2017, but never on a 4 CP or near-CP day • Analysis provides an estimate of total response capability (see next slide) PUBLIC 51
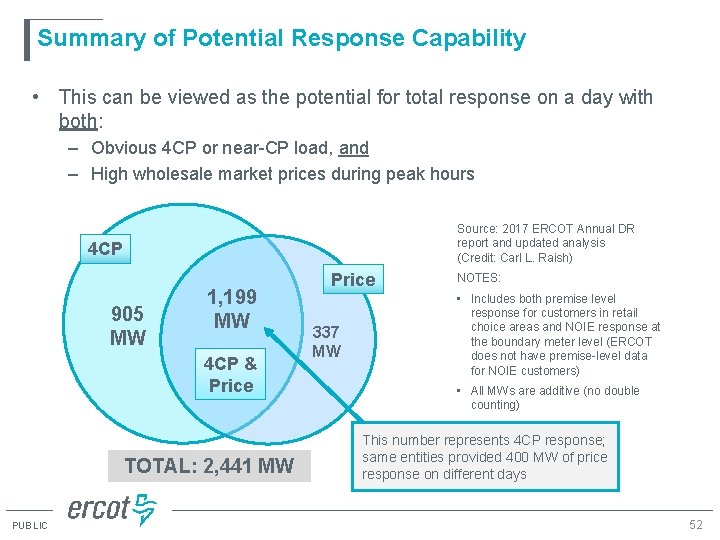
Summary of Potential Response Capability • This can be viewed as the potential for total response on a day with both: – Obvious 4 CP or near-CP load, and – High wholesale market prices during peak hours Source: 2017 ERCOT Annual DR report and updated analysis (Credit: Carl L. Raish) 4 CP 905 MW 1, 199 MW 4 CP & Price TOTAL: 2, 441 MW PUBLIC Price 337 MW NOTES: • Includes both premise level response for customers in retail choice areas and NOIE response at the boundary meter level (ERCOT does not have premise-level data for NOIE customers) • All MWs are additive (no double counting) This number represents 4 CP response; same entities provided 400 MW of price response on different days 52
Questions? paul. wattles@ercot. com 512. 248. 6578 PUBLIC 53
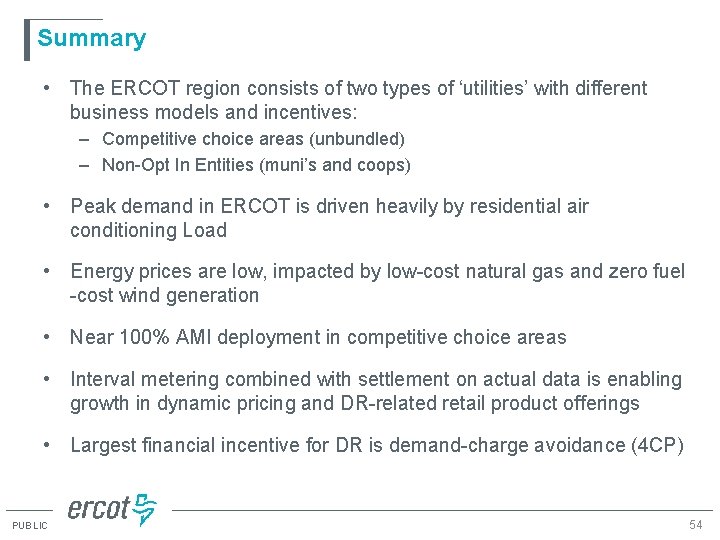
Summary • The ERCOT region consists of two types of ‘utilities’ with different business models and incentives: – Competitive choice areas (unbundled) – Non-Opt In Entities (muni’s and coops) • Peak demand in ERCOT is driven heavily by residential air conditioning Load • Energy prices are low, impacted by low-cost natural gas and zero fuel -cost wind generation • Near 100% AMI deployment in competitive choice areas • Interval metering combined with settlement on actual data is enabling growth in dynamic pricing and DR-related retail product offerings • Largest financial incentive for DR is demand-charge avoidance (4 CP) PUBLIC 54
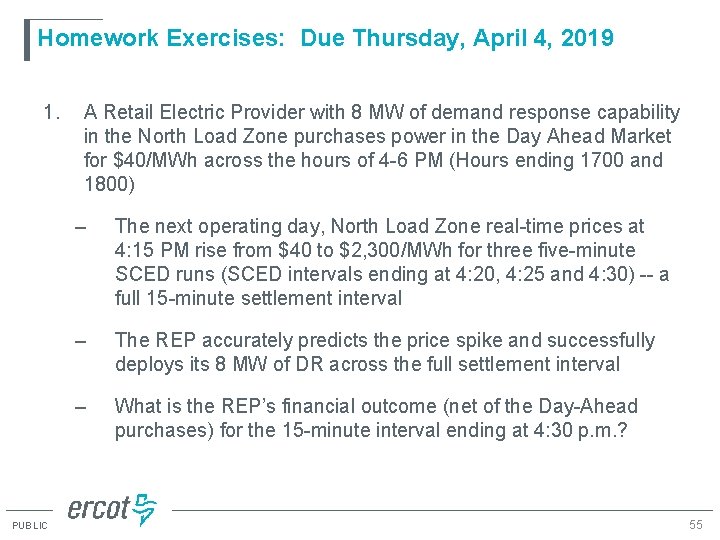
Homework Exercises: Due Thursday, April 4, 2019 1. PUBLIC A Retail Electric Provider with 8 MW of demand response capability in the North Load Zone purchases power in the Day Ahead Market for $40/MWh across the hours of 4 -6 PM (Hours ending 1700 and 1800) – The next operating day, North Load Zone real-time prices at 4: 15 PM rise from $40 to $2, 300/MWh for three five-minute SCED runs (SCED intervals ending at 4: 20, 4: 25 and 4: 30) -- a full 15 -minute settlement interval – The REP accurately predicts the price spike and successfully deploys its 8 MW of DR across the full settlement interval – What is the REP’s financial outcome (net of the Day-Ahead purchases) for the 15 -minute interval ending at 4: 30 p. m. ? 55
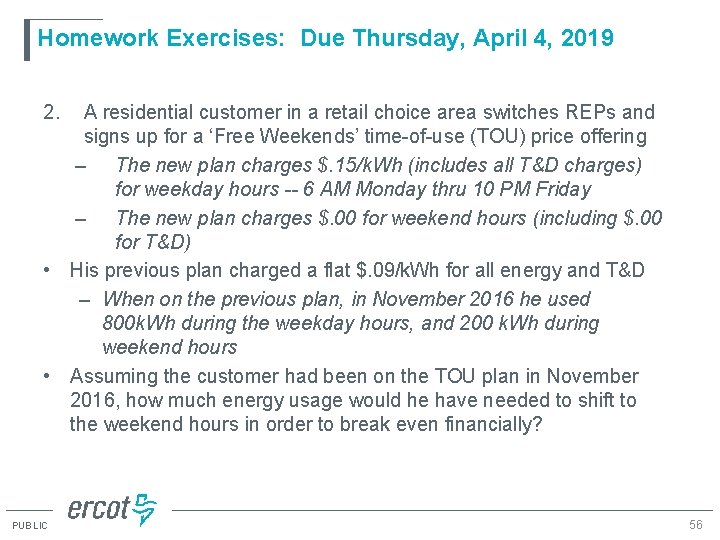
Homework Exercises: Due Thursday, April 4, 2019 2. A residential customer in a retail choice area switches REPs and signs up for a ‘Free Weekends’ time-of-use (TOU) price offering – The new plan charges $. 15/k. Wh (includes all T&D charges) for weekday hours -- 6 AM Monday thru 10 PM Friday – The new plan charges $. 00 for weekend hours (including $. 00 for T&D) • His previous plan charged a flat $. 09/k. Wh for all energy and T&D – When on the previous plan, in November 2016 he used 800 k. Wh during the weekday hours, and 200 k. Wh during weekend hours • Assuming the customer had been on the TOU plan in November 2016, how much energy usage would he have needed to shift to the weekend hours in order to break even financially? PUBLIC 56