
Education Inequality in Thailand Dilaka Lathapipat 29 June



- Slides: 26
Education Inequality in Thailand Dilaka Lathapipat 29 June 2018
Thailand has made considerable progress towards attaining universal primary education. Secondary enrolment has also improved markedly over the same period Adjusted Primary Net Enrolment Rates by Family Wealth Quartile Secondary Net Enrolment Rates by Family Wealth Quartile 1. 00 100% 0. 98 90% 0. 96 80% 0. 94 70% 0. 92 0. 90 0. 88 0. 86 0. 84 0. 82 Quartile 1 (Poorest) Quartile 2 Quartile 3 Quartile 4 (Richest) 0. 80 1986 1988 1990 1992 1994 1996 1998 2000 2002 2004 2006 2008 2010 2012 2014 60% 50% 40% 30% 20% 10% Quartile 1 (Poorest) Quartile 2 Quartile 3 Quartile 4 (Richest) 0% 1986 1988 1990 1992 1994 1996 1998 2000 2002 2004 2006 2008 2010 2012 2014 • Enrollment rate inequality between individuals from different household wealth quartiles (per capita expenditure) has declined considerably Source: World Bank Staff calculation using Thailand SES’s 2
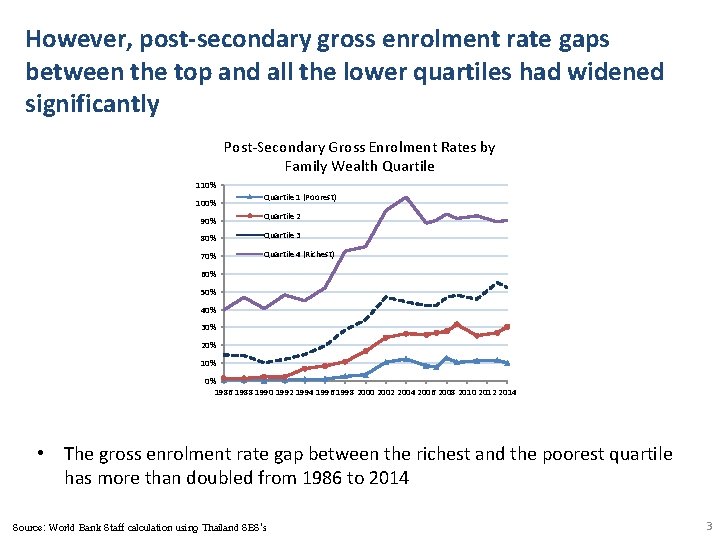
However, post-secondary gross enrolment rate gaps between the top and all the lower quartiles had widened significantly Post-Secondary Gross Enrolment Rates by Family Wealth Quartile 110% 100% 90% Quartile 1 (Poorest) Quartile 2 80% Quartile 3 70% Quartile 4 (Richest) 60% 50% 40% 30% 20% 10% 0% 1986 1988 1990 1992 1994 1996 1998 2000 2002 2004 2006 2008 2010 2012 2014 • The gross enrolment rate gap between the richest and the poorest quartile has more than doubled from 1986 to 2014 Source: World Bank Staff calculation using Thailand SES’s 3
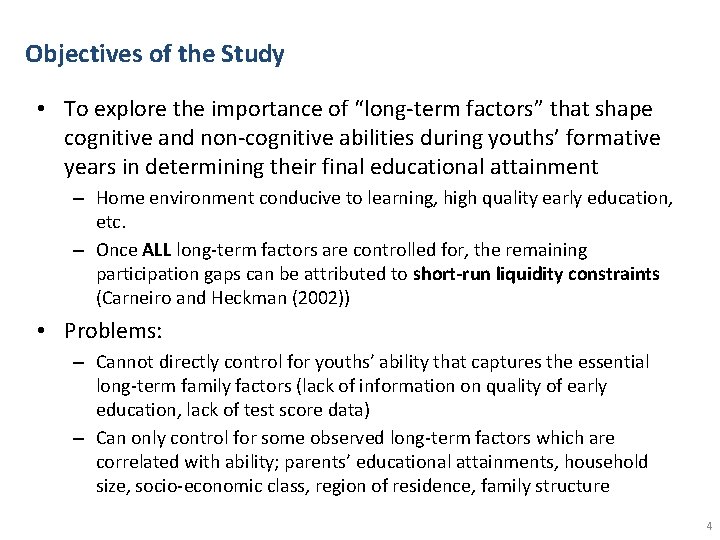
Objectives of the Study • To explore the importance of “long-term factors” that shape cognitive and non-cognitive abilities during youths’ formative years in determining their final educational attainment – Home environment conducive to learning, high quality early education, etc. – Once ALL long-term factors are controlled for, the remaining participation gaps can be attributed to short-run liquidity constraints (Carneiro and Heckman (2002)) • Problems: – Cannot directly control for youths’ ability that captures the essential long-term family factors (lack of information on quality of early education, lack of test score data) – Can only control for some observed long-term factors which are correlated with ability; parents’ educational attainments, household size, socio-economic class, region of residence, family structure 4
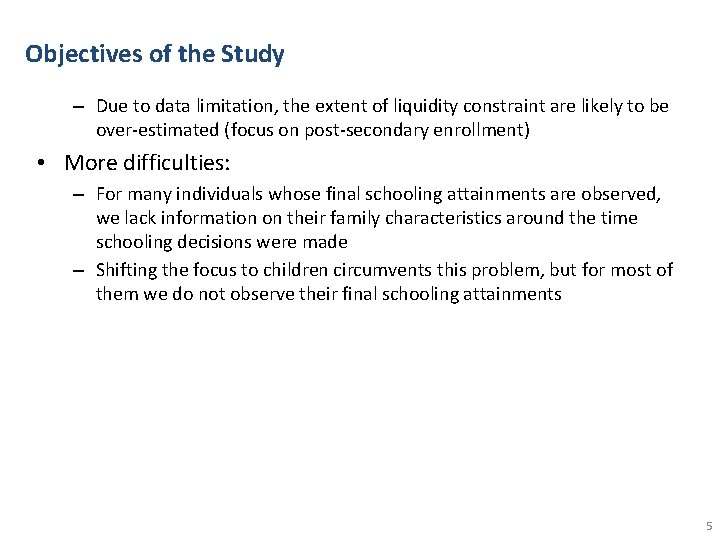
Objectives of the Study – Due to data limitation, the extent of liquidity constraint are likely to be over-estimated (focus on post-secondary enrollment) • More difficulties: – For many individuals whose final schooling attainments are observed, we lack information on their family characteristics around the time schooling decisions were made – Shifting the focus to children circumvents this problem, but for most of them we do not observe their final schooling attainments 5
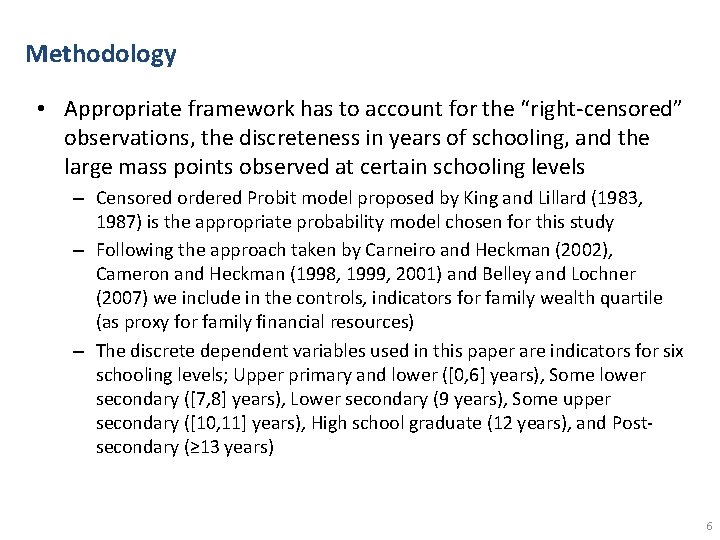
Methodology • Appropriate framework has to account for the “right-censored” observations, the discreteness in years of schooling, and the large mass points observed at certain schooling levels – Censored ordered Probit model proposed by King and Lillard (1983, 1987) is the appropriate probability model chosen for this study – Following the approach taken by Carneiro and Heckman (2002), Cameron and Heckman (1998, 1999, 2001) and Belley and Lochner (2007) we include in the controls, indicators for family wealth quartile (as proxy for family financial resources) – The discrete dependent variables used in this paper are indicators for six schooling levels; Upper primary and lower ([0, 6] years), Some lower secondary ([7, 8] years), Lower secondary (9 years), Some upper secondary ([10, 11] years), High school graduate (12 years), and Postsecondary (≥ 13 years) 6
Methodology – This specification enables straight forward comparison of school participation rates at various levels between youths from different wealth quartiles – It also facilitates direct testing of the importance of family wealth relative to other long-term family background and environmental characteristics that are thought to be important in shaping cognitive and non-cognitive abilities during the youths’ formative years • This study utilizes six waves of the Thai Household Socio. Economic Surveys to capture three different time periods (1996 and 1998, 2007 and 2009, and 2011 and 2013 – Two consecutive years of data are pooled together to increase the total number of observations – We focus on households of two-or-more generations whose members include individuals aged 16 to 24 who were either the children or grandchildren of the household heads 7
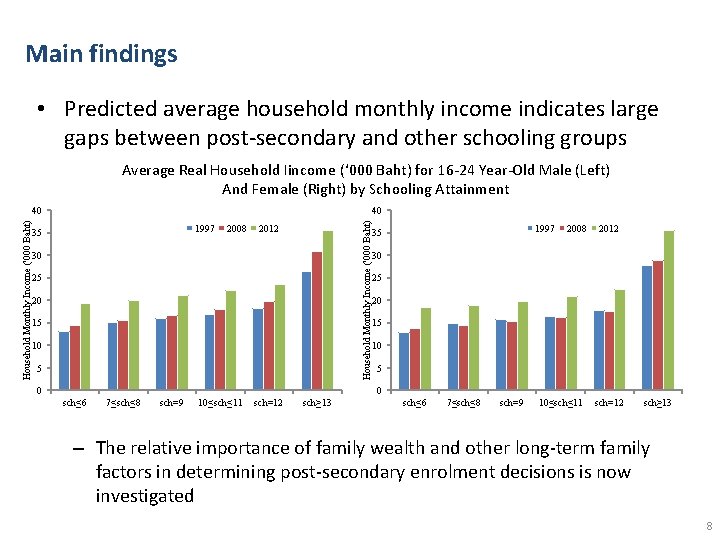
Main findings • Predicted average household monthly income indicates large gaps between post-secondary and other schooling groups Average Real Household Iincome (‘ 000 Baht) for 16 -24 Year-Old Male (Left) And Female (Right) by Schooling Attainment 40 1997 35 2008 Household Monthly Income ('000 Baht) 40 2012 30 25 20 15 10 5 1997 35 2008 2012 30 25 20 15 10 5 0 0 sch≤ 6 7≤sch≤ 8 sch=9 10≤sch≤ 11 sch=12 sch≥ 13 – The relative importance of family wealth and other long-term family factors in determining post-secondary enrolment decisions is now investigated 8
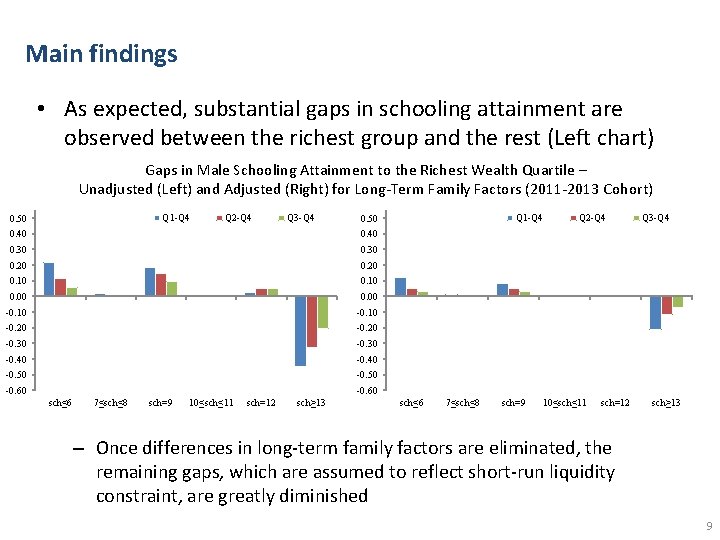
Main findings • As expected, substantial gaps in schooling attainment are observed between the richest group and the rest (Left chart) Gaps in Male Schooling Attainment to the Richest Wealth Quartile – Unadjusted (Left) and Adjusted (Right) for Long-Term Family Factors (2011 -2013 Cohort) Q 1 -Q 4 0. 50 Q 2 -Q 4 Q 3 -Q 4 0. 40 0. 30 0. 20 0. 10 0. 00 -0. 10 -0. 20 -0. 30 -0. 40 -0. 50 -0. 60 Q 1 -Q 4 0. 50 Q 2 -Q 4 Q 3 -Q 4 -0. 60 sch≤ 6 7≤sch≤ 8 sch=9 10≤sch≤ 11 sch=12 sch≥ 13 – Once differences in long-term family factors are eliminated, the remaining gaps, which are assumed to reflect short-run liquidity constraint, are greatly diminished 9
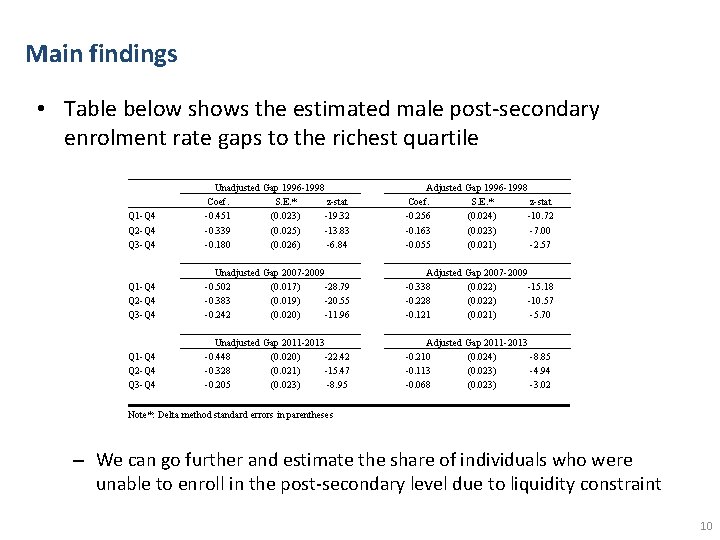
Main findings • Table below shows the estimated male post-secondary enrolment rate gaps to the richest quartile Unadjusted Gap 1996 -1998 Coef. S. E. * z-stat Q 1 -Q 4 -0. 451 (0. 023) -19. 32 Q 2 -Q 4 -0. 339 (0. 025) -13. 83 Q 3 -Q 4 -0. 180 (0. 026) -6. 84 Unadjusted Gap 2007 -2009 Q 1 -Q 4 -0. 502 (0. 017) -28. 79 Q 2 -Q 4 -0. 383 (0. 019) -20. 55 Q 3 -Q 4 -0. 242 (0. 020) -11. 96 Unadjusted Gap 2011 -2013 Q 1 -Q 4 -0. 448 (0. 020) -22. 42 Q 2 -Q 4 -0. 328 (0. 021) -15. 47 Q 3 -Q 4 -0. 205 (0. 023) -8. 95 Note*: Delta method standard errors in parentheses Adjusted Gap 1996 -1998 Coef. S. E. * z-stat -0. 256 (0. 024) -10. 72 -0. 163 (0. 023) -7. 00 -0. 055 (0. 021) -2. 57 Adjusted Gap 2007 -2009 -0. 338 (0. 022) -15. 18 -0. 228 (0. 022) -10. 57 -0. 121 (0. 021) -5. 70 Adjusted Gap 2011 -2013 -0. 210 (0. 024) -8. 85 -0. 113 (0. 023) -4. 94 -0. 068 (0. 023) -3. 02 – We can go further and estimate the share of individuals who were unable to enroll in the post-secondary level due to liquidity constraint 10
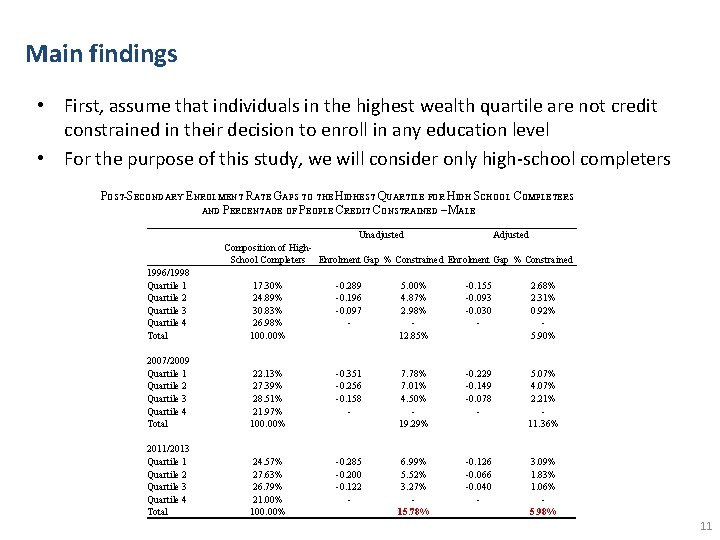
Main findings • First, assume that individuals in the highest wealth quartile are not credit constrained in their decision to enroll in any education level • For the purpose of this study, we will consider only high-school completers POST-SECONDARY ENROLMENT RATE GAPS TO THE HIGHEST QUARTILE FOR HIGH SCHOOL COMPLETERS AND PERCENTAGE OF PEOPLE CREDIT CONSTRAINED – MALE 1996/1998 Quartile 1 Quartile 2 Quartile 3 Quartile 4 Total Unadjusted Adjusted Composition of High. School Completers Enrolment Gap % Constrained 17. 30% 24. 89% 30. 83% 26. 98% 100. 00% -0. 289 -0. 196 -0. 097 - 5. 00% 4. 87% 2. 98% 12. 85% -0. 155 -0. 093 -0. 030 - 2. 68% 2. 31% 0. 92% 5. 90% 2007/2009 Quartile 1 Quartile 2 Quartile 3 Quartile 4 Total 22. 13% 27. 39% 28. 51% 21. 97% 100. 00% -0. 351 -0. 256 -0. 158 - 7. 78% 7. 01% 4. 50% 19. 29% -0. 229 -0. 149 -0. 078 - 5. 07% 4. 07% 2. 21% 11. 36% 2011/2013 Quartile 1 Quartile 2 Quartile 3 Quartile 4 Total 24. 57% 27. 63% 26. 79% 21. 00% 100. 00% -0. 285 -0. 200 -0. 122 - 6. 99% 5. 52% 3. 27% 15. 78% -0. 126 -0. 066 -0. 040 - 3. 09% 1. 83% 1. 06% 5. 98% 11
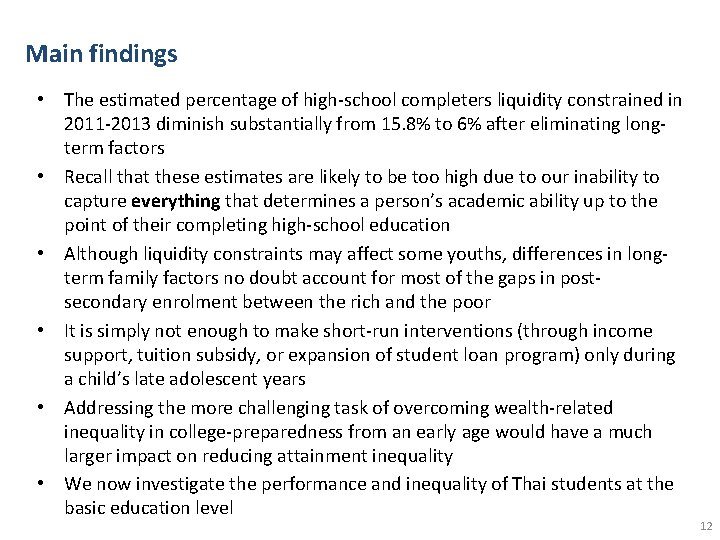
Main findings • The estimated percentage of high-school completers liquidity constrained in 2011 -2013 diminish substantially from 15. 8% to 6% after eliminating longterm factors • Recall that these estimates are likely to be too high due to our inability to capture everything that determines a person’s academic ability up to the point of their completing high-school education • Although liquidity constraints may affect some youths, differences in longterm family factors no doubt account for most of the gaps in postsecondary enrolment between the rich and the poor • It is simply not enough to make short-run interventions (through income support, tuition subsidy, or expansion of student loan program) only during a child’s late adolescent years • Addressing the more challenging task of overcoming wealth-related inequality in college-preparedness from an early age would have a much larger impact on reducing attainment inequality • We now investigate the performance and inequality of Thai students at the basic education level 12
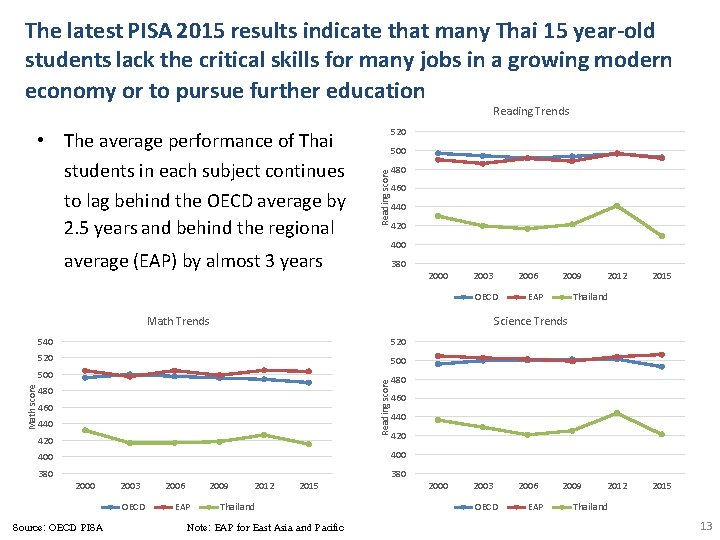
The latest PISA 2015 results indicate that many Thai 15 year-old students lack the critical skills for many jobs in a growing modern economy or to pursue further education Reading Trends 520 500 Reading score • The average performance of Thai students in each subject continues to lag behind the OECD average by 2. 5 years and behind the regional 480 460 440 420 400 average (EAP) by almost 3 years 380 2003 2006 OECD EAP 2012 2015 Thailand Science Trends 540 520 500 480 Reading score Math Trends 2009 480 460 440 420 400 380 2003 OECD Source: OECD PISA 2006 2009 EAP 2012 2015 Thailand Note: EAP for East Asia and Pacific 2000 2003 OECD 2006 EAP 2009 2012 2015 Thailand 13
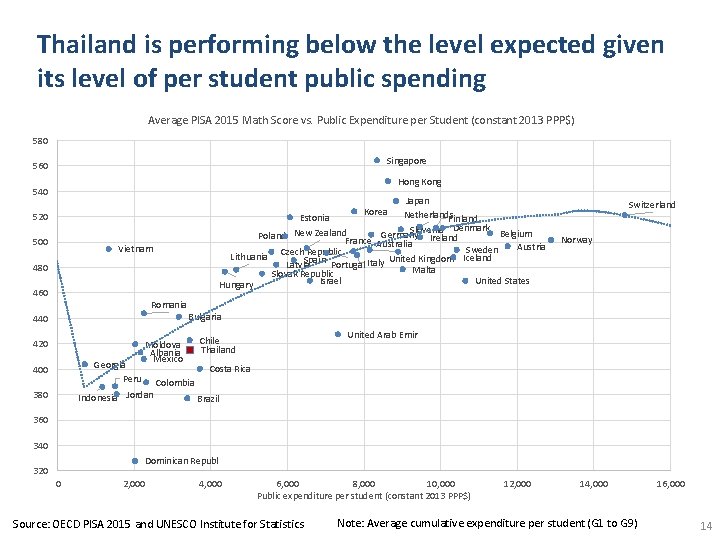
Thailand is performing below the level expected given its level of per student public spending Singapore Hong Kong Japan Netherlands Estonia Finland Denmark Slovenia Belgium Germany Ireland Poland New Zealand France Australia Austria Sweden Lithuania Czech Republic Iceland United Kingdom Spain Latvia Portugal Italy Malta Slovak Republic Israel United States Hungary Switzerland Korea Vietnam Romania Georgia Peru Bulgaria Moldova Albania Mexico Indonesia Jordan Norway Chile Thailand United Arab Emir Costa Rica Colombia Brazil Dominican Republ Public expenditure per student (constant 2013 PPP$) 14
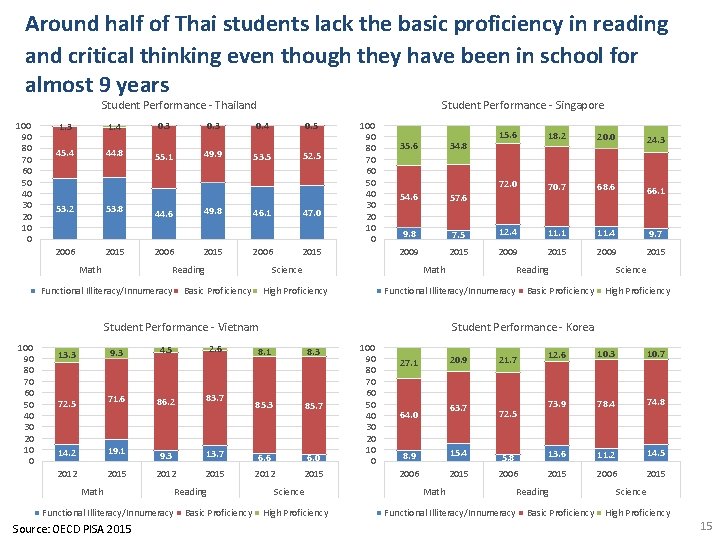
Around half of Thai students lack the basic proficiency in reading and critical thinking even though they have been in school for almost 9 years Student Performance - Thailand 100 90 80 70 60 50 40 30 20 10 0 1. 3 1. 4 44. 8 45. 4 53. 8 53. 2 2006 2015 0. 3 49. 9 55. 1 49. 8 44. 6 2006 Math 2015 Student Performance - Singapore 0. 4 0. 5 52. 5 53. 5 47. 0 46. 1 2006 Reading 100 90 80 70 60 50 40 30 20 10 0 2015 34. 8 35. 6 2. 6 9. 3 4. 5 72. 5 71. 6 86. 2 14. 2 19. 1 2012 2015 8. 1 8. 3 85. 7 6. 6 6. 0 2012 2015 Functional Illiteracy/Innumeracy Basic Proficiency 72. 0 70. 7 68. 6 66. 1 9. 8 7. 5 12. 4 11. 1 11. 4 9. 7 2009 2015 Reading Functional Illiteracy/Innumeracy Basic Proficiency Science High Proficiency Student Performance - Korea 13. 7 Reading 24. 3 Math 9. 3 Math Source: OECD PISA 2015 83. 7 20. 0 57. 6 Student Performance - Vietnam 13. 3 18. 2 54. 6 Science Functional Illiteracy/Innumeracy Basic Proficiency High Proficiency 100 90 80 70 60 50 40 30 20 10 0 15. 6 Science High Proficiency 100 90 80 70 60 50 40 30 20 10 0 20. 9 27. 1 63. 7 64. 0 8. 9 15. 4 2006 2015 12. 6 10. 3 10. 7 73. 9 78. 4 74. 8 5. 8 13. 6 11. 2 14. 5 2006 2015 21. 7 72. 5 Math Functional Illiteracy/Innumeracy Reading Basic Proficiency Science High Proficiency 15
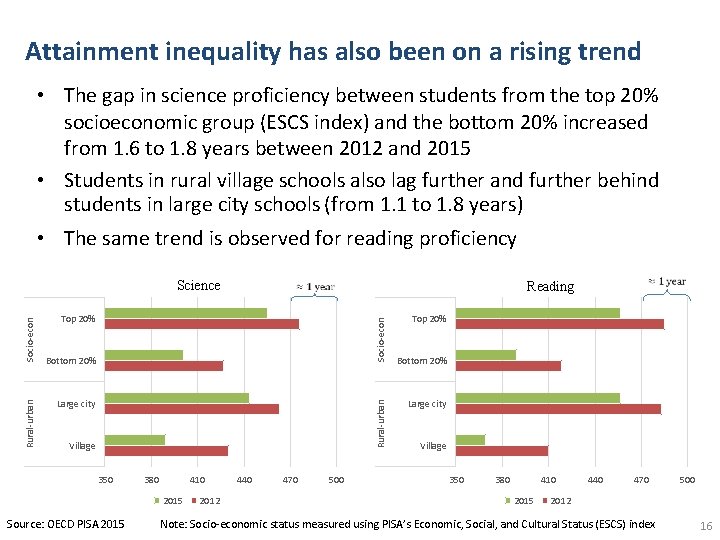
Attainment inequality has also been on a rising trend • The gap in science proficiency between students from the top 20% socioeconomic group (ESCS index) and the bottom 20% increased from 1. 6 to 1. 8 years between 2012 and 2015 • Students in rural village schools also lag further and further behind students in large city schools (from 1. 1 to 1. 8 years) • The same trend is observed for reading proficiency Socio-econ Top 20% Bottom 20% Large city Village 350 380 410 2015 Source: OECD PISA 2015 2012 440 470 Reading Rural-urban Socio-econ Science 500 Top 20% Bottom 20% Large city Village 350 380 410 2015 440 470 500 2012 Note: Socio-economic status measured using PISA’s Economic, Social, and Cultural Status (ESCS) index 16
Key question: What are the reasons behind the continued poor average student performance and the high and rising attainment inequality?
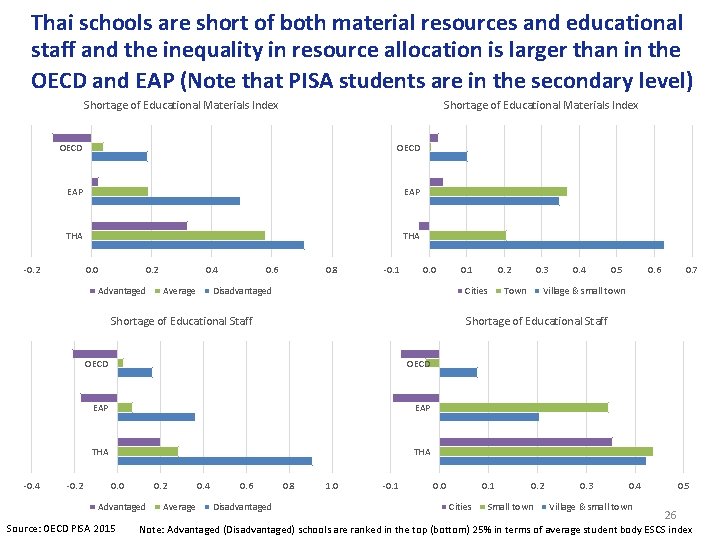
Thai schools are short of both material resources and educational staff and the inequality in resource allocation is larger than in the OECD and EAP (Note that PISA students are in the secondary level) Shortage of Educational Materials Index OECD EAP THA -0. 2 0. 0 0. 2 Advantaged 0. 4 Average 0. 6 0. 8 -0. 1 0. 0 Disadvantaged -0. 2 OECD EAP THA 0. 2 Advantaged Source: OECD PISA 2015 Average 0. 4 0. 6 Disadvantaged 0. 3 Town 0. 4 0. 5 0. 6 0. 7 Village & small town Shortage of Educational Staff OECD 0. 0 0. 2 Cities Shortage of Educational Staff -0. 4 0. 1 0. 8 1. 0 -0. 1 0. 0 0. 1 Cities 0. 2 Small town 0. 3 0. 4 Village & small town 0. 5 26 Note: Advantaged (Disadvantaged) schools are ranked in the top (bottom) 25% in terms of average student body ESCS index
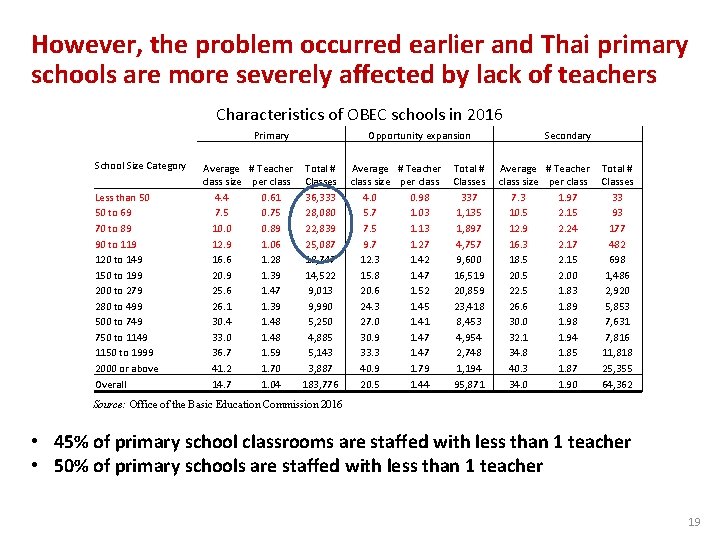
However, the problem occurred earlier and Thai primary schools are more severely affected by lack of teachers Characteristics of OBEC schools in 2016 School Size Category Less than 50 50 to 69 70 to 89 90 to 119 120 to 149 150 to 199 200 to 279 280 to 499 500 to 749 750 to 1149 1150 to 1999 2000 or above Overall Primary Opportunity expansion Secondary Average # Teacher Total # class size per class Classes 4. 4 0. 61 36, 333 7. 5 0. 75 28, 080 10. 0 0. 89 22, 839 12. 9 1. 06 25, 087 16. 6 1. 28 18, 747 20. 9 1. 39 14, 522 25. 6 1. 47 9, 013 26. 1 1. 39 9, 990 30. 4 1. 48 5, 250 33. 0 1. 48 4, 885 36. 7 1. 59 5, 143 41. 2 1. 70 3, 887 14. 7 1. 04 183, 776 Average # Teacher Total # class size per class Classes 4. 0 0. 98 337 5. 7 1. 03 1, 135 7. 5 1. 13 1, 897 9. 7 1. 27 4, 757 12. 3 1. 42 9, 600 15. 8 1. 47 16, 519 20. 6 1. 52 20, 859 24. 3 1. 45 23, 418 27. 0 1. 41 8, 453 30. 9 1. 47 4, 954 33. 3 1. 47 2, 748 40. 9 1. 79 1, 194 20. 5 1. 44 95, 871 Average # Teacher Total # class size per class Classes 7. 3 1. 97 33 10. 5 2. 15 93 12. 9 2. 24 177 16. 3 2. 17 482 18. 5 2. 15 698 20. 5 2. 00 1, 486 22. 5 1. 83 2, 920 26. 6 1. 89 5, 853 30. 0 1. 98 7, 631 32. 1 1. 94 7, 816 34. 8 1. 85 11, 818 40. 3 1. 87 25, 355 34. 0 1. 90 64, 362 Source: Office of the Basic Education Commission 2016 • 45% of primary school classrooms are staffed with less than 1 teacher • 50% of primary schools are staffed with less than 1 teacher 19
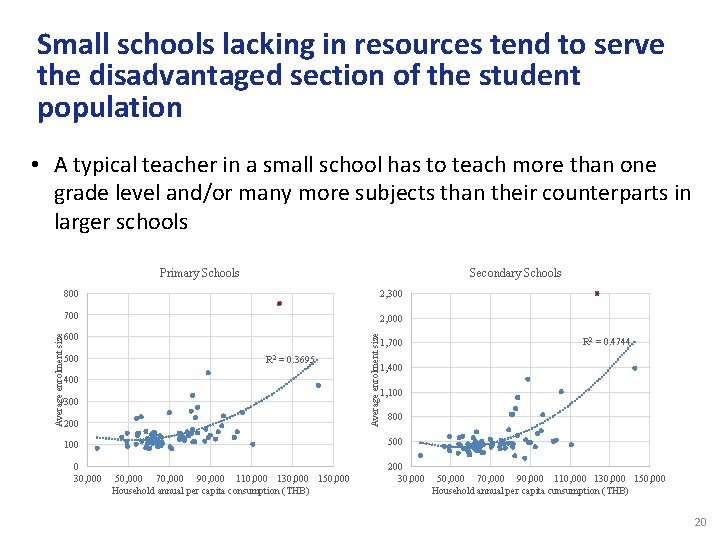
Small schools lacking in resources tend to serve the disadvantaged section of the student population • A typical teacher in a small school has to teach more than one grade level and/or many more subjects than their counterparts in larger schools Secondary Schools 800 2, 300 700 2, 000 600 500 R 2 = 0. 3695 400 300 200 1, 700 R 2 = 0. 4744 1, 400 1, 100 800 500 100 0 30, 000 Average enrolment size Primary Schools 50, 000 70, 000 90, 000 110, 000 130, 000 150, 000 Household annual per capita consumption (THB) 200 30, 000 50, 000 70, 000 90, 000 110, 000 130, 000 150, 000 Household annual per capita cunsumption (THB) 20
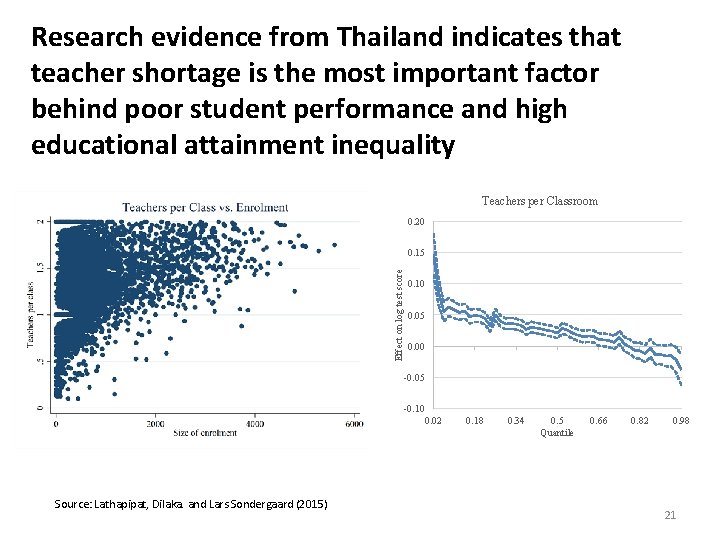
Research evidence from Thailand indicates that teacher shortage is the most important factor behind poor student performance and high educational attainment inequality Teachers per Classroom 0. 20 Effect on log test score 0. 15 0. 10 0. 05 Low scores High scores 0. 00 -0. 05 -0. 10 0. 02 Source: Lathapipat, Dilaka. and Lars Sondergaard (2015) 0. 18 0. 34 0. 5 Quantile 0. 66 0. 82 0. 98 21
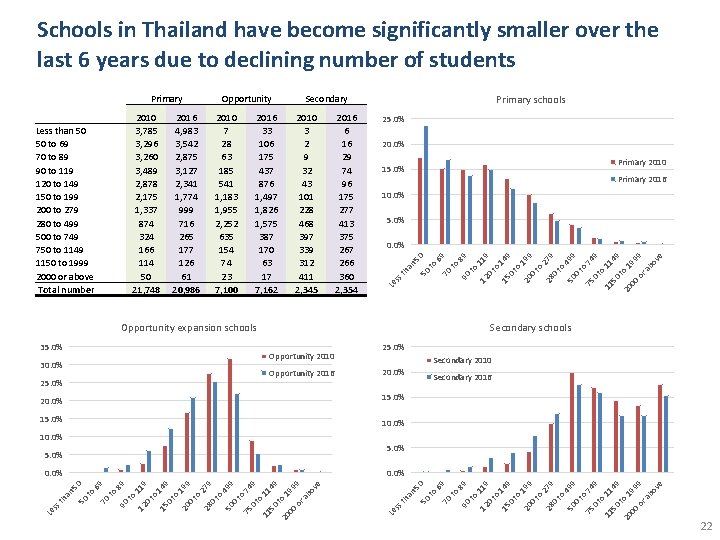
Schools in Thailand have become significantly smaller over the last 6 years due to declining number of students 25. 0% 20. 0% Primary 2010 15. 0% Primary 2016 10. 0% 5. 0% Opportunity expansion schools 35. 0% Opportunity 2016 25. 0% 7 0 49 to 11 11 49 50 20 to 1 9 00 o 99 r a bo ve to 75 0 50 28 0 to 4 99 79 2 to 20 0 1 99 9 to Secondary 2010 20. 0% 15. 0% 10. 0% Secondary 2016 5. 0% 7 0 49 to 11 11 49 50 20 to 1 9 00 o 99 r a bo ve to 75 0 50 to 4 99 79 2 28 0 to 0 20 15 0 to 1 99 9 1 4 19 to 12 0 1 9 8 to 90 to 9 6 70 50 to 0 5 an th ss 75 Le 7 0 49 to 11 11 4 50 to 9 20 00 199 9 o r a bo ve 99 to 4 50 0 to 0 28 20 0 to 2 79 99 1 49 to 1 15 0 19 to 12 0 1 9 8 to 90 to 6 70 to 5 50 an th 9 0. 0% 0 0. 0% ss 0 25. 0% 20. 0% Le 15 Secondary schools Opportunity 2010 30. 0% 1 4 19 12 0 to 9 1 to 90 70 to 8 6 9 0. 0% 0 2016 6 16 29 74 96 175 277 413 375 267 266 360 2, 354 to 2010 3 2 9 32 43 101 228 468 397 339 312 411 2, 345 5 2016 33 106 175 437 876 1, 497 1, 826 1, 575 387 170 63 17 7, 162 50 2010 7 28 63 185 541 1, 183 1, 955 2, 252 635 154 74 23 7, 100 an 2016 4, 983 3, 542 2, 875 3, 127 2, 341 1, 774 999 716 265 177 126 61 20, 986 th 2010 3, 785 3, 296 3, 260 3, 489 2, 878 2, 175 1, 337 874 324 166 114 50 21, 748 Primary schools Secondary ss Less than 50 50 to 69 70 to 89 90 to 119 120 to 149 150 to 199 200 to 279 280 to 499 500 to 749 750 to 1149 1150 to 1999 2000 or above Total number Opportunity Le Primary 22
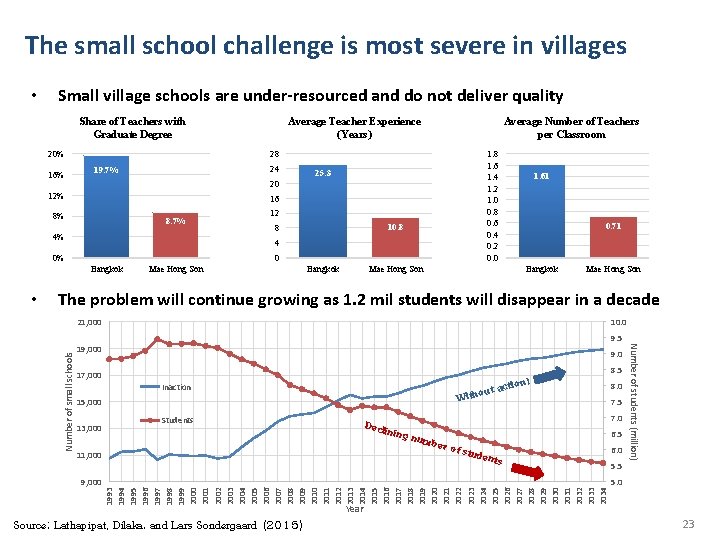
The small school challenge is most severe in villages • Small village schools are under-resourced and do not deliver quality Share of Teachers with Graduate Degree 20% 16% Average Number of Teachers per Classroom 28 24 19. 7% 1. 8 1. 6 1. 4 1. 2 1. 0 0. 8 0. 6 0. 4 0. 2 0. 0 25. 3 20 12% 16 8% 8. 7% 4% 12 10. 8 8 4 0% 0 Bangkok • Average Teacher Experience (Years) Mae Hong Son Bangkok Mae Hong Son 1. 61 0. 71 Bangkok Mae Hong Son The problem will continue growing as 1. 2 mil students will disappear in a decade 10. 0 9. 5 19, 000 9. 0 17, 000 ! t action u o h t i W Inaction 15, 000 13, 000 Students ber of 7. 5 6. 5 studen ts 1993 1994 1995 1996 1997 1998 1999 2000 2001 2002 2003 2004 2005 2006 2007 2008 2009 2010 2011 2012 2013 2014 2015 2016 2017 2018 2019 2020 2021 2022 2023 2024 2025 2026 2027 2028 2029 2030 2031 2032 2033 2034 9, 000 8. 0 7. 0 Declini ng num 11, 000 8. 5 6. 0 5. 5 Number of students (million) Number of small schools 21, 000 5. 0 Year Source: Lathapipat, Dilaka. and Lars Sondergaard (2015) 23
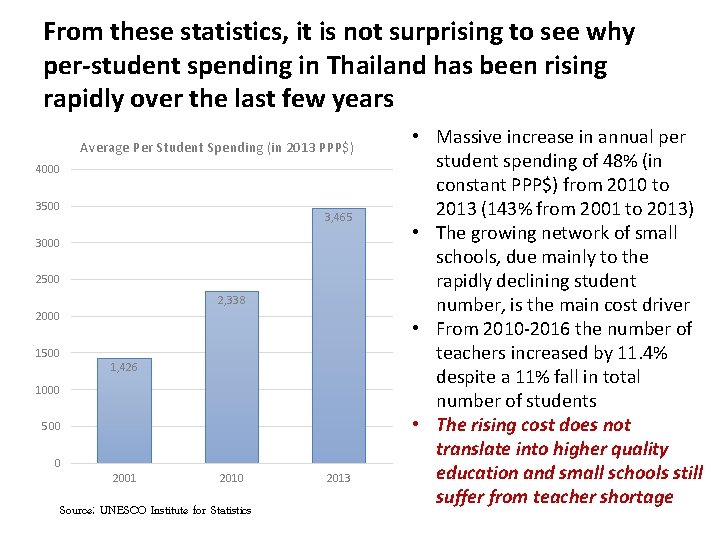
From these statistics, it is not surprising to see why per-student spending in Thailand has been rising rapidly over the last few years Average Per Student Spending (in 2013 PPP$) 4000 3500 3, 465 3000 2500 2, 338 2000 1500 1, 426 1000 500 0 2001 2010 Source: UNESCO Institute for Statistics 2013 • Massive increase in annual per student spending of 48% (in constant PPP$) from 2010 to 2013 (143% from 2001 to 2013) • The growing network of small schools, due mainly to the rapidly declining student number, is the main cost driver • From 2010 -2016 the number of teachers increased by 11. 4% despite a 11% fall in total number of students • The rising cost does not translate into higher quality education and small schools still suffer from teacher shortage
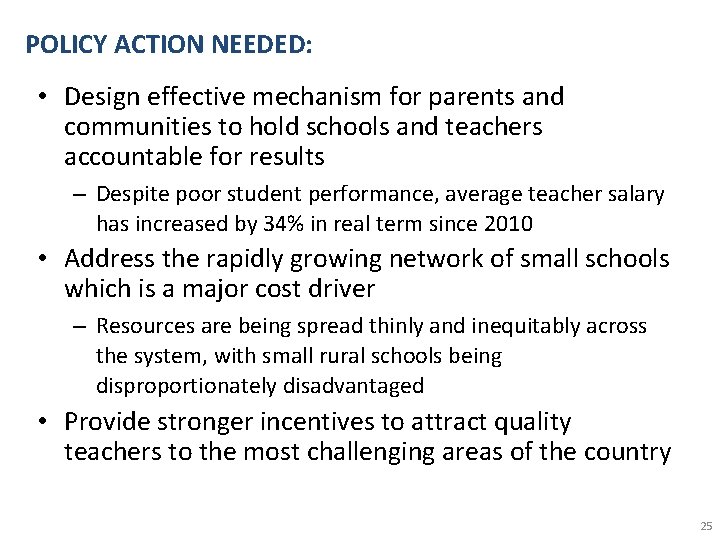
POLICY ACTION NEEDED: • Design effective mechanism for parents and communities to hold schools and teachers accountable for results – Despite poor student performance, average teacher salary has increased by 34% in real term since 2010 • Address the rapidly growing network of small schools which is a major cost driver – Resources are being spread thinly and inequitably across the system, with small rural schools being disproportionately disadvantaged • Provide stronger incentives to attract quality teachers to the most challenging areas of the country 25
Thank you! • For more details, please contact: • Dilaka Lathapipat, Human Development Economist, dlathapipat@worldbank. org