EDN 523 Educational Research Validity and Educational Reform


 o o o Police, Courts, and Prisons Crime-Related Production Costs")


 initiative is")


 7. Decisions about individual students should not be made on")
 VALIDITY")

 The State Board shall complete its initial")


, also")
 is")

 to discover what American students know")


 works with")


 of high-stakes testing has a long way to")


- Slides: 102
EDN 523 Educational Research Validity and Educational Reform
Accountability Models In the current age of educational reform, high-stakes decisions based on large-scale testing performance are becoming increasingly common. The decisions associated with test performance carry significant consequences (e. g. , rewards and sanctions). The degree of confidence in, and the defensibility of test score interpretations depends upon valid, consistent, and reliable measurements. Stated differently, as large-scale assessment becomes more visible to the public, the roles of validity (and reliability) become more important.
The Validity of Test Scores Validity is a test’s most important characteristic. Why? It is the degree to which a test measures what it is supposed to measure and as a consequence allows and supports appropriate interpretation of the scores.
Types of Test Validity o o Construct Validity – the degree to which a test measures an intended hypothetical construct. Content Validity – the degree to which a test measures an intended content area.
Construct Validity o The most important question to ask: What is this test really measuring? o As Professor Kozloff shared with you last week, we must first define what we want to measure: Constructs or concepts can be non-observable traits, such as intelligence, which are “invented” terms to explain educational outcomes.
Constructs o o o Constructs underlie the variables we want to measure. You cannot see a construct; you can only observe its effect. You can however, use constructs to explain differences among individuals.
For Example It has been observed that some students learn faster than others; o Some students learn more than others; o And some students retain what they learn longer than other students Using this information, we created a construct called intelligence that is related to learning and that everyone possesses to a greater or lesser degree. o
A Theory of Intelligence o o o From the observed and collected data, the construct of intelligence led to the development of a theory of intelligence. Tests were developed to measure the “amount” or how much intelligence a person has. Sometimes (at least occasionally) students’ whose achievement and/or test scores indicate that they have a lot of “it” tend to do better in school and other learning environments than those who have less of “it. ”
Construct Validity o o Research studies involving a construct are valid only to the extent that the test or instrument used actually measures the intended construct and not some unanticipated or intervening variable. Determining test construct validity is not easy!
For Example: Billy Bob’s IQ Test Let’s say Billy Bob owns a testing company in Texas. Billy Bob has designed an IQ test that he is marketing to public schools across the country. If we wanted to determine if Billy Bob’s IQ Test was construct valid, then we would need to carry out several validation studies.
Validating Billy Bob’s Test o o o First, we could see if students who scored “high” on Billy Bob’s Test learned faster, learned more, and retained more of what they learned than students who scored “low” on his test. Next, we could compare scores on Billy Bob’s Test at the beginning of the year with student’s grades at the end of the school year. We could also compare students’ scores on Billy Bob’s Test with scores on other, well-established IQ tests to see if they were highly related.
Professor Kozloff’s Findings Using Billy Bob’s Test and relating it to Dr. Kozloff’s presentation last week…if the findings “say” that a student has an IQ of 140 and this is confirmed when compared with the student’s scores on other, well-established IQ tests and other measurements, then these “matches” strengthen the construct validity or validness of Billy Bob’s Test as an intelligence measuring instrument.
What about Test Content Validity? Content Validity is based on professional judgments about the relevance of the test content to the particular domain of interest, such as the NC Standard Course Of Study, and about the representativeness with which items and/or task content on the instrument “cover” the domain.
NC ABCs of Accountability The Content Validity of the NC ABC Accountability Tests is directly related to whether or not the items, tasks, and concepts are aligned with the domains, constructs, and/or variables we are attempting to assess and measure. The establishment of evidence of test relevance and representativeness of the “target” domains is a critical first step in being able to say that the test score interpretations are based on strong content validity.
Content ↔Alignment ↔ Construct o o Alignment is a key issue in as much as it provides one avenue for establishing evidence for score interpretation. Validity is not a static quality; it is an evolving property and validation is a continuing process. Evaluating test alignment should occur regularly, taking its place in the recurring process of assessment development and revision of the testing instruments. An objective analysis of alignment as tests are adopted, built, or revised ought to be conducted on an ongoing basis. This is a critical step in establishing evidence of the validity of test score or performance interpretation
Test Evaluation Professor Kozloff discussed program decision making last week relative to evaluating whether or not a new reading program would be needed if students have low reading test scores. He recommended that we ask the following questions: How was the reading evaluated? Did the reading test DIRECTLY measure reading skills?
For Example: o o Did students get points if they guessed at what words said? Did students get points off if they guessed rather than sounded out the words? Are we measuring reading or are we measuring guessing? Did the test use objective/quantitative data or subjective/qualitative data?
What are we really measuring? Math Example: If we simply look at data on math ability among individuals, it initially appears that shoe size is directly related to a person’s math skills. Each time we test or measure a person’s math ability and compare it to their shoe size, there is a 1: 1 positive correlation; the larger a person’s shoe size, the better they are in solving higher level math problems. How is that possible?
A Valid Measurement: Age Shoe Size Age ↔ Math Ability
A Valid Measurement Education Level ↔ Earning Power College Graduate’s Earning Power High School Graduate’s Earning Power Are they related? You bet your derriere they are! College graduates average lifetime earnings = $ 2. 2 million HS graduates average lifetime earnings = $ 1. 2 million Difference = $ 1 million 30 year work life/$ 1 million = $33, 333 more per year
Cost of a College Education o o o The average yearly cost at a public 4 -year college is $8, 655 for in-state tuition, room and board. Over a four year period, the total cost for a college degree, considering increases and miscellaneous expenses, is approximately $40, 000. This data supports the contention that, though the cost of higher education is significant, given the earnings disparity that exists between those who earn a bachelor's degree and those who do not, the individual rate of return on an investment in higher education is sufficiently high enough to warrant the cost.
Individual and Community Benefits o o o Rate of return for college educated individual is almost twice as much income during his or her work life than a high school graduate. A college educated person contributes taxes into the national coffers and buys goods, services, and products to keep the country’s economy humming (an additional $425 billion by 2015) A person with a college degree typically makes better lifestyle choices which decreases health costs and burdens on medical support services.
Cost of An Uneducated Person It is estimated that there are 3. 8 million youth between the ages of 18 and 24 who are neither employed nor in school—roughly 15 percent of all young adults. Since 2000 alone, the ranks of these non-engaged young adults grew by 700, 000, a 19 percent increase over 3 years (Annie E. Casey Foundation, 2004).
High School Dropouts – A National Crisis o o o Almost 70% of prisoners did not complete high school. There appears to be some kind of relationship between dropping out of high school and a life of crime. Limited alternatives, easily turned to the dark side, and being reinforced for criminal behavior.
The Cost of Crime o o What is the impact of poorly educated citizens on our economy and quality of life? What are the costs?
Estimated Cost of Crime in the US Two Data Sources: U. S. Department of Justice Office of Justice Programs Bureau of Justice Statistics Data, (2005). D. A. Anderson, (1999) "The Aggregate Burden of Crime, " Journal of Law and Economics,
1. Cost of Crime: Police, Courts, and Prisons [ Source: Justice Expenditure and Employment Extracts
2. Crime-Related Production Costs? Cost of goods and services that would be unnecessary in a country with low crime rates. o Money spent on locks and safes = $4 billion o Surveillance cameras = $1. 4 billion o Computer virus screening and security = $ 8 billion o Drug trafficking = $160 billion o Federal agencies to fight crime = $23 billion o Medical care to treat the victims of crime = $8. 9 billion o Newborns exposed to cocaine & heroine = $28 billion Total = $ 233. 3 billion
Opportunity Costs of Crime In addition to the direct cost of resources devoted to crime, there is a sizable loss of time by people who are potential victims of crime and by those who have committed crime. And as the saying goes time is money.
Time Lost to Crime o o If there were no crime, there would be no criminals. Instead of sitting idle in jails, these people - over 1 million of them - could be productive members of the economy, so chalk up $35 billion. Also, there is much time lost in planning and executing crimes $4. 1 billion worth. Then add to that the value of work time lost by victims ($876 million) and the time spent on neighborhood watches ($655 million).
Total for Lost Time Due to Crime o o o $39. 1 Billion – Prisoners not working $ 1. 5 Billion –Victims lost work time $ 4. 1 Billion –Time planning & committing crimes Total = $ 44. 7 Billion
Life and Health Crime Costs o o We accounted for the cost of medical expenses, but we should also consider the cost of a life and injury in addition to the direct costs incurred by the medical system. There approximately 72, 000 crime related deaths a year and 2. 5 million crime related injuries every year. Let’s put a dollar value on a life and injuries. What is a life worth? Conservative estimate: $80, 000. An injury: $52, 637. With these numbers, the total cost of crime for lost life and injuries comes to $ 137. 8 billion
Crime Transfer Costs - Fraud We also need to add the cost of property and money that is stolen or obtained through fraud. o Fraud at work $203 Billion o Unpaid taxes $123 Billion o Health insurance fraud $108 Billion o Auto theft $8. 9 billion o Coupon fraud racks up $912 million annually. Total comes to $603 billion.
Grand Total (Conservative Estimate) o o o Police, Courts, and Prisons Crime-Related Production Costs Lost Time Due to Crime Life and Health Crime Costs Crime Transfer Costs (Fraud) = $ 170. 0 = $ 234. 0 = $ 44. 7 = $ 137. 8 = $ 603. 0 B B B Grand Total = $1. 12 Trillion Dollars Per Year
An Uneducated Person: Impact Effects o o Adults without a high school diploma are twice as likely to be unemployed. They will earn $260, 000 less over a lifetime than a high school graduate and $1 million less than a college graduate Dropouts make up nearly 70 percent of inmates crowding state prisons and at least half those on welfare. Crime costs our country $1. 12 Trillion Dollars A Year
The High School Diploma Gateway or Barrier to a prosperous, successful life If you have it, you have opportunities If you don’t have it, you have a cross to bear
Failure to Graduate High School What is the primary reason students drop out of school and do not graduate with a diploma? THEY CANNOT READ!
So, What is the Big Deal About Reading? Let’s see…educated citizenry, economic wellbeing, secure and prosperous nation, successful individuals capable of providing for themselves and their families…what do you think?
NC Reading Legislation: Senate Bill 16 Passed in 1995 sponsored by then state senator Beverly Perdue, required the State Board of Education to reorganize the NCDPI and to develop an accountability plan for the state. The result was the ABCs of Public Education, which included a plan to revise the Standard Course of Study. The General Assembly accepted the accountability plan and subsequently enacted Senate Bill 1139, the School. Based Management and Accountability Program.
Senate Bill 1139 o o Sponsored by former Senator Leslie Winner (D-40 th Dist. ), established the requirement that the State Board of Education develop a comprehensive reading plan for North Carolina as part of the revised Standard Course of Study. According to the bill, “the General Assembly believes that the first, essential step in the complex process of learning to read is the accurate pronunciation of written words and that phonics is the most reliable approach to arriving at the accurate pronunciation of a printed word. ”
Outcomes of Senate Bill 1139 o o o The bill mandated that the reading plan include early and systematic phonics. A member of a prominent reading interest group, who shall remain nameless, (but their initials are Whole Language) called the bill the “phonics legislation. ” A representative from the NCDPI spoke to the legislature’s focus on phonics and suggested that, “some members of the legislature had the opinion that teachers weren’t teaching phonics, that the ‘whole language movement’ had gotten the upper hand in the state and that reading skills were not being taught. ”
Reading Legislation o o In 1997, Congress asked the Director of the National Institute of Child Health and Human Development (NICHD) at the National Institutes of Health, in consultation with the Secretary of Education, to convene a national panel to assess the effectiveness of different approaches used to teach children to read. For over two years, the National Reading Panel (NRP) reviewed research-based findings on reading instruction and held open panel meetings in Washington, DC, and regional meetings across the United States.
NRP Research Report o o The National Reading Panel only looked at studies that met the most rigorous standards of scientifically based research. On April 13, 2000, the NRP concluded its work and submitted "The Report of the National Reading Panel: Teaching Children to Read, " at a hearing before the U. S. Senate Appropriations Committee's Subcommittee on Labor, Health and Human Services, and Education.
Impact of NRP Report o o Part of the No Child Left Behind Act of 2001, signed into law on January 8, 2002, was President Bush's unequivocal commitment to ensuring that every child can read by the end of third grade. To accomplish this goal, the new Reading First Initiative significantly increased the federal investment in scientifically based reading instruction programs in the early grades.
Reading First o o o NCLB established Reading First as a new highquality, evidence-based program for students The new Reading First State Grant program makes six-year grants to states, which in turn make competitive subgrants to local communities. Building on a solid foundation of research, the program is designed to select, implement, and provide professional development for teachers using scientifically based reading programs, and to ensure accountability through ongoing, valid and reliable screening, diagnostic, and classroombased assessment.
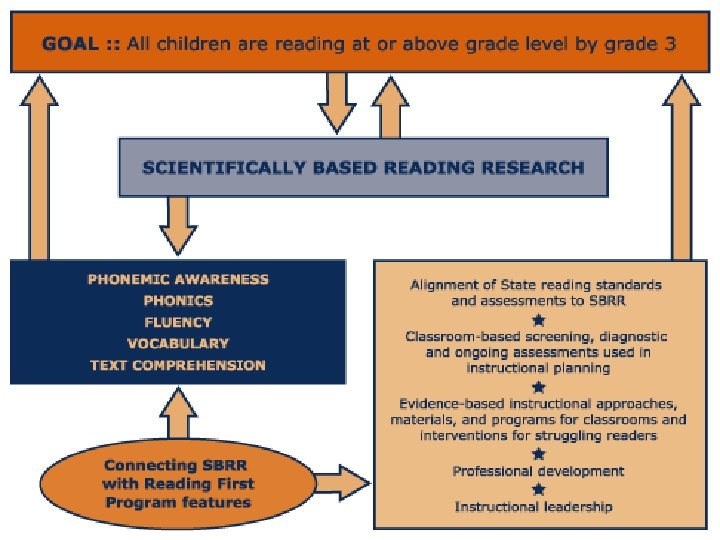
Reading First: SBR Research The Goal of North Carolina's Reading First (NCRF) initiative is to ensure that all children learn to read well by the end of the third grade. This goal will be accomplished by applying scientifically based reading research to reading instruction in all North Carolina schools. The initiative requires phonics instruction.
Phonics Model of Reading Instruction o o o Phonemic Awareness Attentiveness to the sounds of spoken language. Phonics Decoding unfamiliar words using knowledge of the alphabetic principle. Fluency Grade-appropriate oral reading with appropriate speed, accuracy, and expression. Vocabulary Development Knowledge of word meanings to facilitate effective spoken and written language communication. Text Comprehension Use of a variety of comprehension strategies to monitor comprehension to construct meaning from print.
SBR and Standardized Tests o o Test Construct Validity - Research studies involving a construct are valid only to the extent that the test or instrument used has been determined by SBR to actually measure the intended construct and not some unanticipated or intervening variable. Test Content Validity - based on the relevance of test items and tasks to the domain of interest (in our case the NC Standard Course Of Study), and the representativeness with which items and tasks on the instrument “cover” the domain.
Content ↔Alignment ↔ Construct Alignment is a key issue in standardized tests, as much as it provides a means for establishing evidence for score interpretation. Test validity is not a static quality; it is an evolving property and a continuing process.
NC ABCs Model Test content validity is based on professional judgments about the relevance of the test content to the content of a particular behavioral domain of interest & about the representativeness with which items and tasks cover that domain.
Reading Achievement Test If a test is designed to measure reading achievement and a test score is judged relative to a set proficiency standard (i. e. , a cut score), the interpretation of reading proficiency will be heavily dependent on a match (or alignment) between test content and content area expectations.
Alignment is a Key Issue Alignment provides an avenue for establishing evidence for score interpretation. Evaluating test alignment should occur regularly, taking its place in the recurring process of assessment development and revision of the testing instruments. In addition, tests should be regularly assessed and evaluated following established standards.
Standards for Test Validity The "Standards for Educational and Psychological Testing" established by the American Educational Research Association, the American Psychological Association, and the National Council on Measurement in Education, are intended to provide a comprehensive approach for evaluating tests based on key standards applicable to most test evaluation situations (Rudner, 1994).
Part I: Test Construction, Evaluation, and Documentation o o o Validity Reliability and Errors of Measurement Test Development and Revision Scales, Norms, and Score Comparability Test Administration, Scoring, and Reporting Supporting Documentation for Tests
Part II: Fairness in Testing o o Fairness in Testing and Test Use The Rights and Responsibilities of Test Takers Testing Individuals of Diverse Linguistic Backgrounds Testing Individuals with Disabilities
Part III: Testing Applications o o o The Responsibilities of Test Users Psychological Testing and Assessment Educational Testing and Assessment Testing in Employment and Credentialing Testing in Program Evaluation and Public Policy
If we consider the NC ABCs’ Testing Model, then we should ask the following questions: o o o Who is the test designed for? What are the intended uses of the test? What interpretations are appropriate? Does the test represent a valid assessment of the content and constructs identified in the NC Standard Course of Study? Is the test appropriate for students?
NC ABCs: Intended Uses If we consider these questions relative to the NC ABCs Testing Model , then there must be a clear statement of recommended uses, a meaningful description of the population for which the test is intended, and a valid representation of the NC Standard Course of Study (NCSCOS).
What Do We Mean By Test Validity? The individuals in the norming and validation samples should represent the group for which the test is intended in terms of age, experience and background.
Questions To Ask: o o o o How were the samples used in pilot testing, validation and norming chosen? How is this sample related to your student population? Were participation rates appropriate? Was the sample size large enough to develop stable estimates with minimal fluctuation due to sampling errors? Where statements are made concerning subgroups, are there enough test-takers in each subgroup? Do the difficulty levels of the test and criterion measures (if any) provide an adequate basis for validating and norming the instrument? Are there sufficient variations in test scores?
Evaluating the Validity of NC ABCs Model In an effort to evaluate the validity of the NC ABCs Accountability System, the State Board of Education established a plan in March, 2005 that will utilize the Standards for Educational Accountability Systems model developed by the National Center for Research on Evaluation, Standards, and Student Testing.
Testing Standards & ABCs System Components 1. Accountability expectations should be made public for all participants in the system. 2. Accountability systems should employ many different types of data from multiple sources. 3. Accountability systems should include data elements that allow for interpretations of student, institution, and administrative performance. 4. Accountability systems should include the performance of all students, including subgroups that historically have been difficult to assess. 5. The weighting of elements in the system, including different types of test content, and different information sources, should be made explicit. 6. Rules for determining adequate progress of schools and individuals should be developed to avoid erroneous judgments attributable to fluctuations of the student population or errors in measurement.
Standards & Components (continued) 7. Decisions about individual students should not be made on the basis of a single test. 8. Multiple test forms should be used when there are repeated administrations of an assessment. 9. The validity of measures that have been administered should be documented for the various purposes. 10. If tests are to help improve system performance, there should be information provided to document that test results are modifiable by quality instruction and student effort. 11. If test data are used as a basis of rewards or sanctions, evidence of technical quality of the measures and error rates associated with misclassification of individuals or institutions should be published. 12. Evidence of test validity for students with different language backgrounds should be made public. 13. Evidence of test validity for children with disabilities should be made publicly available. 14. If tests are claimed to measure content and performance standards, analysis should document the relationship between the items and specific standards or sets of standards.
Test Validity Legislation NC G. S. 115 C-105. 35, Section 7. 12 (a) VALIDITY OF ABC ACCOUNTABILITY SYSTEM During the 2004 -2005 school year and at least every five years thereafter, the State Board shall evaluate the accountability system and, if necessary, modify the testing standards to assure the testing standards continue to reasonably reflect the level of performance necessary to be successful at the next grade level or for more advanced study in the content area.
ABCs Test Evaluation As part of this evaluation, the State Board shall, where available, review the historical trend data on student academic performance on State tests. To the extent that the historical trend data suggests that the current standards for student performance may not be appropriate, the State Board shall adjust the standards to assure that they continue to reflect the State's high expectations for student performance.
Test Alignment Adjustments SECTION 7. 12. (b) The State Board shall complete its initial evaluation and any necessary modifications to the testing standards required under G. S. 115 C 105. 35, as rewritten by subsection (a) of this section, so that the modified standards are in effect no later than the 2005 -2006 school year.
Results of the 2004/2005 Evaluation A review of the original growth formulas found that: Statewide ABCs growth over time, by grade level, forms a saw-toothed pattern of gains and dips in the percent of schools meeting and exceeding growth targets in reading or mathematics as a cohort of students moves from grade to grade. The percent of schools meeting or exceeding growth expectations in reading or mathematics does not appear to be highly correlated to curricular implementation (i. e. , an historically high percent of schools met and exceeded expectations in the first year of testing a new curriculum).
SBE Determined Test Adjustments Were Needed 1. Base expected student performance on past student performance. 2. Separate reading scores from mathematics scores; i. e. , a student’s reading score can be included in the ABCs calculations, even if that student does not have a score in mathematics, 3. Do not produce the saw-toothed pattern in percentages of schools meeting expectations at consecutive grade levels over time as a cohort moves through a school, 4. Adjust for the difference in relative difficulty of the curriculum among adjacent grade levels as the curriculum is revised, 5. Produces valid and reliable results.
Quasi-Longitudinal Model North Carolina’s ABCs Accountability Model uses a quasi-longitudinal approach wherein at least a year’s worth of growth for a year of schooling is expected. The average rate of growth observed across the state as a whole from one grade in the spring of one year to the next grade in the spring of the next year serves as a benchmark improvement for students in a given grade. Comparisons to expected growth are used to classify schools into one of Four categories: exemplary schools, schools meeting expected growth, schools having adequate performance, and low-performing schools
NC ABCs Model
A Recommended Model The quasi-longitudinal model is recommended by most research and evaluation groups and organizations as a more “accurate” means for assessing public school performance. If that is true, how does NC’s Accountability Model compare to other states?
NC ABCs Model and Other Models The National Assessment of Educational Progress (NAEP), also known as "the Nation's Report Card, " is the only nationally representative and continuing assessment of what America's students know and can do in various subject areas. Since 1969, assessments have been conducted periodically in reading, mathematics, science, writing, US history, civics, geography, and the arts.
NAEP – The Nation’s Report Card The National Assessment of Educational Progress (NAEP) is a congressionally mandated project of the National Center for Education Statistics (NCES), within the Institute of Education Sciences at the U. S. Department of Education
National Comparisons o o o NAEP produces a national set of scores based on the performance of students across the country and state-level results for participating states and jurisdictions. While all states conduct annual standardized tests to report on the performance of students on their specific curriculum objectives, the state assessments vary substantially from state to state, so results among the states cannot be compared. NAEP helps understand how a given state’s performance compares to the national average and to that of other states.
Goals of NAEP has two major goals: 1) to discover what American students know and can do in key subject areas, and 2) to measure educational progress over long periods of time.
Two Types of NAEP Assessments o o Main NAEP - Every 2 years, reading and mathematics are assessed at the national level at grades 4, 8, and 12, and at the state level at grades 4 and 8. Every 4 years, science and writing are assessed at the national level at grades 4, 8, and 12, and at the state level at grades 4 and 8. Other subjects are assessed periodically. Long-term Trend NAEP - measures student performance at the national level in reading and mathematics over time, using questions and question formats that have remained relatively fixed from 1969 to the present. Recent scores can be compared with those from earlier decades. The Long-term Trend assessment is administered to 9, 13, and 17 -year-olds. Beginning with the 2004 Long-term Trend assessment, results will be reported for the nation every 4 years.
NAEP Sample Selection o o o NAEP assessments are administered to samples of U. S. students in grades 4, 8, and 12. Schools are selected to be representative of states, the nation, or other jurisdictions as appropriate. Students are then randomly selected from those schools to participate. NAEP does not provide scores for individual students or schools. Any one student takes only a small portion of the whole assessment. The responses are combined and the results are reported for groups of students by characteristics such as gender and racial/ethnic membership. Participation in NAEP is voluntary for students who are selected and has no effect on a student’s grades.
Deciding What is Assessed o o The National Assessment Governing Board (NAGB) works with teachers, curriculum specialists, administrators, parents, and members of the public to select subjects and define content for each Main NAEP assessment, as well as to develop assessment objectives and test specifications. NAGB members are appointed by the U. S. Secretary of Education. The Board consists of 26 members, including teachers, state governors, state legislators, testing experts, school principals, and parents.
NAEP Assessment Frameworks o o Each Main NAEP assessment is built from an organizing content framework which specifies what students should know and be able to do at a given grade level. These frameworks guide the design of the questions that are ultimately given to students.
NAEP Participation Rates o o Over the years, 40 to 45 states usually elected to participate in the state NAEP assessments. Beginning in 2003, the No Child Left Behind Act of 2001 required all states and school districts receiving federal Title I funds to participate in biennial NAEP reading and mathematics assessments at the fourth and eighth grades.
NAEP Test Item Development o o o The NAEP item developers go to great lengths to make certain that the questions reflect educators’ best thinking about what students know and should be able to do. (CONSTRUCT VALIDITY) Based on NAEP frameworks, testing specialists develop questions with the help of teachers, curriculum specialists, and measurement experts. Numerous and on-going reviews of the questions and responses take place to assure appropriateness and fairness. (CONTENT VALIDITY)
Pilots and Field Tests o o o After questions undergo initial reviews by test development staff, subject-area specialists, and NAGB, they are pilot tested with small numbers of students. Based on the results of the pilot tests and additional reviews by content and assessment experts, questions are selected and refined for use in a field test. The field tests, which are administered to thousands of students, are then scored analyzed. Suitable questions for the actual assessment are chosen based on field-test results and framework specifications.
NAEP Test Booklets o o o The NAEP development process results in an assessment that may have hundreds of questions. The 2003 fourth-grade mathematics assessment, for example, had more than 140 individual items. However, no student who participates in NAEP takes the entire NAEP assessment. The questions are separated into groups and packaged into booklets. Each student receives one booklet, which contains a portion of the questions— anywhere from 10 to 20 percent of the whole assessment. The booklets are distributed so that only a small percentage of students in a given school get the same assessment booklet.
NAEP Test Items o o NAEP assessments include both multiplechoice and open-ended questions. The openended questions call for student-composed responses. The students write an answer that can be anywhere from a few words to several paragraphs in length—even longer on writing assessments.
Sample Selection Process o NAEP selects a sample large enough to assure valid and reliable results but generally does not include every student in the grades being assessed. o For example, in 2003, about 190, 000 grade 4 students in 7, 500 schools and about 153, 000 grade 8 students in 6, 100 schools participated in the mathematics assessment. (Similar numbers of students participated in the reading assessments at grades 4 and 8. ) o Schools located in states or districts that receive Title I funds are required to participate in biennial NAEP reading and mathematics assessments at grades 4 and 8 if they are selected. School participation is voluntary in all other assessments.
NAEP National Sample Selection o o o For the national assessments, in a year without state assessments, NAEP selects a random sample of public and private school students to represent the diverse student population in the United States. When conducting only a national assessment without state assessments, typically 6, 000 to 10, 000 students per grade for each subject are assessed. The national samples are chosen using a stratified two-stage design: schools are classified first by geographic location and then by level of minority enrollment. Within each location and enrollment based category, a predetermined proportion of schools is randomly selected, providing accurate results for all students—and all subgroups.
State Sample Selection Process o o o In a typical state, NAEP selects about 3, 000 students in approximately 100 schools for each grade and each subject assessed. The samples are selected using a two-stage design that first selects schools within each state or other jurisdiction and then selects students within schools. First, schools are classified and sorted based on characteristics they have in common. Then they are randomly selected. (To ensure that the student sample represents students from large and small schools in the appropriate proportions, large schools are more likely to be selected than small ones. ) Once NAEP has identified the schools for the assessment, students within each participating school are selected randomly. In state assessment years, the state samples are combined to produce a national sample.
NAEP Scale Scores A score, derived from student responses to NAEP assessment items, that summarizes the overall level of performance attained by a group of students. NAEP subject area scales typically range from 0 to 500 (reading, mathematics, history, and geography) or from 0 to 300 (science, writing, and civics). When used in conjunction with interpretive aids, such as item maps, they provide information about what a particular aggregate of students in the population knows and can do.
NAEP Assessments o o The 2003 assessments in reading and mathematics had a state components at grades 4 and 8. Overall, 53 states and jurisdictions participated in the two assessments. In 2002, 51 states and jurisdictions participated in the writing assessment at grades 4 and 8. The most recent state assessments were held in 2005 in reading and mathematics.
NAEP Achievement Level Scores o o In addition to reporting student scale scores, NAEP reports the percentage of students in the nation, state, or group of students who have reached certain NCLB achievement levels of performance The achievement level scores are specified as Basic, Proficient, or Advanced—for each subject.
NAEP Contextual Results o o o As part of the NAEP assessment, teachers, administrators, and students complete background questionnaires that are analyzed along with the assessment results. Using the information obtained from the background questionnaires, student performance can be compared across NAEP’s reporting variables (ex. , boys vs. girls) NAEP also looks at various factors that may relate to academic achievement including courses taken, homework requirements, how often textbooks are used, and amount of computer use.
Reliability of NAEP Test Results o o Comparisons in NAEP are not based just on numerical differences. NAEP uses traditional statistical methods to test whether the differences might have occurred just by chance or whether they are reliable—whether repeating the assessment with other students in the same groups, with other schools, or on different days would give the same result.
NAEP Reports NAEP reports information for the nation and specific geographic regions of the country. It includes students drawn from both public and nonpublic schools and reports results for student achievement at grades 4, 8, and 12. It also provides state comparison information.
NAEP State Results Since 1990, NAEP assessments have been conducted to give results for participating states. Those that choose to participate receive assessment results that report on the performance of students in that state. In its content, the state assessment is identical to the assessment conducted nationally. However, because the national NAEP samples were not, and are not currently designed to support the reporting of accurate and representative state-level results, separate representative sample of students are selected for each participating jurisdiction/state.
NAEP Assessments o o These assessments follow the frameworks developed by the National Assessment Governing Board (NAGB), and use the latest advances in assessment methodology. For example, NAEP assessments include a large percentage of constructed-response questions and questions that require the use of calculators and other materials.
Student Samples o o o Beginning with the 2002 assessments, a combined sample of public schools was selected for both state and national NAEP. Therefore, the national sample is a subset of the combined sample of students assessed in each participating state, plus an additional sample from the states that did not participate in the state assessment. This additional sample ensures that the national sample is representative of the total national student population. The full data set is analyzed together, allowing all data to contribute to the final results and setting a single scale for the assessment. All results are then reported in the scale score metric used for the specific assessment. State Proficiency Scores vs. NAEP Proficiency Scores
NC Ranks 37 th Out 40 States 4 th Grd Reading D 4 th Grd Math D 8 th Grd Reading F 8 th Grd Math F Overall Grade D-
NAEP on the Web Public access to all NAEP information, data, and reports is available on the following web sites: o NAEP Data Explorer: http: //nces. ed. gov/nationsreportcard/naepdata o NAEP Questions Tool: http: //nces. ed. gov/nationsreportcard/itmrls o NAEP State Profiles: http: //nces. ed. gov/nationsreportcard/states
In Summary The validity (and reliability) of high-stakes testing has a long way to go. NCLB has established the beginning of an accountability system that it is attempting to ensure high quality public schools across the country. Regardless of how we feel about the mandate and subsequent requirements we should be compelled to continue our quest for measuring student performance and “how we are doing” for the following reasons:
North Carolina ranks 34 th in college attendance rates among the 50 states. 85% of all jobs by 2010 will require 14 or more years of education. Less than 80% of adult North Carolinians have completed high school. Only 3 states have lower high school completion rates than North Carolina. Less than a third of NC's fourth and eighth graders scored in the proficient range on standardized tests. NC places 47 th in a state comparison of SAT scores. The placement improves to 32 nd when the scores are adjusted for the number of students being tested. Twelve percent of teens 16 to 19 in NC are not enrolled in school & are not high school graduates. When the number of adults holding college degrees in NC is compared with other states, we're dropping further behind, from 37 th to 39 th.
There is A Lot of Work to Do! Questions & Comments