ED 850 Seminar on Quantitative Methods of Inquiry

 S= 2 ∑ (x-x) ____ N-1")


 X 1 = HS")


- Slides: 21
ED 850: Seminar on Quantitative Methods of Inquiry “engage in the scientific method and other forms of inquiry to assess practice, examine results and promote sound decision-making in post-secondary education” J. Luke Wood, Ph. D
Hierarchical Multiple Regression (HMR) S= 2 ∑ (x-x) ____ N-1
Background Variables Social Variables Academic Variables Environmental Variables S= Items Time status Educational goals High school GPA Intramural sports Varsity sports Extracurricular activities Talk with faculty Academic advising Study habits Library usage Finances Hours worked per week Supporting others Life Stress 2 ∑ (x-x) ____ N-1
Background Variables Social Variables Academic Variables Environmental Variables S= Items Time status Educational goals High school GPA Intramural sports Varsity sports Extracurricular activities Talk with faculty Academic advising Study habits Library usage Finances Hours worked per week Supporting others Life Stress 2 ∑ (x-x) ____ N-1
Background Variables Social Variables Academic Variables Environmental Variables S= Items Time status Educational goals High school GPA Intramural sports Varsity sports Extracurricular activities Talk with faculty Academic advising Study habits Library usage Finances Hours worked per week Supporting others Life Stress 2 ∑ (x-x) ____ N-1
Background Variables Social Variables Academic Variables Environmental Variables S= Items Time status Educational goals High school GPA Intramural sports Varsity sports Extracurricular activities Talk with faculty Academic advising Study habits Library usage Finances Hours worked per week Supporting others Life Stress 2 ∑ (x-x) ____ N-1
Background Variables Social Variables Academic Variables Environmental Variables S= Items Time status Educational goals High school GPA Intramural sports Varsity sports Extracurricular activities Talk with faculty Academic advising Study habits Library usage Finances Hours worked per week Supporting others Life Stress 2 ∑ (x-x) ____ N-1
Some Types of Multiple Regression Standard Multiple Regression – “all IVs are entered into the analysis simultaneously” Hierarchical Multiple Regression – a “variable is entered into the analysis first. Subsequent variables are then added in order to determine the specific amount of variance they can account for, above and beyond what has been explained by any variables entered prior” Stepwise Multiple Regression – “to determine which specific Ivs make meaningful contributions to the overall prediction” (Mertler & Vannatta, p. 164)
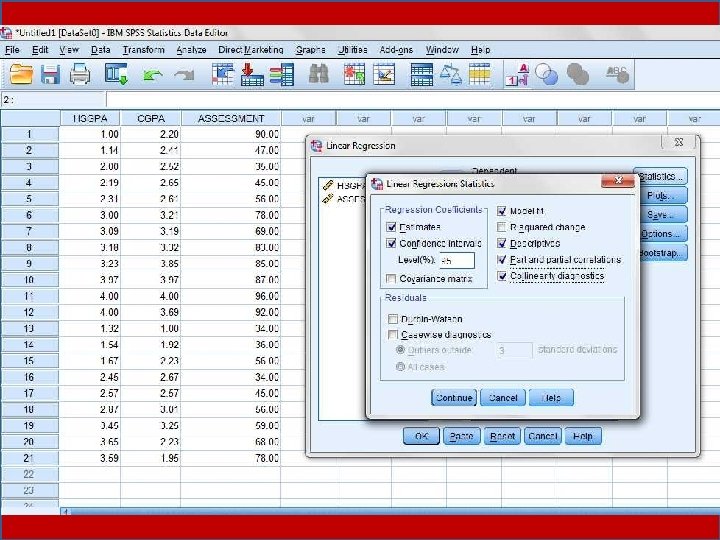
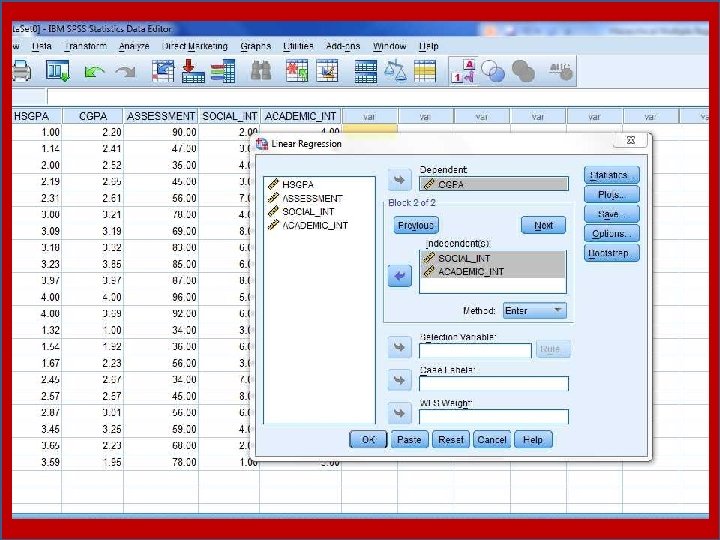
PREVIOUS: Example Study Y = College GPA (0 -4. 0) X 1 = HS GPA (0. 0 – 4. 0) X 2 = Entrance exam score (0 – 100) Data collected from 21 participants. Research question: How accurately can college GPA be predicted by high school GPA and entrance exam scores?
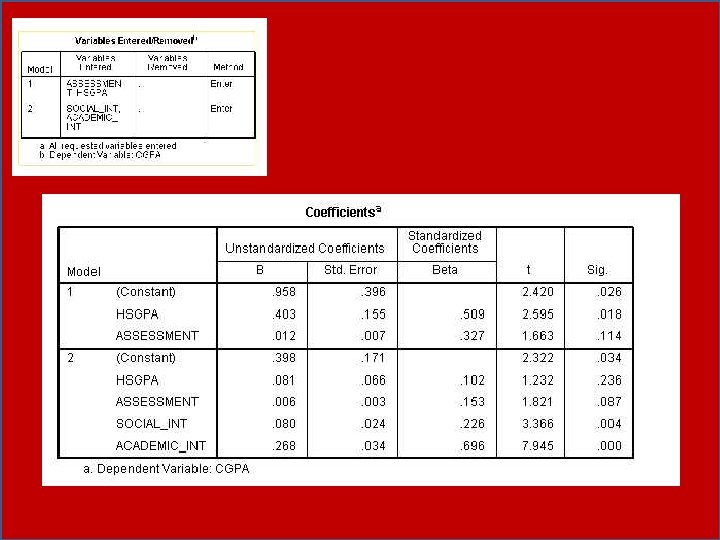
Y’ = b 0 + b 1 X 1 + b 2 X 2+ e Predicted CGPA=. 958 +. 403 X 1 +. 012 X 2+ e Predicted CGPA=. 509 Z(X 1)+. 327(X 2)+ e
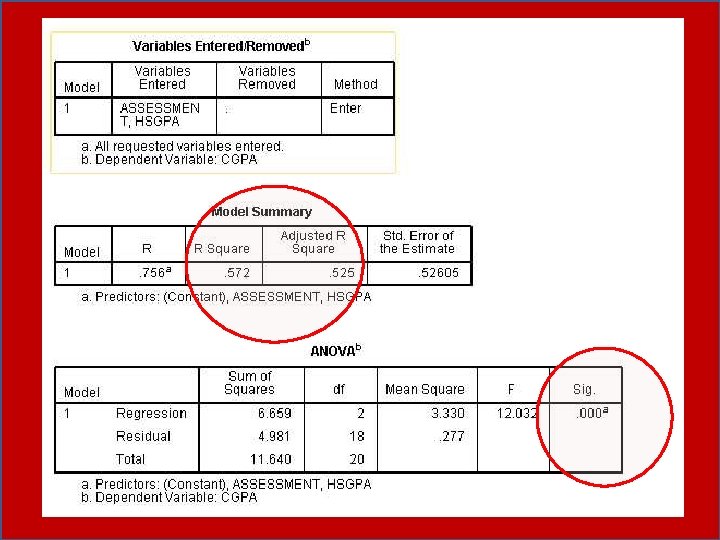
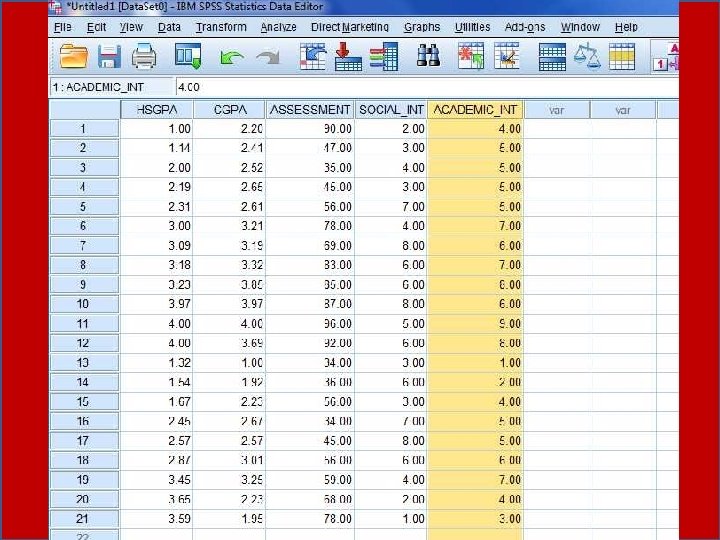
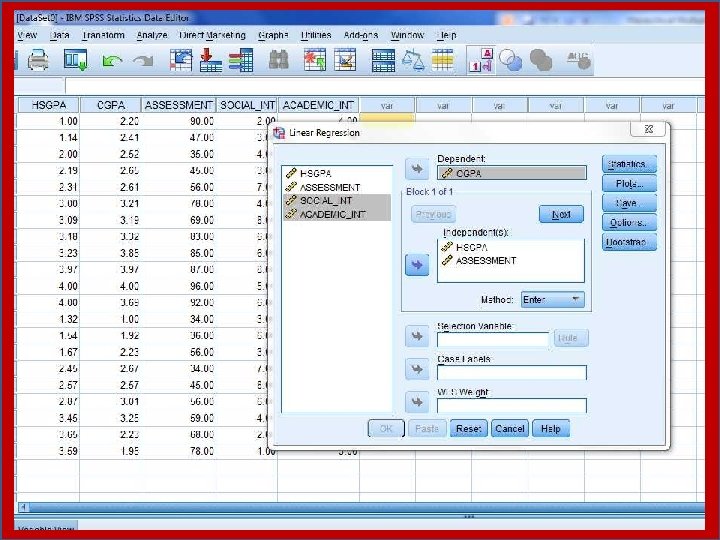
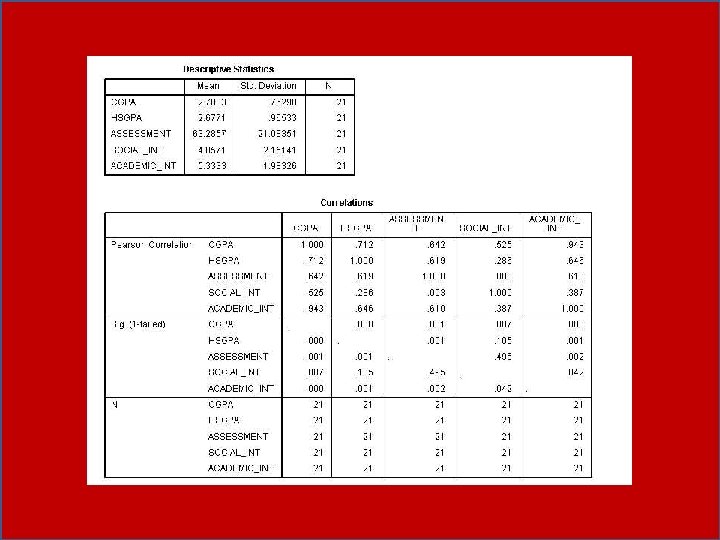
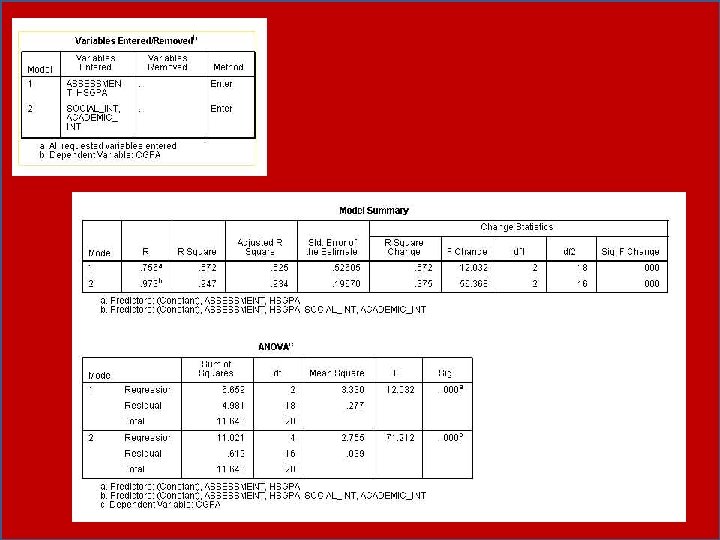
This study sought to determine the predictive value of precollege academic performance and student integration on college GPA. Precollege performance was assessed by two variables, high school grade point average and assessment test score. Student integration was assessed through two composite variables, representing scales of social and academic integration. Using a hierarchical linear regression, findings for Block 1 indicated that high school GPA was a significant predictor of college GPA (b=. 403, p<. 05), however, assessment test score was not significantly predictive of college GPA (b=. 012, p=n. s. ). The first block accounted for 57. 2 percent of the variance in the outcome, as assessed by r squared. The second model employed the same variables in the first model but added the composite measures of social and academic integration. Neither, high school GPA nor assessment score were found to be predictive of college GPA, when controlling for student integration. Social integration was found to be significantly predictive of college GPA (b=. 080, p<. 01), as was the measure of academic integration (b=. 268, p<. 001). The second model illustrated a r square change of. 375, a significant increase from the first model (p<. 001). Thus, the variables examined, collectively accounted for 94. 7% of the variance of college GPA.
ED 850: Seminar on Quantitative Methods of Inquiry “engage in the scientific method and other forms of inquiry to assess practice, examine results and promote sound decision-making in post-secondary education” J. Luke Wood, Ph. D