Ecosystem Ecology I Introduction II Energy Flow III


 Atmosphere (13) OVER")


 Cut forest – reduce evapotranspiration, increase runoff and river discharge")


: 3, 704 dead,")


. A preliminary water balance for the Colorado River Delta, 1992")


 and")


 416 280")
")
 – 26%")


 1979 Nasa. gov 2012")


 \"Multiple Stable States\" GRASSLAND (dry, many fires)")

 FEAST FAMINE")


- Slides: 88
Ecosystem Ecology I. Introduction II. Energy Flow III. Biogeochemical Cycles
III. BIOGEOCHEMICAL CYCLES A. Overview Small reservoir “Turns fast” FLUX “Turns slow” Large reservoir
B. The Water Cycle
B. The Water Cycle All values in teratons (x 1018 g) Atmosphere (13) OVER OCEAN Rain Evaporation (385) (425) Oceans - 97% (1, 380, 000) OVER LAND Rain Evaporation (111) (71) Runoff and Groundwater (40) Lakes and Rivers (100) Water content in sedimentary rock near surface (210, 000) Biosphere (1)
B. The Water Cycle
B. The Water Cycle - Effects of Life 1. Plant biomass pumps water out of the soil into the atmosphere, increasing evaporation rates. 2. Volatiles act as nuclei on which raindrops can form ("Smoky Mountains"), increasing local precipitation. Large forests stimulate the rainfall they depend on.
-Effects of Life: 1) Cut forest – reduce evapotranspiration, increase runoff and river discharge 2) Eventually, reduce precipitation, and reduce river discharge.
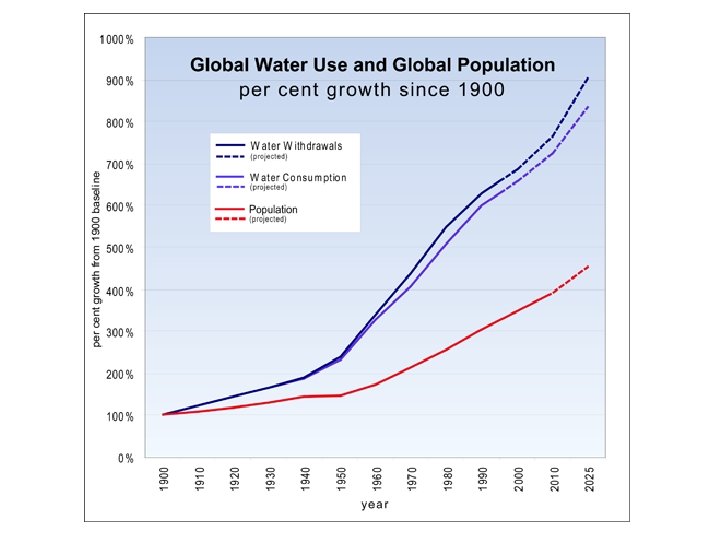
B. The Water Cycle - Effects of Humans
B. The Water Cycle -Effects of Humans 1. Control 50% of surface runoff of planet - 70% agriculture - 20% industry - 10% personal use
98% of water ‘footprint’ for animals is for their feed. 30% of all water used for animals is for beef cattle Another 20% for dairy cattle
B. The Water Cycle -Effects of Humans 1. Control 50% of surface runoff of planet - 70% agriculture - 20% industry - 10% personal use 2. Dams - hydroelectric power - create reservoirs for irrigation - control floods
2. Dams – Three Gorges, Yangtzee River 1. 5 miles wide, 600 feet high Largest dam in the world – largest engineering project in the world.
1. 5 miles wide, 600 feet high Reservoir 570 feet deep and nearly 400 miles long.
Energy = 18 nuke plants. At full power, reduces coal consumption by 31 million tonnes per year, avoiding 100 million tonnes of greenhouse gas emissions 100
Regulate a deadly, flood-prone river: The 1998 flood (before the dam): 3, 704 dead, 15 million homeless and $26 billion in economic loss. A staggering 25 million acres (~Kentucky) were evacuated, 13. 3 million houses were damaged or destroyed.
Displaced 1. 2 million people Cover 1300 important archeological sites
2. Dams – Problems: - Flood upstream habitats - release toxins into water - cause eutrophication - reduce oxygen content of water - sediment buildup decreases “head” and power generation - sediment trap starves downstream of sediment and nutrients – erosion of river delta and loss of productive estuary - reduce fisheries productivity “The construction of dams is increasingly regarded as the biggest conservation threat to aquatic and riparian biodiversity in many river basins throughout the world. ” J. Wu, J. Huang, and X. Han. 2003. Science 302: 11 -49 -1150.
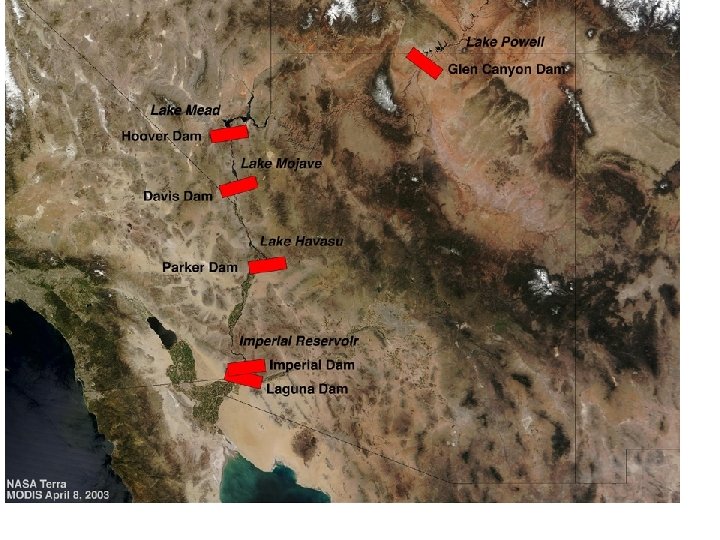
B. The Water Cycle -Effects of Humans 1. Control 50% of surface runoff of planet - 70% agriculture - 20% industry - 10% personal use 2. Dams 3. Overtapped Rivers Major rivers like the Colorado, Nile, Ganges, Yellow don’t reach the ocean for months at a time – all the water is drawn off by humans upstream.
Glen Canyon – 710 ft Hoover – 726 ft tall
Cohen, et al (2001). A preliminary water balance for the Colorado River Delta, 1992 -1998. J. Arid Environments 49: 35 -48. Hoover Dam Glen Canyon Dam
3. Overtapped Rivers The Aral Sea, Kazakhstan: once the 4 th largest inland sea in world Has lost 60% of its water, drawn off for agricultural purposes. - Salinization increased, killing the productive fisheries industry - Agriculture – salt increased 6 X by 1994 the productivity had dropped by 20 -50%.
3. Overtapped Rivers The Aral Sea, Kazakhstan: - salt and dust in air became a significant health problem 1989 2014
3. Overtapped Rivers Other Problems of "overtapping" rivers. . . 1. Reduced water availability 2. Salinized soils (20% worldwide) 3. Regional Conflicts - The Jordan River (Jordan and Israel) - The Indus (India and Pakistan) - The Ganges (India and Bangladesh) - The Colorado: Colorado, Utah, Arizona, Nevada, California
Water Confict Events per Year, 1927– 2015 Peter H. Gleick Science 2016; 354: 555 -556 Published by AAAS
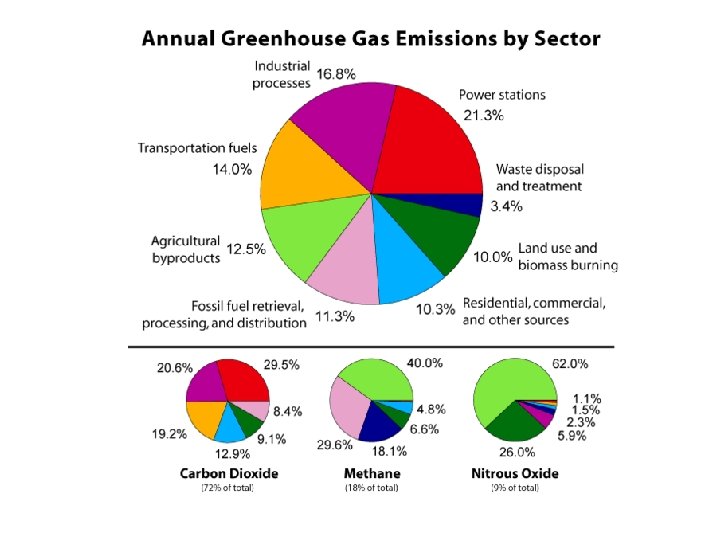
III. BIOGEOCHEMICAL CYCLES A. Overview B. The Water Cycle C. The Carbon Cycle 1. OVERVIEW
RESERVOIRS: Most atmospheric carbon has been transferred to the hydrosphere (dissolved CO 2) and lithosphere (limestone and fossil deposits). Dead and dissolved organic matter are other large reservoirs The atmosphere and biosphere have some, too. reservoirs in gigatons and exchanges in GT/year
FLUXES: Flux between hydro and atmo is still a major exchange reservoirs in gigatons and exchanges in GT/year
FLUXES: Photosynthesis balances respiration Volcanism balances by sedimentation and deposition Net transfer to atmosphere is by burning of fossil fuels (7 GT) and reduction of photosynthesis by forests from deforestation (1 GT) reservoirs in gigatons and exchanges in GT/year
- last 160, 000 years (ice cores) 416 280
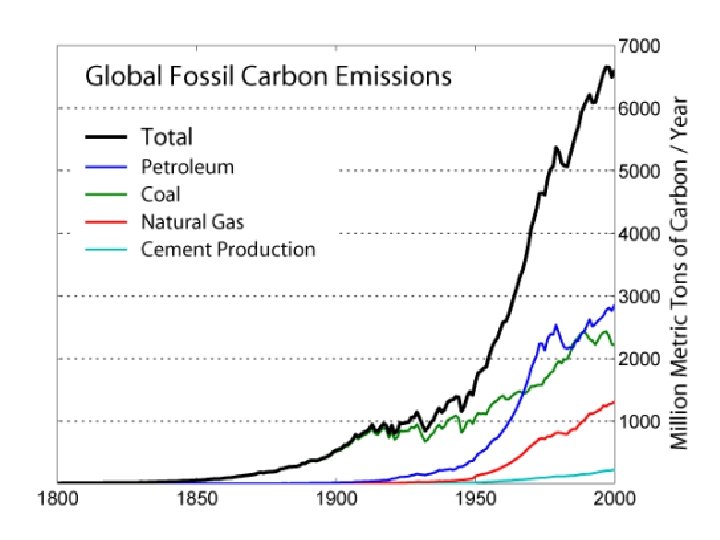
- Since 1000: up 43% (all since 1760 – Industrial Revolution)
- Since 1955: 318 to 402. 24 (Sept 5, 2016) – 26%
- Ocean absorption and acidification
III. BIOGEOCHEMICAL CYCLES A. Overview B. The Water Cycle C. The Carbon Cycle 1. OVERVIEW 2. Change in CO 2 3. Consequences – Global warming
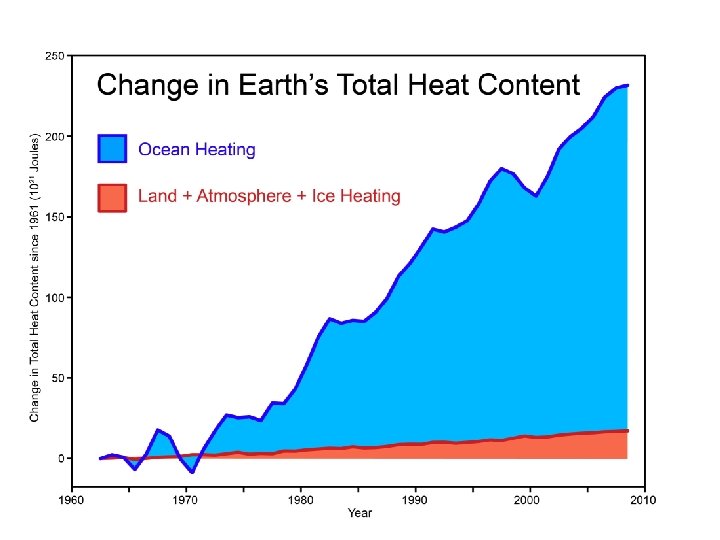
2. Since 1860 – increase of 0. 8 o. C – ten hottest years all since 1998 2015 – hottest by the greatest margin; 2016 on pace to be hotter The last 5 years, 2014 -2019, are the top 5 hottest on record
Most heat is absorbed by ocean
III. BIOGEOCHEMICAL CYCLES A. Overview B. The Water Cycle C. The Carbon Cycle 1. OVERVIEW 2. Change in CO 2 3. Consequences – Global warming 4. Correlates
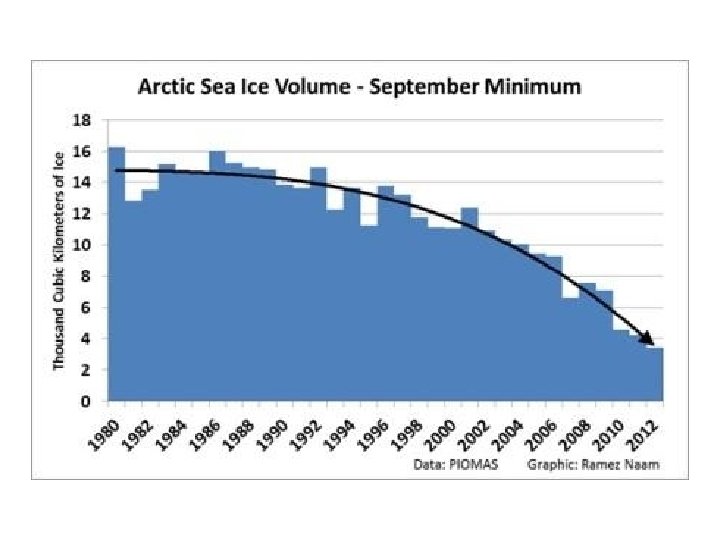
-Reductions in Polar Ice (area covered) 1979 Nasa. gov 2012
Summer 2012 – Record low summer sea ice
- Reductions in polar ice - Reductions in glacial ice
- Reductions in polar ice - Reductions in glacial ice - Sea level rise
- Increases in Sea Level
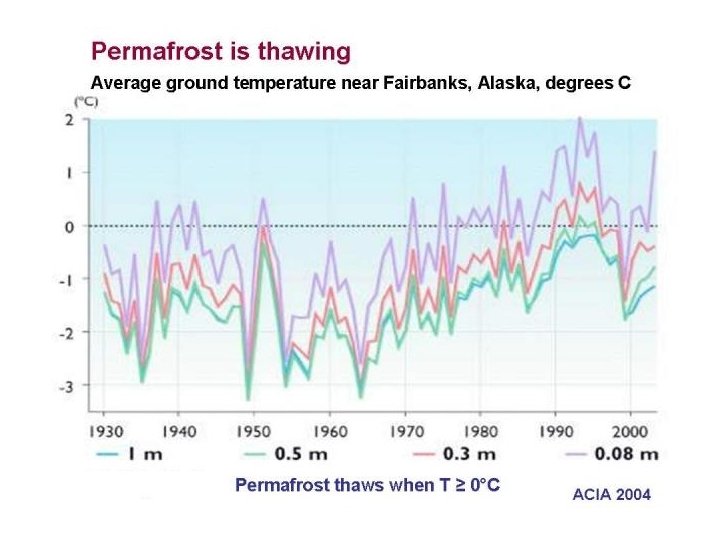
- Reductions in polar ice Reductions in glacial ice Sea level rise Melting of Permafrost 14% of the world’s organic carbon is stored in permafrost. As the poles warm (and they are warming faster than anywhere else), this carbon may be mobilized as decomposing bacteria gear up…. This is a type of threshold response (not a gradual response), and would involve positive feedback loops…
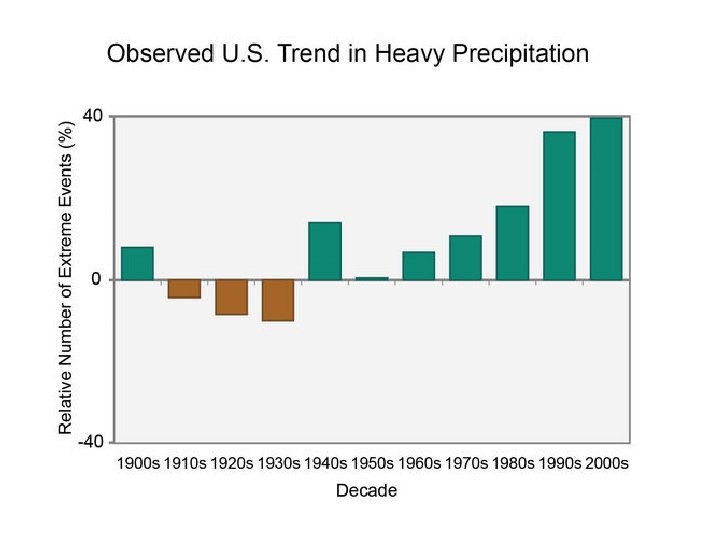
- More big storms:
- Reductions in polar ice Reductions in glacial ice Sea level rise Melting of Permafrost Stronger Storms Effects on the Biosphere - Changes in Plant Growth: Qualitative Effects: Laurance et al. (March 2004, Nature): - Pristine rainforests have changed composition in last 20 years, with an increase in fast-growing species and a decrease in slow growing species… probably as a result of increased CO 2 availability.
- Reductions in polar ice Reductions in glacial ice Sea level rise Melting of Permafrost Stronger Storms Effects on the Biosphere -Changes in Reef Communities: “Almost 15% of the world's reefs are already beyond repair thanks to global warming. Another 30% may be lost over the next 30 years. ” – (Nature, February 2004) - Reefs are home to 25% of all marine species - Reefs are nursery areas for the larvae and fry of commercially important fish and crustacean species - Reefs are important storm breaks for tropical coasts
- Reductions in polar ice Reductions in glacial ice Sea level rise Melting of Permafrost Stronger Storms Effects on the Biosphere - Changes in Species Diversity 15 -37% of terrestrial species may go extinct in the next 50 years, largely because of global warming. (Thomas et al. 2004)
- Reductions in polar ice Reductions in glacial ice Sea level rise Melting of Permafrost Stronger Storms Effects on the Biosphere - Increases in Human Diseases: UN Environmental Programme Report, Feb 21, 2005: - Environmental change may be the cause of the resurgence of some infectious diseases. - The fatal Nipah virus, normally found in Asian fruit bats, is believed to have crossed over to humans as the bats lost their habitats through forest fires in Sumatra and the clearance of land for palm plantations.
III. BIOGEOCHEMICAL CYCLES A. Overview B. The Water Cycle C. The Carbon Cycle 1. OVERVIEW 2. Change in CO 2 3. Consequences – Global warming 4. Correlates 5. Perspectives IPCC 2015 Report: “It is extremely likely that human influence on climate caused more than half of the observed increase in global average surface temperature from 1951 to 2010. There is high confidence that this has warmed the ocean, melted snow and ice, raised global mean sea level and changed some climate extremes in the second half of the 20 th century. ”
Ecosystem Ecology III. Productivity, Diversity, and Stability
A. Productivity 1. Gross Primary Productivity Total photosynthetic productivity; CO 2 + H 20 -----> Glucose + O 2
A. Productivity 2. Net Primary Productivity NPP = GPP - respiration (Plants use some of the energy they absorb; it is not stored as biomass. NPP is only the amount stored as new biomass. )
B. Diversity - Relationships with Productivity 1. Productivity increases diversity - bottom-up qualitative and quantitative effects
B. Diversity - Relationships with Productivity 1. Productivity increases diversity 2. Diversity increases productivity
- Sampling Effects More diverse communities are more likely to contain the most productive species, and thus raise the total productivity.
- Niche Complementarity More diverse communities are more likely to contain different types of species that use different types of energy. . . thus more efficiently harvesting the available energy
Diversity and Productivity in a Long-Term Grassland Experiment Tilman, et al. 2001. Science 294. 843 - 845 Cedar Creek Ecosystem Science Reserve - 168 9 m x 9 m plots - 1, 2, 4, 8, or 16 species randomly chosen from a pool of 18 species: 4 species, each, of C 4 grasses, C 3 grasses, legumes, non-legume forbs; 2 species of woody plants. - ~35 replicates of each treatment
Diversity and Productivity in a Long-Term Grassland Experiment Tilman, et al. 2001. Science 294. 843 - 845 Dotted line is biomass in a monoculture of the most productive species. Higher productivity than this, at higher richness values, means niche complementarity or positive effects must be occurring.
Diversity and Productivity in a Long-Term Grassland Experiment Tilman, et al. 2001. Science 294. 843 - 845 Dotted line is biomass in a monoculture of the most productive species. Higher productivity than this, at higher richness values, means niche complementarity or positive effects must be occurring. So, many random assemblages of multiple species have biomass above that of the most abundant monoculture (can’t just be sampling effect).
Diversity and Productivity in a Long-Term Grassland Experiment Tilman, et al. 2001. Science 294. 843 - 845 Dotted line is biomass in a monoculture of the most productive species. Higher productivity than this, at higher richness values, means niche complementarity or positive effects must be occurring. So, many random assemblages of multiple species have biomass above that of the most abundant monoculture. And we might expect greater niche complementa rity in natural systems…
Additional Experiments and Results: - Foliar fungal disease incidence decreased at higher diversity because of greater distance between individuals of a species, and resultant lower rates of disease spread (Mitchell et al. 2002). (“Dilution Effect”) - Greater plant diversity led to greater abundance and diversity of herbivorous insects, and this effect continued up the food web to predator and parasitoid insects (Haddad et al. 2001). (“Qualitative Effects of Diversity”)
Additional Experiments and Results: - Fewer novel plant species invaded higher diversity treatments because of their lower soil NO 3 levels, greater neighborhood crowding and competition, and greater chance that functionally similar species would occur in a given neighborhood (Figs 3; Naeem et al. 2000, Kennedy et al. 2002, Fargione et al. 2003, Fargione and Tilman 2005 a, 2005 b). Greater plant species numbers led to greater ecosystem stability (lower year-to-year variation in total plant biomass) but to lower species stability (greater year-to-year variation in abundances of individual species), with the stabilizing effect of diversity mainly attributable to statistical averaging effects and overyielding effects (Fig 4; Tilman et al, submitted). Data gathered this past field season shows that soil total C has now become an increasing function of plant species numbers (Fig 5).
Additional Experiments and Results: - Greater plant species numbers led to greater ecosystem stability (lower year-toyear variation in total plant biomass) but to lower species stability (greater year-to-year variation in abundances of individual species).
Additional Experiments and Results: - Stored soil carbon increases with diversity.
- Effects of Genetic Diversity Example Crutsinger, et al. 2006. Science 313: 966 -968. Methods: - 63 1 m 2 plots, each containing 12 plants of all goldenrod. - The plants in a plot represent either 1, 3, 6, or 12 genotypes, randomly selected from a pool of 21 genotypes.
- Example Crutsinger, et al. 2006. Science 313: 966 -968. Results: 1: ANPP correlated with number of genotypes in plot.
- Example Crutsinger, et al. 2006. Science 313: 966 -968. Results: 1: ANPP correlated with number of genotypes in plot. 2: Total insect species diversity, and diversity of herbivores and predators, correlate with ANPP and number of genotypes per plot.
C. Effects on Stability
C. Effects on Stability 1. Types - "resistance to change" - "resilience after change"
C. Effects on Stability 1. Types 2. Relationships with diversity - more diverse communities are less susceptible to single "types of disturbance" - (a pest, a flood, a drought) - because the many species are unlikely to be sensitive to the same thing.
C. Effects on Stability Biodiversity and Ecosystem Functioning: Current Knowledge and Future Challenges. Loreau, et al. 2001. Science 294: 804 - 808 As richness increases, productivity become less variable (more stable).
C. Stability 1. Types 2. Relationships with diversity - diverse communities may recover more rapidly, too (resilience). . but they may not. Fisheries. . . yes Rain forest. . . maybe not
Stimulate condensation and precipitation Volatiles released Rainforests feed themselves and water themselves. Decomposition rapid Absorption rapid
CUT FOREST DOWN Select for fire-adapted grasses. . rainforest doesn't come back. . Nutrient runoff… then reduced rainfall INCREASE FIRE
RAINFOREST (wet, few fires) "Multiple Stable States" GRASSLAND (dry, many fires)
We are dependent on the environment for food and resources. Ideally, we would like a STABLE, PRODUCTIVE supply of these resources. . right? ? FEAST FAMINE
(We don't want "boom and bust", "feast and famine" scenarios. . ) FEAST FAMINE
We are dependent on the environment for food and resources. Ideally, we would like a STABLE, PRODUCTIVE supply of these resources. . right? ? (We don't want "boom and bust", "feast and famine" scenarios. . ) ? STABILITY PRODUCTIVITY
We are playing jenga with our life support systems. . . de Ruiter et al. 2005. Food Web Ecology: Playing Jenga and Beyond Science 309: 68 - 71
Simple Predictable Realistic?
Realistic Complex Predictable?