Ecosystem Ecology Ecosystem Ecology I Introduction Ecosystem an


 between “reservoirs”")
 between “reservoirs” - matter")


")


")


 = 224 billion tons. 59% is terrestrial,")
- Slides: 55
Ecosystem Ecology
Ecosystem Ecology I. Introduction - Ecosystem: an assemblage of organisms, together with their chemical and physical environments
Ecosystem Ecology I. Introduction - “Box Models” of Exchanges (“fluxes”) between “reservoirs”
Ecosystem Ecology I. Introduction - “Box Models” of Exchanges (“fluxes”) between “reservoirs” - matter (of a type: C, H 2 O, N, P) or energy
Ecosystem Ecology I. Introduction II. Energy Flow
Ecosystem Ecology I. Introduction II. Energy Flow A. Productivity 1. Gross Primary Productivity Total photosynthetic productivity: CO 2 + H 20 -----> Glucose + O 2
Ecosystem Ecology I. Introduction II. Energy Flow A. Productivity 1. Gross Primary Productivity Total photosynthetic productivity: CO 2 + H 20 -----> Glucose + O 2 Metabolism Growth Reproduction
Ecosystem Ecology I. Introduction II. Energy Flow A. Productivity 1. Gross Primary Productivity Total photosynthetic productivity: CO 2 + H 20 -----> Glucose + O 2
Ecosystem Ecology I. Introduction II. Energy Flow A. Productivity 2. Net Primary Productivity: - energy stored in biomass
Ecosystem Ecology I. Introduction II. Energy Flow A. Productivity 2. Net Primary Productivity: - energy stored in biomass - measurements
Ecosystem Ecology I. Introduction II. Energy Flow A. Productivity 2. Net Primary Productivity: - energy stored in biomass - measurements - factors affecting NPP
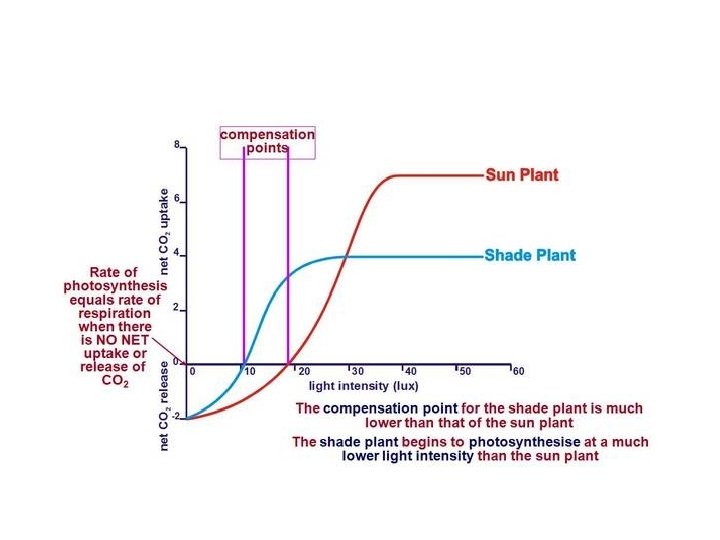
Ecosystem Ecology I. Introduction II. Energy Flow A. Productivity 2. Net Primary Productivity: - energy stored in biomass - measurements - factors affecting NPP - light
In aquatic systems, water filters light energy…so there is a given “depth” at a given time of day, for a given type of organism, at which R = GPP; NPP = 0)
Ecosystem Ecology I. Introduction II. Energy Flow A. Productivity 2. Net Primary Productivity: - energy stored in biomass - measurements - factors affecting NPP - light - water
Ecosystem Ecology I. Introduction II. Energy Flow A. Productivity 2. Net Primary Productivity: - energy stored in biomass - measurements - factors affecting NPP - light - water - temp
Ecosystem Ecology I. Introduction II. Energy Flow A. Productivity 2. Net Primary Productivity: - energy stored in biomass - measurements - factors affecting NPP - light - water - temp - nutrients
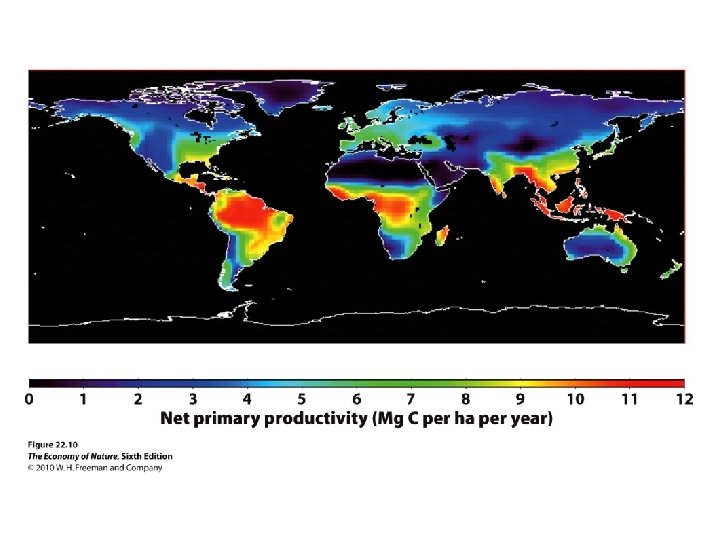
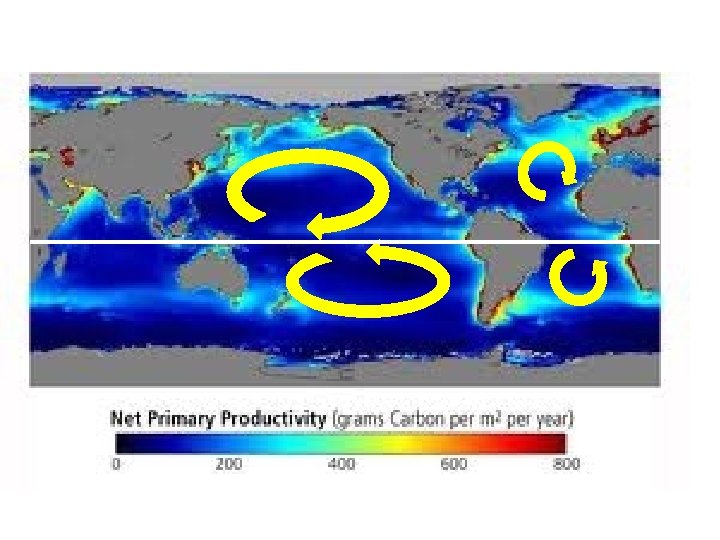
2. Net Primary Productivity: - energy stored in biomass - measurements - factors affecting NPP - light - water - temp - nutrients - Global Patterns
2. Net Primary Productivity: - energy stored in biomass - measurements - factors affecting NPP - light - water - temp - nutrients - Global Patterns
Annual Cycle in Global Productivity
Ecosystem Ecology I. Introduction II. Energy Flow A. Productivity 3. Net Secondary Productivity - assimilations efficiencies – A/I carnivores: 80 -90% (no cell walls to deal with)
Ecosystem Ecology I. Introduction II. Energy Flow A. Productivity 3. Net Secondary Productivity - assimilations efficiencies – A/I carnivores: 80 -90% seed eaters: 60 -80% herbivores grazers (leaf-eaters): 60 -70% browsers (woody twigs and buds): 30 -40%
Ecosystem Ecology I. Introduction II. Energy Flow A. Productivity 3. Net Secondary Productivity - assimilations efficiencies – A/I carnivores: 80 -90% seed eaters: 60 -80% herbivores grazers (leaf-eaters): 60 -70% browsers (woody twigs and buds): 30 -40% detritivores: 15%
Low AE? Must eat more to get energy needed. Horse – ‘hindgut ruminant’ – less efficient, high throughput Cattle – ‘foregut ruminant’ – more efficient, can eat less.
Ecosystem Ecology I. Introduction II. Energy Flow A. Productivity 3. Net Secondary Productivity - Net Production Efficiency = P/A
NSP What might this depend on? ? ? NPP
Ecosystem Ecology I. Introduction II. Energy Flow 0. 5% Birds Depends on respiratory (metabolic) costs. A. Productivity 0. 7% Shrews 3. Net Secondary Productivity - net production efficiency = P/A 6 -10% Most Mammals Up to 75% for sedentary poikilotherms
Ecosystem Ecology I. Introduction II. Energy Flow A. Productivity B. Trophic Pyramids
Ecosystem Ecology I. Introduction II. Energy Flow A. Productivity B. Trophic Pyramids - ecological efficiency: NSP/NPP (5 -20%) Loss due to 2 nd Law NPP of Secondary Carnivores NPP of Primary Carnivores NPP of HERBIVORES NPP of Producers (PLANTS)
a. trophic "pyramids" This is why large carnivores are RARE, and why they have large RANGES Loss due to 2 nd Law NPP of Secondary Carnivores NPP of Primary Carnivores NPP of HERBIVORES NPP of Producers (PLANTS)
Ecosystem Ecology I. Introduction II. Energy Flow A. Productivity B. Trophic Pyramids C. Detrital Foodchains Predators Herbivores
Ecosystem Ecology I. Introduction II. Energy Flow A. Productivity B. Trophic Pyramids C. Detrital Foodchains Detritivores NPP Herbivores Temperate forest: 1. 5% - 2. 5% Old-field Habitat: 12% Open Ocean (Plankton): 60 -99%
Ecosystem Ecology I. Introduction II. Energy Flow A. Productivity B. Trophic Pyramids C. Detrital Foodchains D. Human Concerns
E. Human Concerns April 10, 2020: 7. 7 billion
E. Human Concerns: NPP
E. Human Concerns: NPP
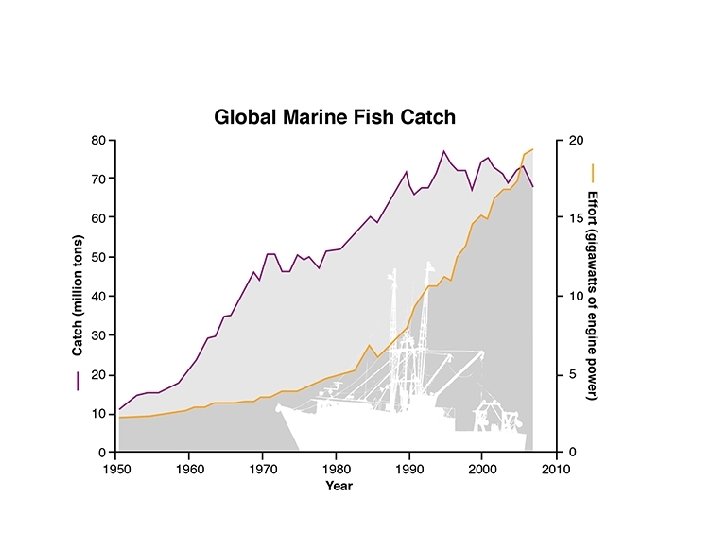
E. Human Concerns 500% increase in 50 years, with population increase of 250%
E. Human Concerns A doubling of meat production per capita
E. Human Concerns 25% of catch by weight discarded
E. Human Concerns
E. Human Concerns 6 -10 lbs of feed for 1 lb increase in cattle weight 2 -5 lbs of fish meal for 1 lb increase in farmed fish weight
E. Human Concerns Edible kilocalories produced from kilocalories of energy required for cultivation are: 18. 1% for chicken, 6. 7% for grass-fed beef, 5. 7% for farmed salmon 0. 9% for shrimp. 123% for potatoes 250% for corn 415% for soy input calories converted to calories able to be utilized by humans So, for every 100 calories of energy we put in to raise chickens, we get 18 calories of energy produced in chicken meat. 100 cal into soy, 415 calories out.
E. Human Concerns Food production, per capita (400 kg per year is healthy minimum)
SO HOW DID WE DO IT?
E. Human Concerns EXTENSIFICATION – MORE AREA
E. Human Concerns EXTENSIFICATION – MORE AREA
E. Human Concerns The best land has already been used; further expansion in marginal areas is costly and requires more supplementation
E. Human Concerns 47% of historical forested land has been converted 21% is ‘virgin forest’
E. Human Concerns INTENSIFICATION – yield=kg/m 2 area
E. Human Concerns
E. Human Concerns The best land has already been used; further expansion in marginal areas is costly and requires more supplementation. Also, degraded soils require supplementation
E. Human Concerns Global NPP (dry mass) = 224 billion tons. 59% is terrestrial, and of this, 35 -40% is controlled by humans, either eaten directly or fed to animals we will consume 1 species 10 -30 million species