
Economics of Crop Livestock Production Agribusiness Showcase Conference
Economics of Crop & Livestock Production Agribusiness Showcase & Conference Des Moines, Iowa Feb. 10, 2015 Chad Hart Associate Professor/Crop Markets Specialist chart@iastate. edu 515 -294 -9911 Extension and Outreach/Department of Economics
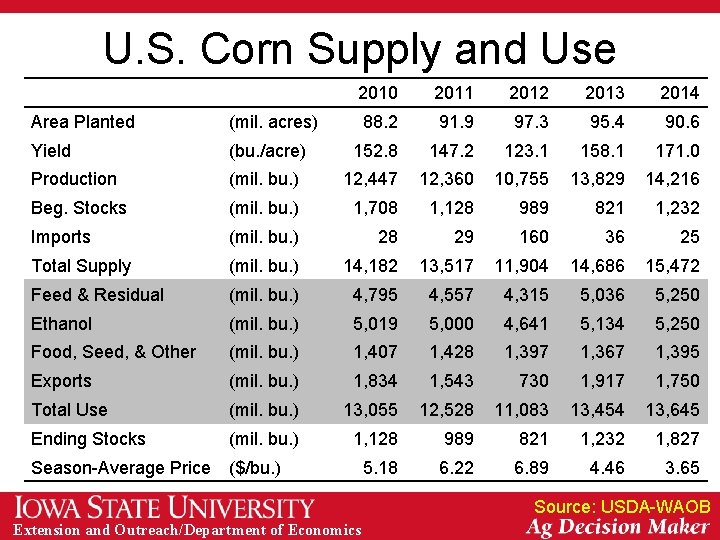
U. S. Corn Supply and Use 2010 2011 2012 2013 2014 88. 2 91. 9 97. 3 95. 4 90. 6 Area Planted (mil. acres) Yield (bu. /acre) 152. 8 147. 2 123. 1 158. 1 171. 0 Production (mil. bu. ) 12, 447 12, 360 10, 755 13, 829 14, 216 Beg. Stocks (mil. bu. ) 1, 708 1, 128 989 821 1, 232 Imports (mil. bu. ) 28 29 160 36 25 Total Supply (mil. bu. ) 14, 182 13, 517 11, 904 14, 686 15, 472 Feed & Residual (mil. bu. ) 4, 795 4, 557 4, 315 5, 036 5, 250 Ethanol (mil. bu. ) 5, 019 5, 000 4, 641 5, 134 5, 250 Food, Seed, & Other (mil. bu. ) 1, 407 1, 428 1, 397 1, 367 1, 395 Exports (mil. bu. ) 1, 834 1, 543 730 1, 917 1, 750 Total Use (mil. bu. ) 13, 055 12, 528 11, 083 13, 454 13, 645 Ending Stocks (mil. bu. ) 1, 128 989 821 1, 232 1, 827 5. 18 6. 22 6. 89 4. 46 3. 65 Season-Average Price ($/bu. ) Source: USDA-WAOB Extension and Outreach/Department of Economics
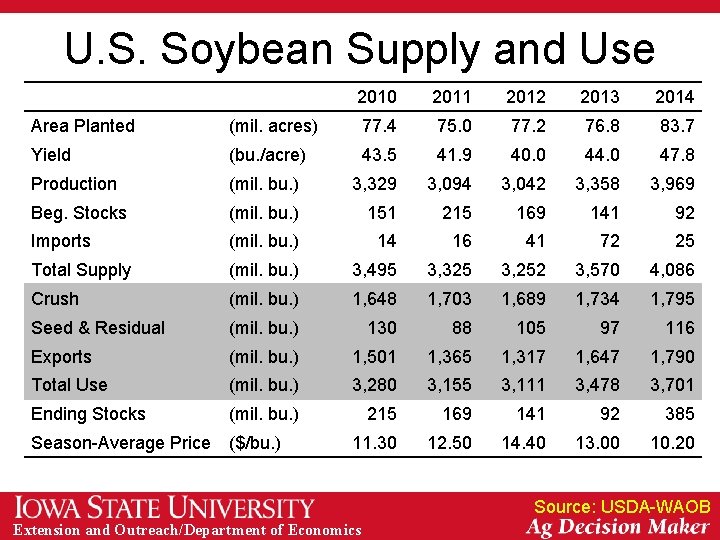
U. S. Soybean Supply and Use 2010 2011 2012 2013 2014 Area Planted (mil. acres) 77. 4 75. 0 77. 2 76. 8 83. 7 Yield (bu. /acre) 43. 5 41. 9 40. 0 44. 0 47. 8 Production (mil. bu. ) 3, 329 3, 094 3, 042 3, 358 3, 969 Beg. Stocks (mil. bu. ) 151 215 169 141 92 Imports (mil. bu. ) 14 16 41 72 25 Total Supply (mil. bu. ) 3, 495 3, 325 3, 252 3, 570 4, 086 Crush (mil. bu. ) 1, 648 1, 703 1, 689 1, 734 1, 795 Seed & Residual (mil. bu. ) 130 88 105 97 116 Exports (mil. bu. ) 1, 501 1, 365 1, 317 1, 647 1, 790 Total Use (mil. bu. ) 3, 280 3, 155 3, 111 3, 478 3, 701 Ending Stocks (mil. bu. ) 215 169 141 92 385 11. 30 12. 50 14. 40 13. 00 10. 20 Season-Average Price ($/bu. ) Source: USDA-WAOB Extension and Outreach/Department of Economics
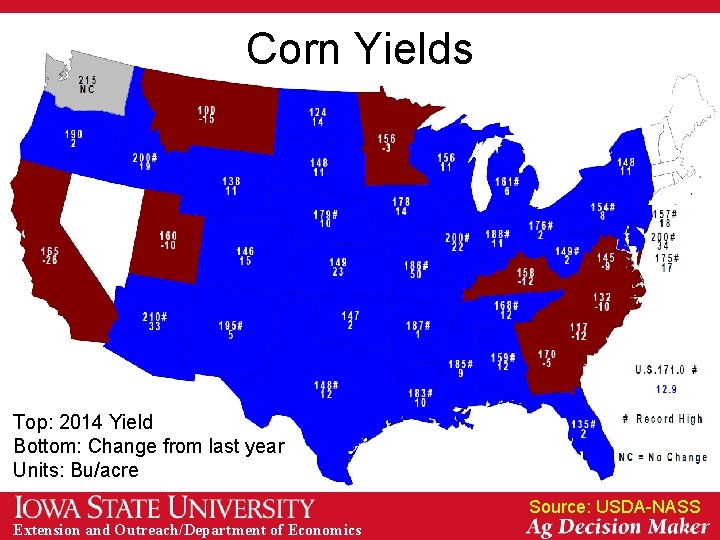
Corn Yields Top: 2014 Yield Bottom: Change from last year Units: Bu/acre Source: USDA-NASS Extension and Outreach/Department of Economics
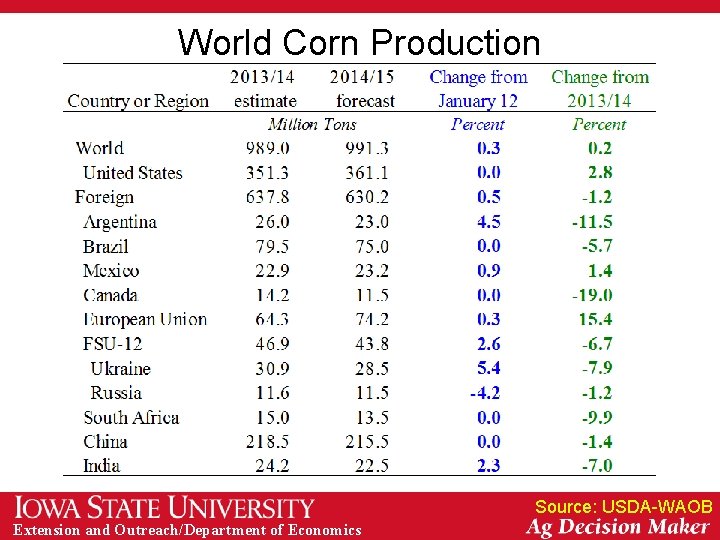
World Corn Production Source: USDA-WAOB Extension and Outreach/Department of Economics
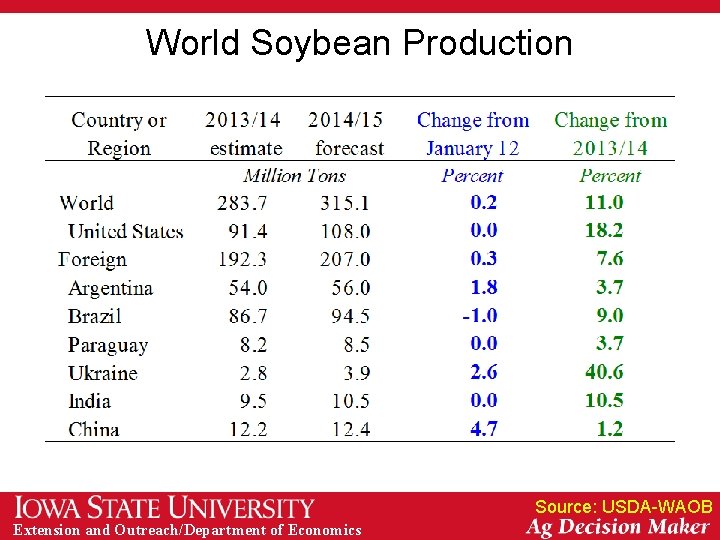
World Soybean Production Source: USDA-WAOB Extension and Outreach/Department of Economics
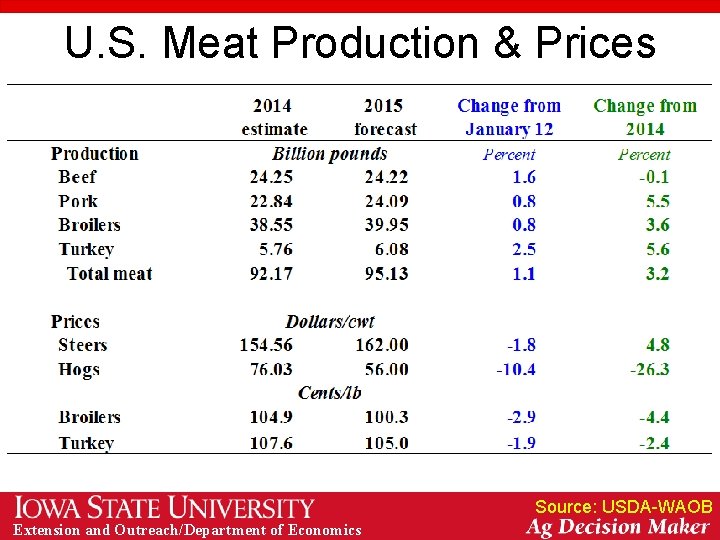
U. S. Meat Production & Prices Source: USDA-WAOB Extension and Outreach/Department of Economics
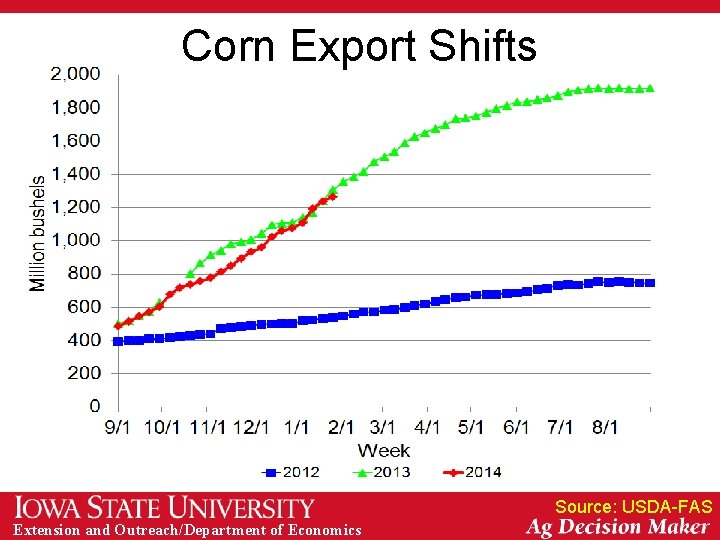
Corn Export Shifts Source: USDA-FAS Extension and Outreach/Department of Economics
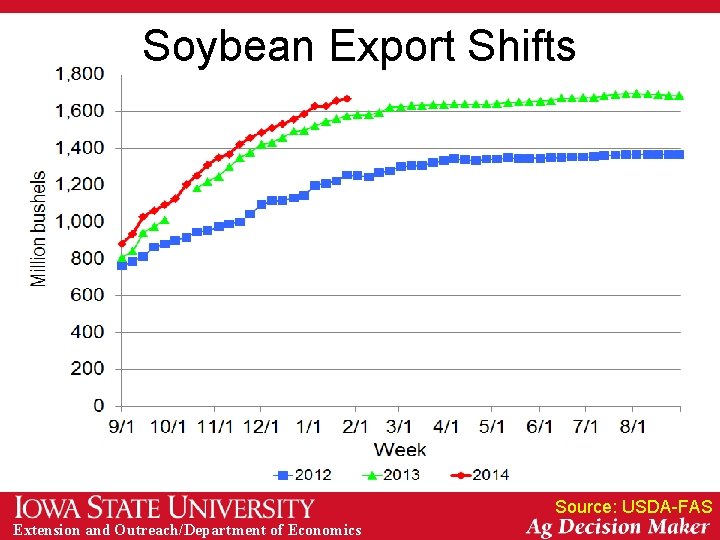
Soybean Export Shifts Source: USDA-FAS Extension and Outreach/Department of Economics
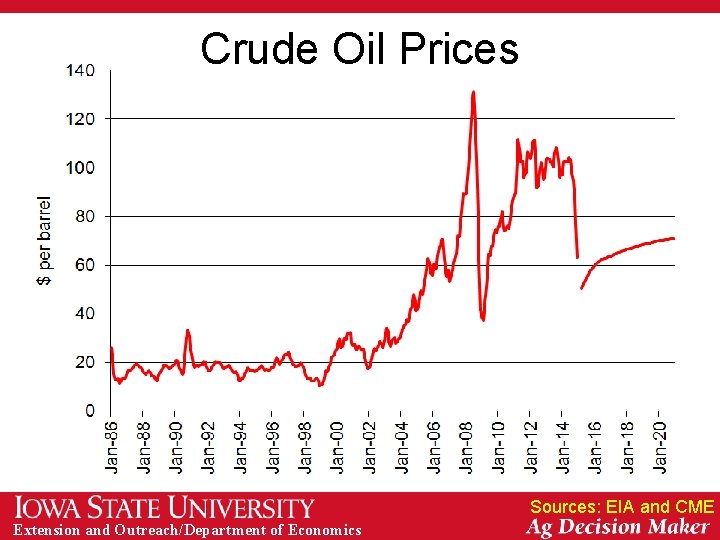
Crude Oil Prices Sources: EIA and CME Extension and Outreach/Department of Economics
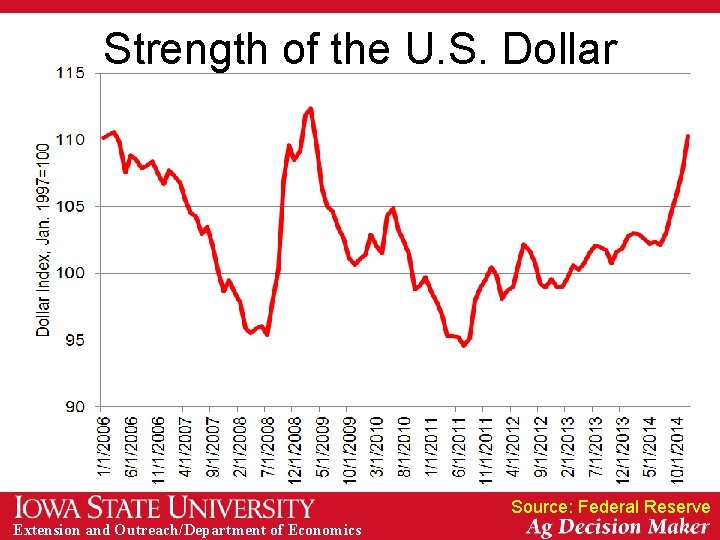
Strength of the U. S. Dollar Source: Federal Reserve Extension and Outreach/Department of Economics
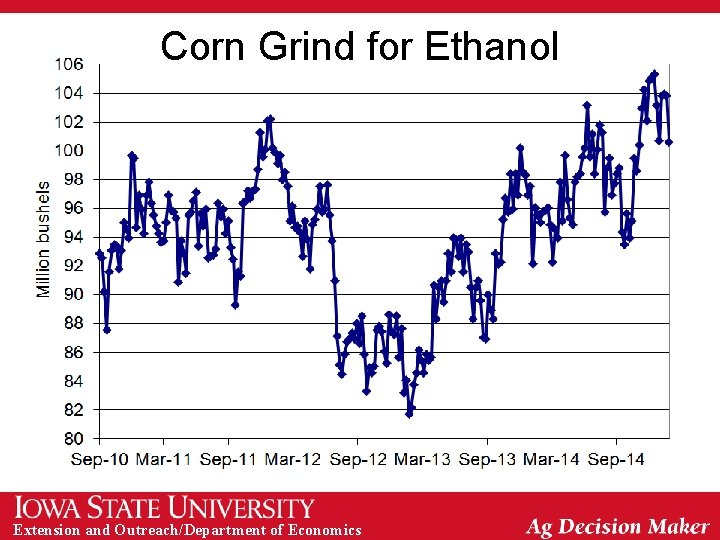
Corn Grind for Ethanol Extension and Outreach/Department of Economics
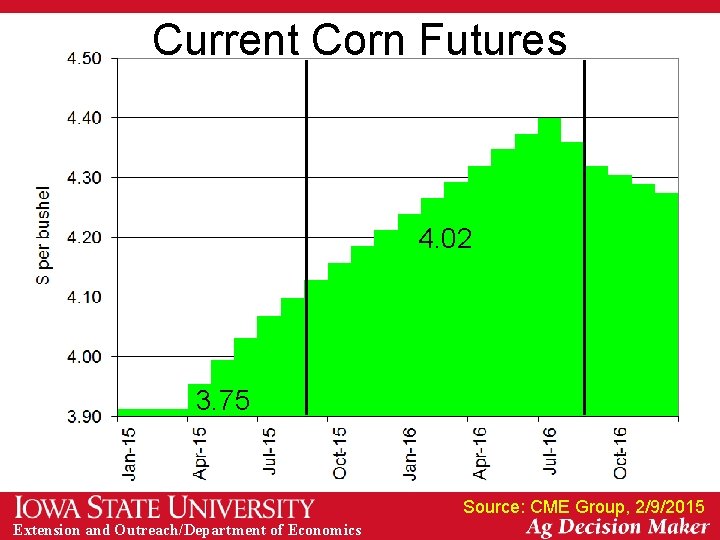
Current Corn Futures 4. 02 3. 75 Source: CME Group, 2/9/2015 Extension and Outreach/Department of Economics
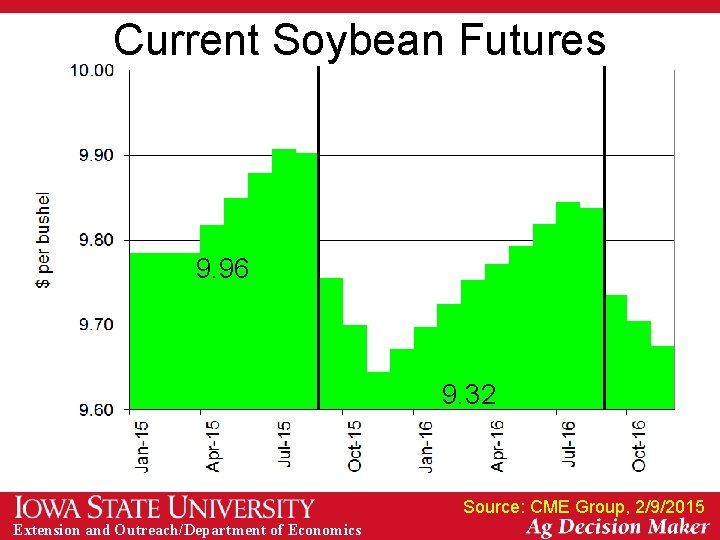
Current Soybean Futures 9. 96 9. 32 Source: CME Group, 2/9/2015 Extension and Outreach/Department of Economics
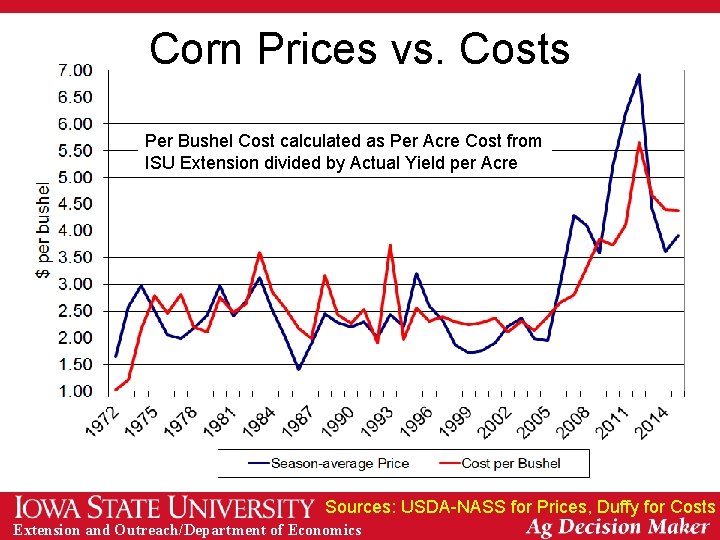
Corn Prices vs. Costs Per Bushel Cost calculated as Per Acre Cost from ISU Extension divided by Actual Yield per Acre Sources: USDA-NASS for Prices, Duffy for Costs Extension and Outreach/Department of Economics
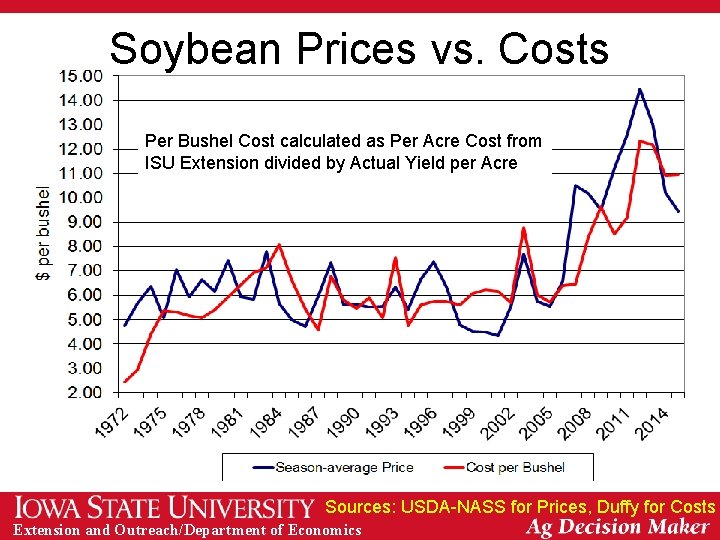
Soybean Prices vs. Costs Per Bushel Cost calculated as Per Acre Cost from ISU Extension divided by Actual Yield per Acre Sources: USDA-NASS for Prices, Duffy for Costs Extension and Outreach/Department of Economics
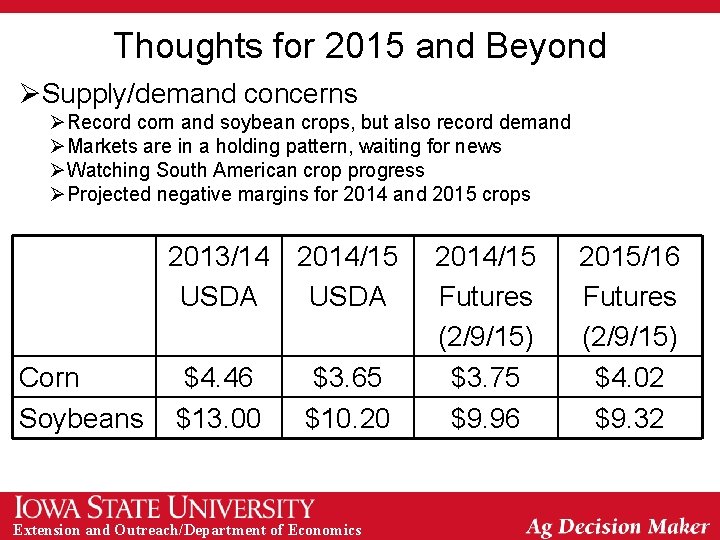
Thoughts for 2015 and Beyond ØSupply/demand concerns ØRecord corn and soybean crops, but also record demand ØMarkets are in a holding pattern, waiting for news ØWatching South American crop progress ØProjected negative margins for 2014 and 2015 crops 2013/14 2014/15 USDA Corn Soybeans $4. 46 $13. 00 $3. 65 $10. 20 Extension and Outreach/Department of Economics 2014/15 Futures (2/9/15) $3. 75 $9. 96 2015/16 Futures (2/9/15) $4. 02 $9. 32
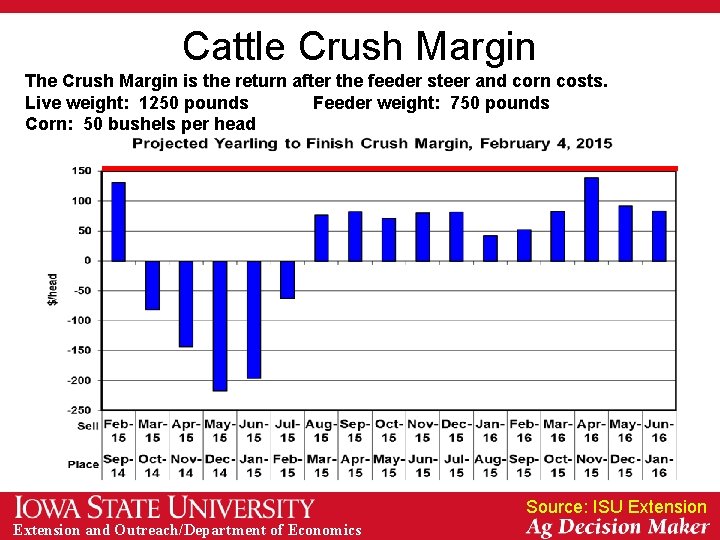
Cattle Crush Margin The Crush Margin is the return after the feeder steer and corn costs. Live weight: 1250 pounds Feeder weight: 750 pounds Corn: 50 bushels per head Source: ISU Extension and Outreach/Department of Economics
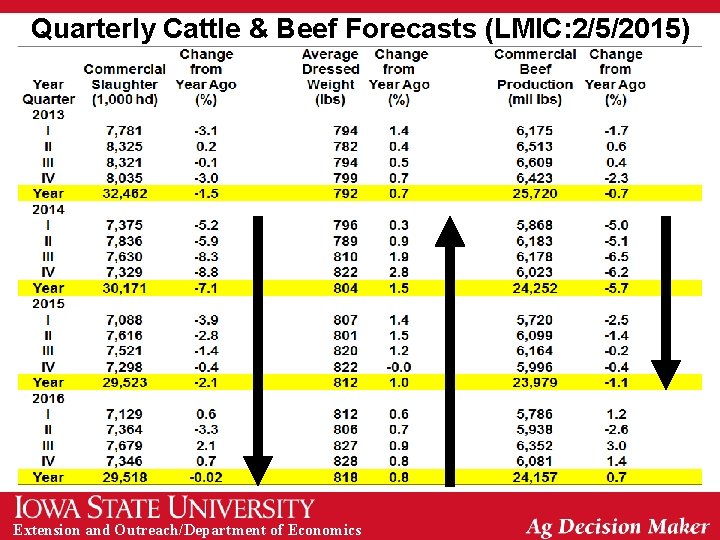
Quarterly Cattle & Beef Forecasts (LMIC: 2/5/2015) Extension and Outreach/Department of Economics
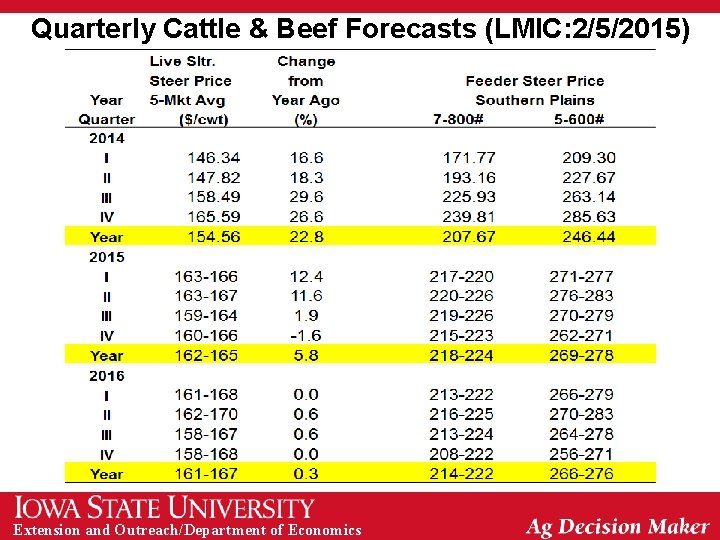
Quarterly Cattle & Beef Forecasts (LMIC: 2/5/2015) Extension and Outreach/Department of Economics
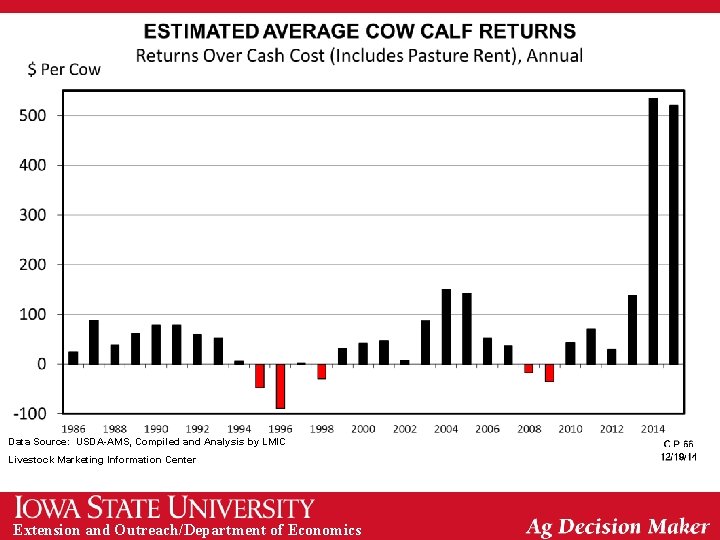
Data Source: USDA-AMS, Compiled and Analysis by LMIC Livestock Marketing Information Center Extension and Outreach/Department of Economics
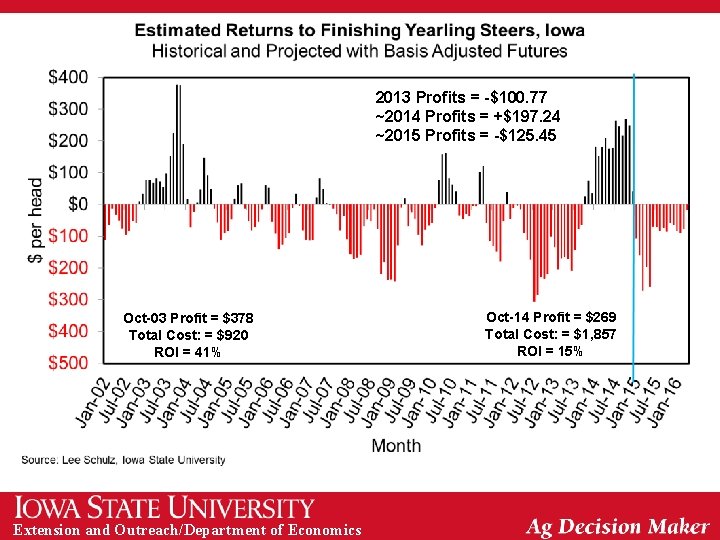
2013 Profits = -$100. 77 ~2014 Profits = +$197. 24 ~2015 Profits = -$125. 45 Oct-03 Profit = $378 Total Cost: = $920 ROI = 41% Extension and Outreach/Department of Economics Oct-14 Profit = $269 Total Cost: = $1, 857 ROI = 15%
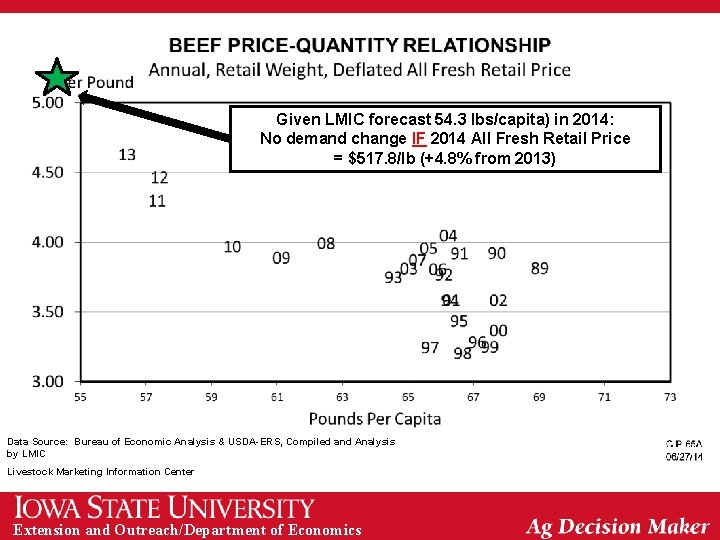
Given LMIC forecast 54. 3 lbs/capita) in 2014: No demand change IF 2014 All Fresh Retail Price = $517. 8/lb (+4. 8% from 2013) Data Source: Bureau of Economic Analysis & USDA-ERS, Compiled and Analysis by LMIC Livestock Marketing Information Center Extension and Outreach/Department of Economics
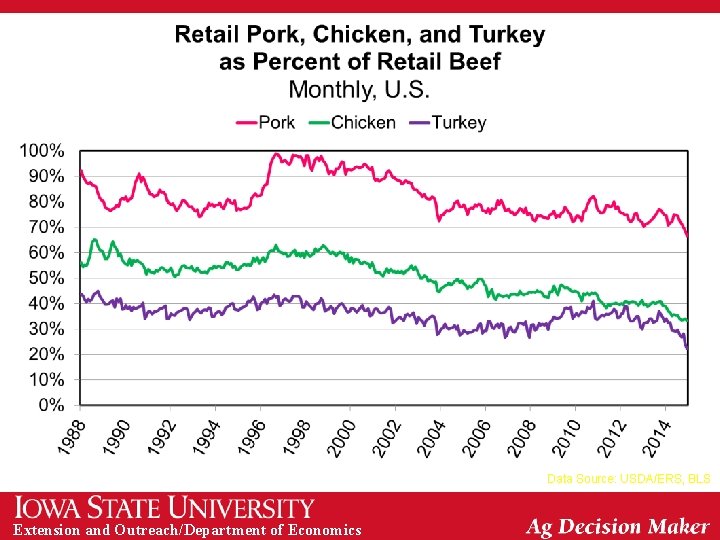
Data Source: USDA/ERS, BLS Extension and Outreach/Department of Economics
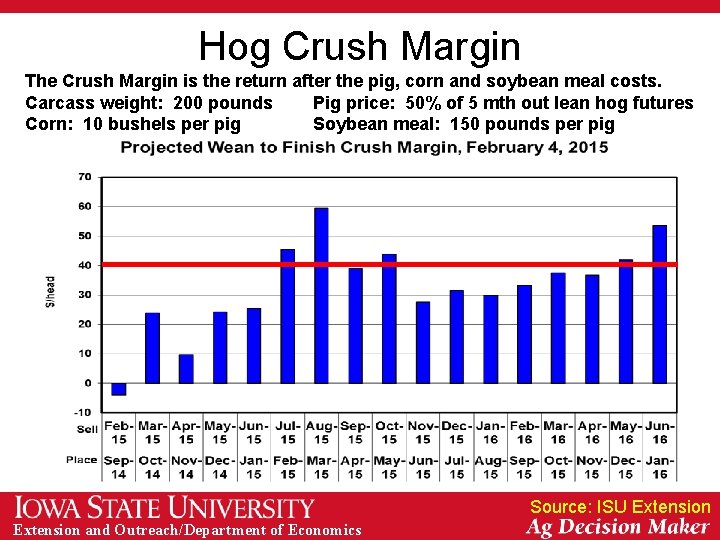
Hog Crush Margin The Crush Margin is the return after the pig, corn and soybean meal costs. Carcass weight: 200 pounds Pig price: 50% of 5 mth out lean hog futures Corn: 10 bushels per pig Soybean meal: 150 pounds per pig Source: ISU Extension and Outreach/Department of Economics
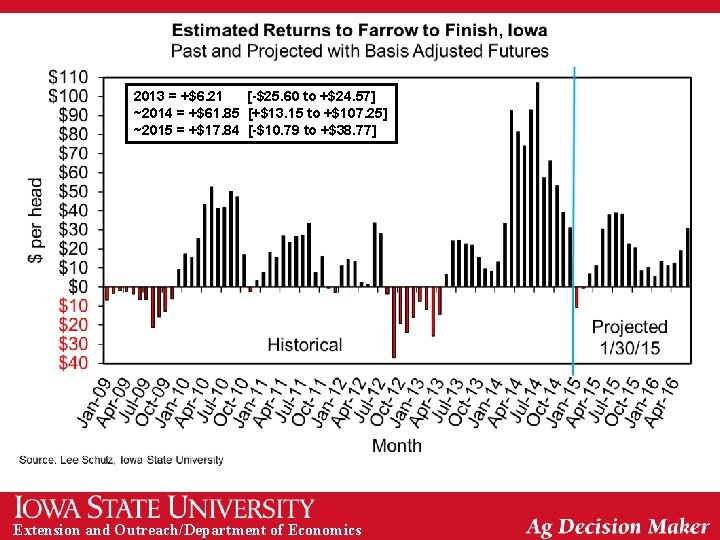
2013 = +$6. 21 [-$25. 60 to +$24. 57] ~2014 = +$61. 85 [+$13. 15 to +$107. 25] ~2015 = +$17. 84 [-$10. 79 to +$38. 77] Extension and Outreach/Department of Economics
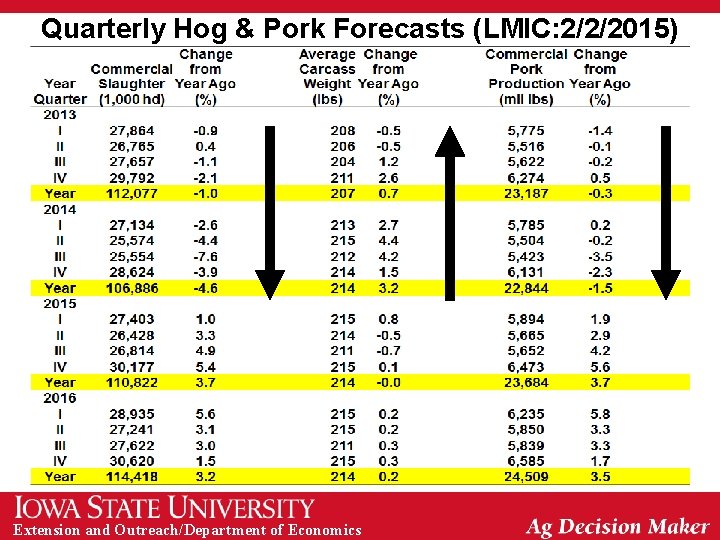
Quarterly Hog & Pork Forecasts (LMIC: 2/2/2015) Extension and Outreach/Department of Economics
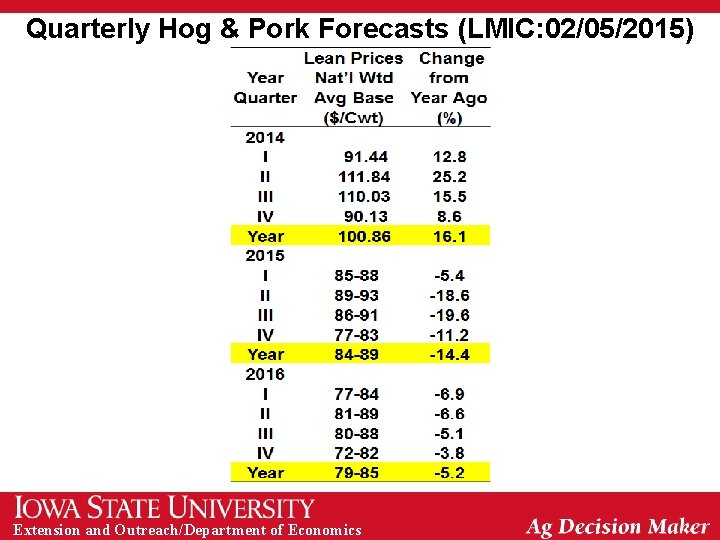
Quarterly Hog & Pork Forecasts (LMIC: 02/05/2015) Extension and Outreach/Department of Economics
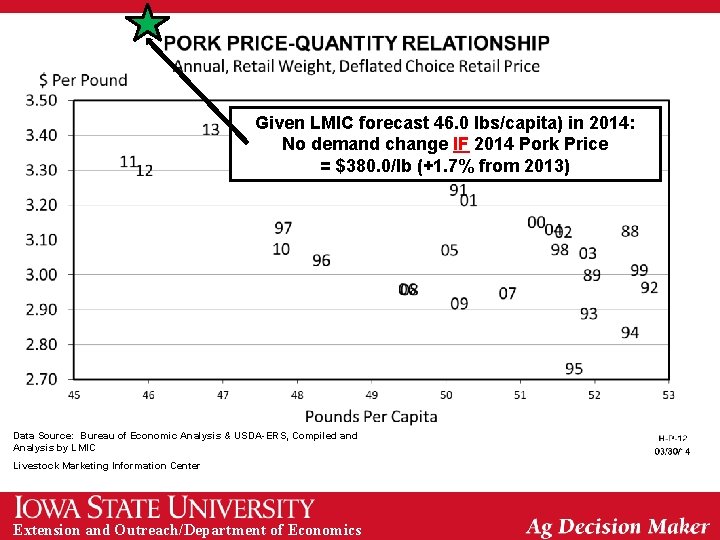
Given LMIC forecast 46. 0 lbs/capita) in 2014: No demand change IF 2014 Pork Price = $380. 0/lb (+1. 7% from 2013) Data Source: Bureau of Economic Analysis & USDA-ERS, Compiled and Analysis by LMIC Livestock Marketing Information Center Extension and Outreach/Department of Economics
Thank you for your time! Any questions? My web site: http: //www. econ. iastate. edu/~chart/ Iowa Farm Outlook: http: //www. econ. iastate. edu/ifo/ Ag Decision Maker: http: //www. extension. iastate. edu/agdm/ Extension and Outreach/Department of Economics
- Slides: 30