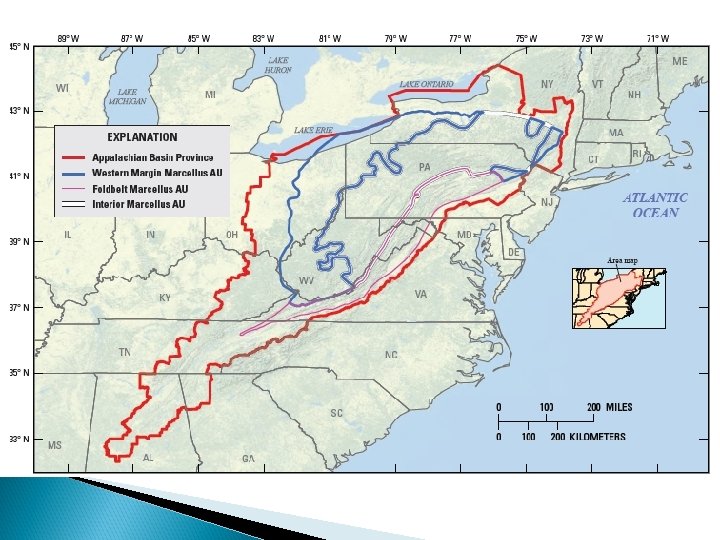
Economics and Water in Delaware and the Delaware

 No Economic")


 (1,")
 1. 2. 3. 4. 5. 6. 7.")
 Pop. (million) GDP/ Capita")


 Net present value (NPV)")


 Tourism – 31,")


- Slides: 35
Economics and Water in Delaware and the Delaware Valley University of Delaware Water Resources Agency Institute for Public Administration
Water 97 -3 -1 Essential for Life Most Precious Chemical (H 20) No Economic Substitute Universal Solvent Exists in Nature as 3 States of Matter
80%
Delaware 1 st State to sign the Constitution 1 Congressman 3 electoral votes 2 nd smallest state 3 counties One of 3 states on a peninsula Lowest state in the U. S. 500 -yr floodplain covers 2/5 of State Wetlands cover 1/3 of State
Delaware 4 basins and 46 watersheds 897, 934 people (US Census 2010) (1, 000 people/sq. mi. ) Landuse (2007) Open Freshwater 3% Marine 8% Urban 15% Ag 39% Wetland 17% Forest 18%
Best Run States (24/7 Wall St. ) 1. 2. 3. 4. 5. 6. 7. 8. 9. 10. 11. North Dakota Wyoming Nebraska Utah Iowa Alaska South Dakota Vermont Virginia Minnesota Delaware 3. 5% unemployment Energy is 30% of GDP 4. 4% unemployment AAA Bond Rating 5. 9% unemployment Budget Deficit = 0 7. 6% tax burden 5. 6% unemployment $62, 000 HH income 92% w. HS diploma AAA Bond Rating
GDP per Capita by State Rank State GDP ($ million) Pop. (million) GDP/ Capita 1 Delaware 62, 700 0. 9 69, 667 2 Alaska 45, 600 0. 7 65, 143 3 Connecticut 233, 400 3. 6 64, 833 4 Wyoming 38, 200 0. 6 63, 667 5 Massachusetts 377, 700 6. 5 58, 108 6 New York 1, 156, 500 19. 4 57, 423 7 New Jersey 497, 000 8. 8 56, 477
GDP Per Capita by Country 1. 2. 3. 4. 5. 6. 7. Luxembourg Quatar Macau Delaware Norway Singapore Kuwait $89, 992 $88, 919 $77, 607 $69, 667 $61, 882 $61, 103 $54, 654
Public Water Use Per Capita State 1. VT 2. ME 3. ND 4. NH 5. WI 6. NC 7. DE 8. RI 9. MN 10. WV 11. NJ Supply 9 0 6 1 9 1, 082 2 6 4 2 1, 037 5 13 7 14 63 10 12 61 22 Pop. Millions 0. 6 1. 3 0. 7 1. 3 5. 7 9. 5 0. 9 1. 1 5. 3 1. 9 8. 8 gpcd 100 109 112 114 115 116 117 118
Delaware, an Economic Engine… Watersheds contribute $2 billion - $6. 7 billion annually to the State’s economy.
Over $6 billion in Economic Activity Largest contributors: Forest and Agriculture: ◦ Ports - $3. 3 billion ◦ Recreation - $2. 4 billion ◦ Over $1. 1 billion Fish/Wildlife, Public Parks, Water Quality and Water Supply: ◦ $344 million – $591 million Flood Control: ◦ $73 million
Delaware Watersheds Economic Value
$6. 7 billion of Ecosystem Goods and Services (per year) Net present value (NPV) - $216. 6 billion Freshwater wetlands – $2. 4 billion Marine - $1. 2 billion Farmland – $1. 7 billion
Delaware Watersheds Ecosystem Goods and Services
Delaware Ecosystem Goods and Services by Basin
Over 70, 000 jobs and $2 billion in wages (per year) Tourism – 31, 050 jobs ($931 million in wages) Farm – 28, 328 jobs ($1. 4 billion in wages) Coastal – 15, 174 jobs ($268 million in wages)
Delaware watersheds provide: 1. Over $6 billion in annual economic activity from water quality, flood control, water supply, fishing and wildlife viewing, recreation, agriculture, ports, forests, and parks. 2. Ecosystem goods and services of $6. 7 billion per year (2010 dollars), net present value (NPV) $216. 6 billion. 3. Over 70, 000 jobs with over $2 billion in wages.
The DRBC was formed by JFK in 1961. DRBC is led by 4 Governors and U. S. Army Corps of Engineers who are Commissioners. The Delaware Basin is governed by 20 Federal agencies, 8 U. S. Senators, 20 Congressmen, 4 states, 24 counties, and over 500 municipalities The Delaware Basin supplies drinking water to 16 million people
America’s Founding Fish
What do these enterprises have in common? Boeing Camelback Ski Area Campbell’s Soup Du. Pont Wawa Keystone Brewpub Crayola Crayons Starbucks Del. Water Gap NRA Philadelphia Eagles New York Yankees Yards Creek Hydro United States Navy Guggenheim Museum
Consumer surplus is the difference between the amount that consumers actually pay and the amount that they would have been willing to pay. Consumer Surplus Supply Price ($/1000 gal) Demand Quantity (gal)
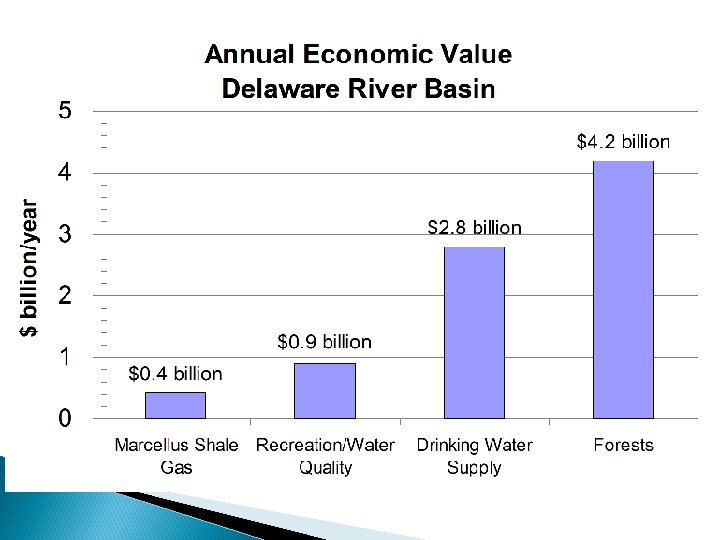
The Delaware River Basin in Del. , NJ, NY, and Pa. contributes: 1. $25 billion in annual economic value from recreation, water quality, water supply, ecotourism, forest, agriculture, open space, and port benefits. 2. Ecosystem goods and services worth $21 billion per year, net present value (NPV) = $683 billion. 3. Over 600, 000 jobs with $10 billion in wages.
US Budget FY 12 Federal Budget EPA Budget US Pop. US Budget per capita EPA Budget = < = = $3, 830 billion $10 billion 309 million $12, 000 $32 0. 3% US budget
$2. 8 B $403 M $4. 8 B $917 M
Questions?