Economics 1629 LECTURE 2 Validity Daniel Bjrkegren danbjorkbrown

Economics 1629 LECTURE 2: Validity Daniel Björkegren danbjork@brown. edu

X Y

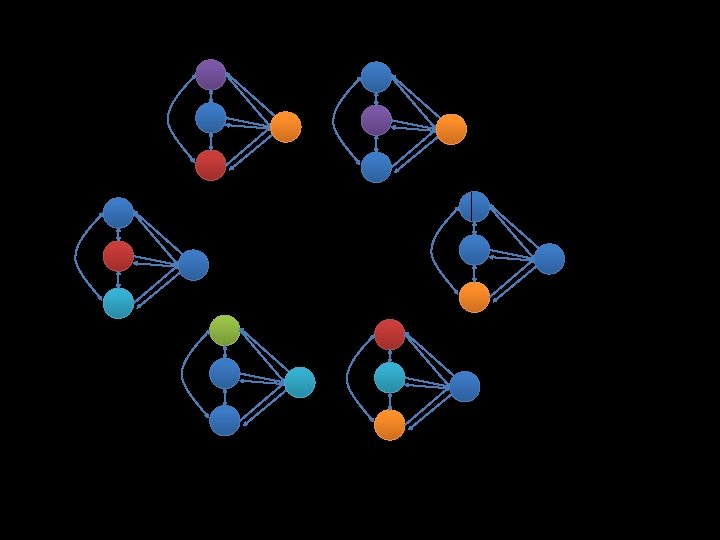
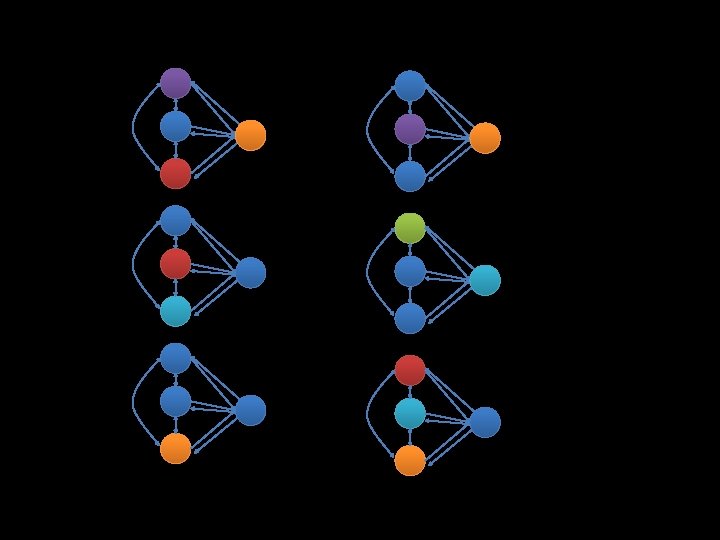
X 1 X 2 X 3 … Y

X 1 X 2 X 3 … Y

health education income job …

health education job Income ’

Counterfactual health education income job Me #1 income job Me #2

Counterfactual health education income job Me with college degree income job Me without college degree
 save lives (Y)? • Do")
What is the counterfactual? • Do car seatbelts (X) save lives (Y)? • Do industrial emissions (X) cause the temperature of the planet (Y) to rise? • Do smaller classes (X) increase student learning (Y)?
 save lives (Y)? – Almost")
What is the counterfactual? • Do car seatbelts (X) save lives (Y)? – Almost everyone wears seatbelts (X). Some people involved in car accidents are killed (Y). – What would have happened to seatbelt wearers, if they had not been wearing seatbelts?
 cause the temperature of the")
What is the counterfactual? • Do industrial emissions (X) cause the temperature of the planet (Y) to rise? – We produce a lot of industrial emissions (X). The temperature of the planet appears to be rising (Y). – What would the temperature of the planet would have been at the current time, had there been a different level of industrial emissions?
 increase student learning (Y)? –")
What is the counterfactual? • Do smaller classes (X) increase student learning (Y)? – Some students are in large classes, and some in small. – How would students in large classes have fared at the same point in time had they been in small classes? (and vice versa)

Two approaches Randomized Experiments Observational Studies

Treatment Control


“If you’ve selected a random sample, that’s the same as having random assignment. ” Student What do you think?


Validity Internal Validity External Validity


Does listening to Mozart make you smarter?


What is the effect of small class size on test scores? Randomized Experiment: Tennessee STAR Observational: California Data
 Treatment: Small Class 47. 2")
Tennessee STAR Experiment: Mean Background Characteristics Free Lunch (%) Treatment: Small Class 47. 2 Control: Difference p-value+ Regular Class 48. 5 -1. 3 0. 325 Male (%) 51. 5 51. 3 0. 2 0. 883 Black (%) 31. 1 32. 5 -1. 4 0. 302
 small class | Summary of tscorek in K | Mean")
. tab small, sum(tscorek) small class | Summary of tscorek in K | Mean Std. Dev. Freq. ------+------------------ 0 | 918. 72. 4048 1 | 932. 76. 1738 ------+------------------ Total | 922. 74. 5786

What is the effect of small class size on test scores? Randomized Experiment: Tennessee STAR Observational: California Data

Student-Teacher Ratio
 | Summary of testscr small | Mean Std. Dev. Freq.")
. tab small, sum(testscr) | Summary of testscr small | Mean Std. Dev. Freq. ------+------------------ 0 | 650. 182 1 | 657. 19. 238 ------+------------------ Total | 654. 19. 420

California: Mean Background Characteristics Small Class Regular Class Difference p-value+ % Free Lunch 41. 6 48. 7 -7. 1 0. 001 % English as a second language 12. 5 20. 0 -7. 5 <0. 001 Average Income (in 000’s of $) 16. 3 14. 0 2. 3 <0. 001


Methods: Randomized Experiment Observational

Next Few Classes: Randomized Experiment Observational: Regression

- Slides: 34