Economic Systems 1 SS 6 E 5 The


 World")


- Slides: 21
Economic Systems 1 SS 6 E 5 The student will analyze different economic systems. a. Compare how traditional, command, and market, economies answer the economic questions of 1 -what to produce, 2 -how to produce, and 3 -for whom to produce. b. Explain how most countries have a mixed economy located on a continuum between pure market and pure command. c. Compare the basic types of economic systems found in the United Kingdom, Germany, and Russia.
What is Economics? 2 Ø Economics is the production, distribution, and consumption of goods and services. Ø There are three main economic systems: v Traditional v Command v Market Ø Most countries around the world have a mixed economy (a mixture of the
3 Essential Economic Vocabulary Ø Production – The process of manufacturing or growing something. Ø Distribution – The delivery of products to various places. Ø Consumption – The use of goods and services. Ø Goods – Items that are sold. Ø Services – Work that helps others. Ex: Hospital. Ø Gross Domestic Product (GDP) – The total value of goods and services produced in a country every year.
4 Traditional, Command, Market and Mixed Economies Ø The type of economic system utilized by a country (traditional, command, market, or mixed economies) answer three important economic questions: v What to produce? (What products are produced in the country? ) v How to produce? (How are products produced in the country? ) v For whom to produce? (Who are you making the products for? )
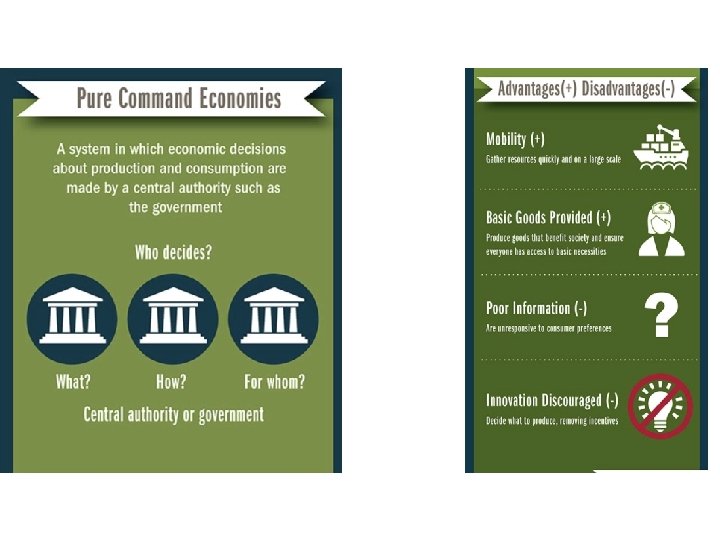
Command Economy 6 Ø In a command economy, the government answers the three economic questions. Ø Characteristics of a command economy: v Little individual freedom v No competition between businesses. v Businesses are not for profit. v Consumers have few choices. v Government determines jobs and sets prices of goods and services. v Examples: No “pure” Command Economies; North Korea (closest North Korea's leader Kim Jong Un greets students at a school in Pyongyang.
Traditional Economy 7 Ø In a traditional economy, culture and customs answer the three economic questions. People do things the way they always have. Ø Characteristics of a traditional economy: v Found in rural areas, such as the Eastern Russia. v Technology is primitive. v Activities are centered around the needs of the people. v Men and women typically have different roles (Example: Hunter/gatherer) Indigenous tribes in Eastern Russia have a traditional economy, typically based around agriculture.
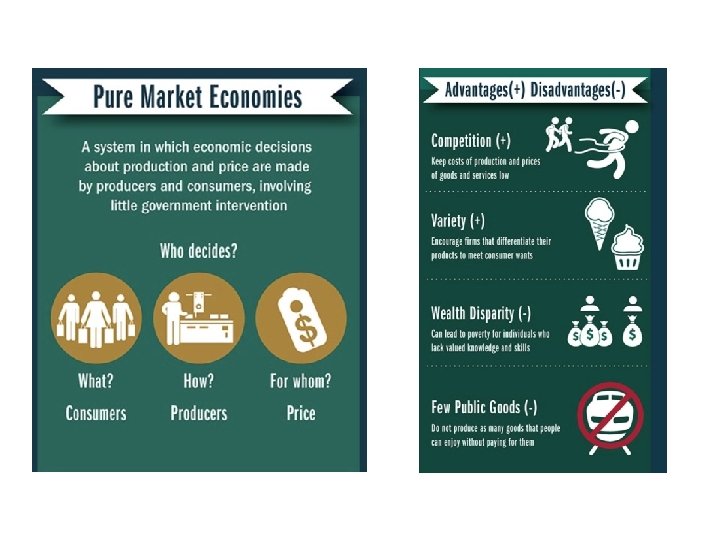
Market Economy 9 Ø In a market economy, consumers answer the three economic questions. Ø An economic system based on free trade and individual choices. Ø Characteristics of a market economy: v Resources are owned by individuals v Competition for profits drives this system. v Supply and demand determine price of goods and services. v No government intervention. v Examples: No “pure” Market Shops on Carnaby St. in London.
Mixed Economy 10 Ø An economic system that combines elements of all three economic systems. Ø In reality, all economies are mixed. Ø For example, in the USA, the government sets quotas and tariffs to control the price of certain goods and services (command), but individuals can determine what to produce, what types of work to do, what to buy, etc. (market)
Economic Continuum 11 North Korea 2. 3% (Most repressed economy in the world) World Average 60. 7% United States 75. 4% Hong Kong 88. 6% (11 th most free economy) (Highest for 22 consecutive years) 0 50 100 Pure Comman Mixed Economy Pure Market
Economic Case Study #1 – United Kingdom 12 Ø What to produce? v The UK, similar to the US, is largely a service based economy but also has an extremely efficient agricultural sector (farming). Ø How to produce? v Industries have much freedom in the UK. There have been recent moves to partially-nationalize certain industries like banking. Ø For whom to produce? v The private sector produces goods and services for domestic and international markets based on the market price system.
Where is the UK on the Economic Continuum? 13 Ø Where would the UK fit on the Economic Continuum? v Far to the market side of center on the continuum. v According to the 2016 Index of Economic Freedom, the UK received an overall score of 76. 4%. 0 50 Pure Comman Mixed Economy UK 76. 4% (10 th out of 178 countries) 100 Pure Market
Economic Case Study #2 – Germany 14 Ø What to produce? v Germany is primarily an export-based economy focusing on manufacturing and commodities. Ø How to produce? v German businesses are largely privately owned and independent. v There is still an issue with updating the Eastern German economy to compete and operate on par with Western Germany. Ø For whom to produce? v Germany survives largely based on their exports, which are determined by global markets. Western Germany still transfers billions of dollars to Eastern German states to help modernize and update factories and production lines.
Where is Germany on the Economic Continuum? 15 Ø Where would Germany fit on the Economic Continuum? v Slightly below UK on the market side of the continuum. v According to the 2016 Index of Economic Freedom, Germany received an overall score of 74. 4%. 0 50 Pure Comman Mixed Economy German y 74. 4% (17 th out of 178 countries) 100 Pure Market
Economic Case Study #3 - Russia 16 Ø What to produce? v The Russian government is still largely involved with many aspects of the economy and must approve any investment larger than 50 million rubles. Ø How to produce? v Making large scale production changes in Russia is difficult due to the immense bureaucracy. There is a movement towards modernizing factories and agricultural equipment, but it is slow. Ø For whom to produce? v Russia has fairly low to moderate tax rates. Increasingly Russia is trying to allow for market interaction, but high tariffs and minimal protection of private property make
Where is Russia on the Economic Continuum? 17 Ø Where would Russia fit on the Economic Continuum? v Russia is in the center of the continuum. v According to the 2016 Index of Economic Freedom, Russia received an overall score of 50. 6%. 0 Pure Comman 50 100 Mixed Economy Pure Market Russia 50. 6% (153 rd out of 178 countries)
Europe Economic Continuum 18 World Average 60. 7% 0 Pure Comman Russia 50. 6% (153 rd out of 178 countries) 50 Mixed Economy UK 76. 4% (10 th out of 178 countries) German y 74. 4% (17 th out of 178 countries) 100 Pure Market
Latin America Economic Continuum 19 World Average 60. 7% 0 50 100 Pure Comman Mixed Economy Pure Market
Canada Economic Continuum 20 World Average 60. 7% 0 50 100 Pure Comman Mixed Economy Pure Market
Australia Economic Continuum 21 World Average 60. 7% 0 50 100 Pure Comman Mixed Economy Pure Market