Economic Power System Operation EET 411 Power System


, Melawa (50")
")


")


 by a condenser. Condenser eliminates heat")

")


 Expand the turbine beyond saturation Initial steam saturation point Expanding steam beyond saturation")


 Increase of boiler temperature • As the boiler temperature is raised, more steam")


")

 give direct effects towards cost of electric production")


 are similar to others,")

 revolves around stator (coil of wire) = electrons in wire")


 Normal Demand Actual Demand t (Hours)")


 Maximum Demand Average Demand t (periodic) Early of Operation Lower than average")


 divide (Total Demand")

 / (100 k.")


- Slides: 75
Economic Power System Operation EET 411 Power System Operation and Control
General of Power Plant • TNB / Malakoff / Genting Sanyen / YTL / Jimah / Sarawak Energy = among power producers • Hydro plants = Tenom Pangi Dam (66 MW – TNB) , Sultan Yusof Jor (100 MW – TNB), Sg Piah Upper/ Lower ( 14. 6 / 54 MW – TNB), Batang Ai (100 MW – TNB)
• Gas fired plants = Genting Sanyen Kuala Langat (720 MW – G. S), Paka (808 MW – YTL), Prai ( 350 MW – Malakoff), Sepanggar Bay (100 MW – Sepanggar), Telok Gong (1160 MW – Powertek), Tunku Jaafar (1500 MW – TNB), Karambunai (120 MW – Ranhill) • Coal fired plants = Jimah Lukut (1400 MW – Jimah), Sejingkat (100 MW – SEB), Tanjung Bin (2100 MW – Malakoff), Manjung (2295 MW – TNB)
• Oil – Fired plants = Gelugor (398 MW – TNB), Melawa (50 MW – ARL Tenaga), Tawau (36 MW – Serudong) • Biomass plants = Bumibiopower (6 MW – empty fruit bunch), Potensi Gaya (7 MW – empty fruit bunch) • Hybrid – Pulau Perhentian Kecil (solar+wind+diesel generator = 550 MW + )
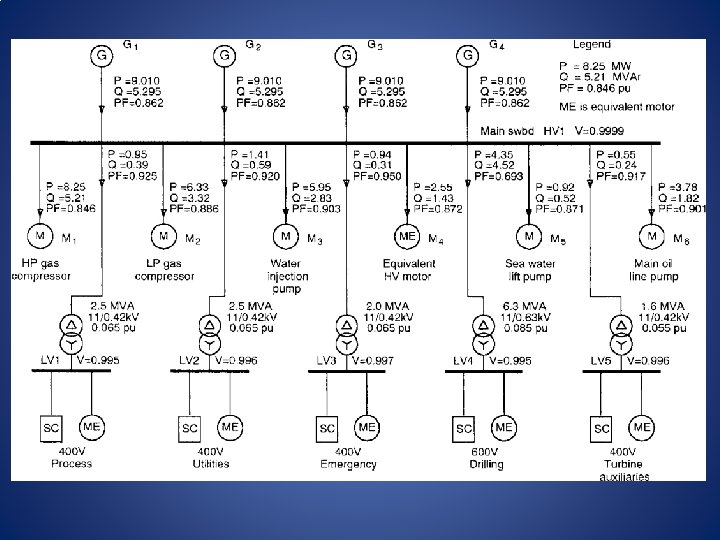
Basic Power System Arrangement (TNB)
Power Generation According to Daily Load Cycle Daily Demand Curve Generated Power Origin Spinning Reserve Peak Unit Controlled Unit time, t (cycle) Base Load Midnight Lunch hour/ Peak Evening
• Generally, Base Load generator operates at 100% capacity 24 hours (mostly fossil fueled / nuclear) • As demand increase, power is delivered through Controlled Unit (medium sized fossil plant/ hydro) in addition to the Base Load generation • At peak, power demand is covered by generators than purposely operate initially at 50% capacity (another 50% as spinning reserve)
Optimal Load Scheduling (TNB)
• Above graph shows generating power scheme used by TNB to cater need of electric power • The bottom area is the power generated by CSP Coal plant - Base Load • As need of power increases, the additional generation is required. Purple area is the additional power generated by CCGT Gas plants • As demand continues to increase, the need of power is catered through additional generated power through CSP Oil/Gas (Intermediate load) and Hydro (Peak Load)
• The above scheduling also represents optimization of load, and sales of energy while considering operational costs • Co ordinations are controlled by centralized control system – local frequency, generating unit output, interconnected power flow between connected areas • Load Frequency Controller (LFC) calibrates local frequency to return to 50 Hz and transmission line outputs
Operation of Thermal Power Plant • Thermal Power Plant = spin the turbine using steam. Water as operating fluid. • Nuclear and coal burning plants belong to the category. • Steam is produced by Rankine Cycle to produce continuous turbine rotation and generate electric power
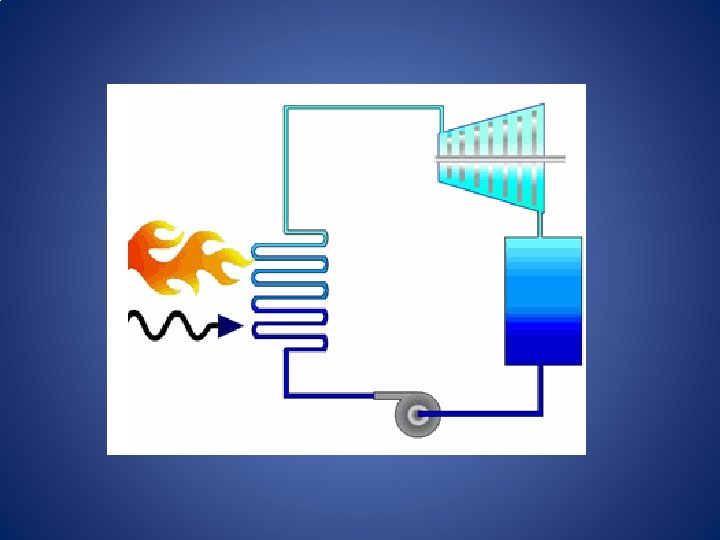
General arrangement of fossil fuel facility
Steam rotates turbine Water into steam Water heated Steam condensed into water Water compressed
High pressure and high temperature stream rotate steam turbine and generate electric power
As steam rotates turbine, it loses energy. And as result its pressure and temperature are greatly reduced
The steam is then changed into liquid (water) by a condenser. Condenser eliminates heat into its surrounding
Liquid is the goes into compressor inlet to regain high pressure.
High pressure water is added with high temperature through boiling process. Fuel (coal/ nuclear) boils the high pressured water
High temperature and pressure steam produced, and rotates turbine to generate electric power
Thermal power plant efficiency • There are currently TWO methods to increase thermal power plant efficiency a) Expand turbine beyond steam saturation point b) Increase temperature of steam to produce more energy
STATES OF STEAM TEMPERATURE
(a) Expand the turbine beyond saturation Initial steam saturation point Expanding steam beyond saturation
• As steam nears saturation point, it contains moist and become more wet = condensed water droplet • It may cause danger – collision with turbine blades = corrosions => affecting turbine performance • However, expanded turbine = more turbine rotation = more electric power
Beyond saturation point = higher utilization 15% wet is acceptable and cause minimum corrosions
(b) Increase of boiler temperature • As the boiler temperature is raised, more steam generated = higher output of steam turbine • This can be achieved by increasing pressure at the compressor outlet
By increase compressor pressure, the initial boiler temperature is raised. By maintaining the add on temperature, steam temperature can be increased
The difference of steam temperature and its energy content By increase in steam temperature, it provides bigger energy to rotate steam turbine, thus extracting much electric power from the same amount of fuel burn
Effect of fuel cost changes toward power plant operation • Fuel cost is the most important parameter in power production business • This is due to many of plant operations very dependable to fuel (exception = nuclear (min), hydro (neglect able) ) • Fuel = the material burnt to produce pressure and temperature to spin turbines that produce electric power
• Above is impact of fuel cost to electric power generation (Finland, 2000) • Gas power plant (blue)> Coal (black) > nuclear (yellow)
• Increase of DOUBLE of fuel prices = in the electric power cost for nuclear rising 9%, for coal 31% and for gas 66%. • Gas prices have since risen and continues to fluctuate significantly.
• Commodities (oil / gas) give direct effects towards cost of electric production • Electric power cost = fuel cost + OM cost *OM = operation and maintenance
• Fuel cost of one generating plant includes the summation between operating and maintenance cost (OM), output of generator, and loss of system • a 1 = measure of loss, P 1 = power output generator i, bi = fuel cost, ci = OM cost, NG = number of generator
• Input of thermal power plant is usually termed in Btu/hr and output is in Watt / MW • Btu/hr is referred to fuel input where fuel is the input to the plant system. • MW is the output of plant system
• Provided the other costs (OM, capital, human resources) are similar to others, thus the input defines the cost of thermal power plant
Concept of power generation • Beside thermal power plants, other sources of energy are rapidly explored to produce electric power • Nuclear, geothermal, solar, and wind energy are converted to useable force to spin turbine at power plants • Some are dependable to fuel cost (atleast minimally), some are totally fuel cost free
• Rotor (magnet) revolves around stator (coil of wire) = electrons in wire (electricity) • With blades attached to the rotor, it forms a turbine that will be turned by force of energy
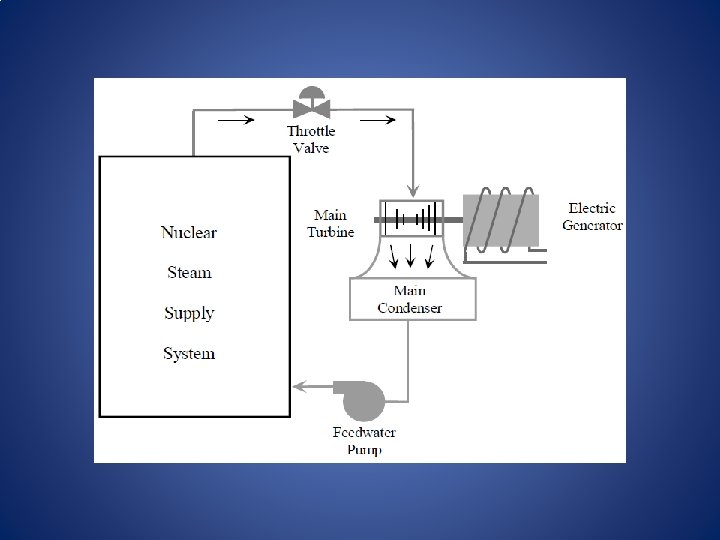
Nuclear power generation • Very similar operation to other the generating facilities, but with very significant differences • Uranium is used to provide rotations for the turbines • Fuel atoms are split through enriching process (fissioning)
• Fuel for nuclear plant is sourced by uranium. • Uranium contains desired atom (U-235) and enriched to split it to produce fuel pellet
Hydro power generation • Utilizing forces of water due to gravity, energy is use to spin hydro turbine
Economics of Power System Power demand continues to increase over the years. Cost of producing electric power is always uncertain due to: 1) Fuel price fluctuates almost daily 2) Cost of constructions vary due to property / land price variations 3) Environmental constraints – political/ social or changing policies 4) Local climate influence ‘comfort and convenience’ – depends on regions 5) Domino effects off politics / economies hard to estimate
TNB / Power Supplier Supply side Generation of power electric Demand side Area Loading at distribution Control : -Generation = consistent delivery -Analyze load -Charge of usage Determine : -Pattern of loading = daily, weekly, monthly -Efficiency including change of lifestyle -Reduce end use efficiency
P (MW) Normal Demand Actual Demand t (Hours)
Maximum Demand M. D • Measurement of power used within 8 – 30 minutes • Standard for most countries, M. D is an observation over 15 minutes • It is a graphical representation of HIGHEST amount of power consumed over 15 minutes period • M. D calculated using KW Demand Meter
Generation Busbar Load Busbar Infinite Bus • Consider this simple one line diagram. • Generation source supplies electric power to an infinite bus. • An infinite bus usually used to describe a very large distribution area. • Maximum Demand of the infinite bus produces the following M. D measurement:
P (W) Maximum Demand Average Demand t (periodic) Early of Operation Lower than average demand’ Power used is less Peak of Operation End of Operation
Link M. D and Power Generated • Average Demand is level of power that represent normal usage of Infinite Bus. It is also an indicator of power required to be channeled from Generation • Maximum Demand is the ‘additional consumption’ of power • As demand is greater than normal usage, generator must be adjusted to deliver more power • At this point, speed of turbine is required to be increased. Thus resulting in more power. Another solution is the introduction of spinning idle ‘reserve power’.
Demand Factor • By definition, Demand Factor is: ratio of : (Real M. D power) over (connected load) It is calculated from time to time and often result in ratio of 1 or less. By knowing Demand Factor, M. D can easily be calculated, since connected load is often known. The importance of Demand Factor is to calculated M. D at any given time interval (weekly / monthly/ yearly) contribute to generation of power
Given that five infinite buses with connected loads of 250, 200, 150, 220 and 200 kilowatt (KW) with demand factors of 95, 90, 85, 80 and 75 percent respectively. Calculate: 1) The size of generator (k. W) to support the loads 2) Calculate the number of wind generators required to produce such power. Please assume wind speed is 20 kmh, blade diameter is 10 m, and conversion efficiency is 45% 3) Efficiency of conversion is raised to 75% after some modification. Given the speed of wind and diameter of blade are similar, compare the number of required generators with (2)
Load Factor • It is a measure of utilization of power over a period time (daily, weekly, monthly, or annually) • It represent the cost of per unit of energy (k. W) generated • Higher load factor = lesser cost per unit generated • It always less than one – average load < maximum demand
Load Factor is defined as the ratio of average demand to maximum demand during a given period Load factor = (Average Load) / (Max. Demand) Or it can be calculated as of: Load factor = (Generated unit x Hours) / (Max. Demand x Hours)
To supply backup generators to a system consuming 15000 KW, the number of 2000 k. W generator can be calculated provided the load factor on side is also known. Given load factor is 0. 75, thus number of load 2000 kw generator is: N = 15000 kw / (2000 kw x 0. 75) = 10 generators Given efficiency of consumption reduced, and load factor now becomes 0. 5, the number of generators = 15 Thus it is important to under the effect of energy utilization.
Diversity Factor • Diversity factor is defined as: the ratio of the sum of the individual maximum demands of the various subdivisions of a system (or part of a system) to the maximum demand of the whole system (or part of the system) under consideration. Diversity is usually more than one
• Consider one generation supplying 4 infinite buses with maximum demand of the following: Week 1 = Bus 1 M. D = 100 k. W Week 2 = Bus 2 M. D = 123 k. W Week 3 = Bus 3 M. D = 97 k. W Week 4 = Bus 4 M. D = 104 k. W Through observations, the generation has set up 250 k. W of M. D for the 4 buses.
Thus diversity factor is: Diversity factor = (Sum of maximum demand) divide (Total Demand of Generation) Diversity factor = (100+125+97+104) / 250 = 1. 74
Plant Capacity Factor & Annual Plant Use Factor • Capacity Factor is used to gauge the performance of a generator that supplies electricity over a period of time • For example, a solar power plan with 100 k. W capacity supplies 45000 k. Wh over a month operation period. • Capacity factor = 45000 k. Wh / (100 kw x 1 month worth of hour)
Plant capacity factor of operation: Capacity factor = (45000 k. Wh) / (100 k. W x 730 hours) = (45000 k. Wh) / 73000 k. Wh = 0. 61 For one month of operation, the power plant is producing power with a capacity factor of 0. 61. This value indicates the efficiency of plant.
Generators with relatively low fuel costs are usually operated to supply base load power, and typically have average annual capacity factors of 0. 70 or more. Generators with lower capacity factors may indicate they are in operation during peak demand periods and/or have high fuel costs, or their operation depends on the availability of the energy source, such as hydro, solar, and wind energy
For annual capacity record, a year worth of operating hours is taken into consideration
Load Sharing Between Generating Stations • Usually there are more than one generating station powering an infinite bus (large distributing area) • This is to ensure minimal risk of power disruption • There is no back up operating principle – the stations operates simultaneously
• The main focus is to provide compensation when one or more generating stations become off grid. At the same time, power system healthy remains very good • A good load sharing utilizes combined two control methods = Droop control method and average power control method • The two methods also can be used individually at one time.
• Active power, reactive power, and harmonic load current are among the many important consideration during load sharing practice • Drop of system frequency/ voltage/ etc is compensated by the available generating stations • Oscillations occurs and stability follows
End of Lecture
1 knot speed 0. 1 % ocean energy Cater 15 billion 1 people 1 - University of Michigan, 2008
Harvesting Ocean Energy Ocean Tidal Thermal Energy 2 Wave Energy 2 - Ocean Thermal Energy Conversion (OTEC)
Wave Energy Spins turbine Electric generated Wave kinetic energy 3, 4 3 - Aqua Turbine by Trevor Johnson 4 - Lahey, P. , Eaton Corp
Increase tide moves towards beach Generating electricity Outgoing tide spins turbine Sea water trapped in basin Tide reduces Tidal Energy
OTEC Hot – Ocean Surface D E E P E R < 38 F C O L D E R Generating Electric Very cold – Ocean Bed
5 Sea. Gen : 1. 2 MW 1, 500 households Y E 6 La Rance : 240 MW 300, 000 households Cle an En erg y Ocean Energy Works? 5 - Sea. Gen off Irish Coast, by Marine Current Turbine Ltd 6 - Largest tidal basin station, France
Wave energy ranges from 2 kw/m – 16 kw/m 7 Tidal height from 13 metres high 7 7 - E. P. Chiang et. al (2003) Potential of Renewable Wave and Offshore Wind Energy Source in Malaysia
Ocean energy runs 24 hours, 7 days a week, 356 days a year without stop! The Nature is kind enough to provide us source of energy Now lets tap its energy and make the world a better place
KEEP CALM AND TAP OCEAN ENERGY THANK YOU