Economic outlook for 2018 Geoff Tily Economic growth


 QE withdrawn")


- Slides: 18
Economic outlook for 2018 Geoff Tily
Economic growth down but not out 3. 5 3 2. 5 2 1. 5 1 0. 5 0 -0. 5 2010 Q 1 2010 Q 2 2010 Q 3 2010 Q 4 2011 Q 1 2011 Q 2 2011 Q 3 2011 Q 4 2012 Q 1 2012 Q 2 2012 Q 3 2012 Q 4 2013 Q 1 2013 Q 2 2013 Q 3 2013 Q 4 2014 Q 1 2014 Q 2 2014 Q 3 2014 Q 4 2015 Q 1 2015 Q 2 2015 Q 3 2015 Q 4 2016 Q 1 2016 Q 2 2016 Q 3 2016 Q 4 2017 Q 1 2017 Q 2 2017 Q 3 2017 Q 4 per cent UK GDP growth Q on previous Q Q on year ago “The recovery has been driven by both the manufacturing and the service sectors, supported by the weaker pound a buoyant global economy, while construction output continues to lag. ” (NIESR)
0 -0. 5 Iceland Mexico Denmark United Kingdom Switzerland Italy Belgium Portugal Japan France NAFTA Israel Greece G 7 United States EU 28 Luxembourg Euro area (19 countries) Australia Norway OECD - Total OECD - Europe Germany Sweden Canada Finland Chile Spain Netherlands Slovak Republic Estonia New Zealand G 20 Austria Korea Hungary Poland Slovenia Ireland Czech Republic Latvia Turkey per cent Economic growth down but not out 2017 GDP average quarterly growth 2 1. 5 1 0. 5
2017 minus 2016, percentage pints -3 Iceland Ireland Mexico Israel Denmark Luxembourg United Kingdom Portugal Slovenia Australia Estonia Spain NAFTA New Zealand Slovak Republic Belgium G 20 EU 28 Netherlands Italy United States Euro area (19 countries) OECD - Total G 7 Switzerland Japan Finland Norway OECD - Europe Poland France Canada Germany Sweden Korea Hungary Austria Chile Turkey Greece Latvia Czech Republic Economic growth down but not out Change in average quarterly growth 1. 5 0. 5 1 -0. 5 0 -1 -1. 5 -2 -2. 5
Economic growth greatly down but not out
Factors likely to affect outcomes DEMAND SUPPLY POSITIVE • • World trade Lower inflation, ? higher real incomes • Weaker sterling NEGATIVE • • • Interest rate rises (global) QE withdrawn Ongoing austerity Brexit uncertainty Property Debt • Lack of capacity
World trade: “Broad- based upturn, but for how long? ” World Bank, Economic Prospects Report, January 2018 Source: World Bank
-5 2010 Q 1 2010 Q 2 2010 Q 3 2010 Q 4 2011 Q 1 2011 Q 2 2011 Q 3 2011 Q 4 2012 Q 1 2012 Q 2 2012 Q 3 2012 Q 4 2013 Q 1 2013 Q 2 2013 Q 3 2013 Q 4 2014 Q 1 2014 Q 2 2014 Q 3 2014 Q 4 2015 Q 1 2015 Q 2 2015 Q 3 2015 Q 4 2016 Q 1 2016 Q 2 2016 Q 3 2016 Q 4 2017 Q 1 2017 Q 2 2017 Q 3 2017 Q 4 World Trade: Impact on UK industries Industry growth, Q on year ago 15 10 5 0 -10 manufacturing construction services
World trade: weaker consumption, stronger trade UK, ppt contributions to growth Q on year ago 5 4 3 2 1 0 -1 -2 -3 -4 -5 Q 3 -2007 Q 3 -2008 Q 3 -2009 Q 3 -2010 Q 3 -2011 Q 3 -2012 Q 3 -2013 Q 3 -2014 Q 3 -2015 Q 3 -2016 Q 3 -2017 C G I X-M other Y
2010 Q 1 2010 Q 3 2011 Q 1 2011 Q 3 2012 Q 1 2012 Q 3 2013 Q 1 2013 Q 3 2014 Q 1 2014 Q 3 2015 Q 1 2015 Q 3 2016 Q 1 2016 Q 3 2017 Q 1 2017 Q 3 2018 Q 1 2018 Q 3 2019 Q 1 2019 Q 3 2020 Q 1 2020 Q 3 unemployment rate, per cent 9 6 8 5 7 6 5 4 0 3 -1 2 -2 1 0 2010 Q 1 2010 Q 3 2011 Q 1 2011 Q 3 2012 Q 1 2012 Q 3 2013 Q 1 2013 Q 3 2014 Q 1 2014 Q 3 2015 Q 1 2015 Q 3 2016 Q 1 2016 Q 3 2017 Q 1 2017 Q 3 2018 Q 1 2018 Q 3 2019 Q 1 2019 Q 3 2020 Q 1 2020 Q 3 Lower inflation, ? higher incomes Inflation and earnings growth, per cent 4 3 2 1 -3 -4 -5 CPI AWE real earnings
2010 Q 1 2010 Q 3 2011 Q 1 2011 Q 3 2012 Q 1 2012 Q 3 2013 Q 1 2013 Q 3 2014 Q 1 2014 Q 3 2015 Q 1 2015 Q 3 2016 Q 1 2016 Q 3 2017 Q 1 2017 Q 3 2018 Q 1 2018 Q 3 2019 Q 1 2019 Q 3 2020 Q 1 2020 Q 3 unemployment rate, per cent 9 8 7 6 4 3 2 -2 1 0 2010 Q 1 2010 Q 3 2011 Q 1 2011 Q 3 2012 Q 1 2012 Q 3 2013 Q 1 2013 Q 3 2014 Q 1 2014 Q 3 2015 Q 1 2015 Q 3 2016 Q 1 2016 Q 3 2017 Q 1 2017 Q 3 2018 Q 1 2018 Q 3 2019 Q 1 2019 Q 3 2020 Q 1 2020 Q 3 Lower inflation, higher incomes (NB RPI) Inflation and earnings growth, per cent 6 4 2 5 0 -4 -6 RPI CPI AWE real earnings Source: OBR
Interest rate rises / capacity 2018 is on track to be the first year since the financial crisis that the global economy will be operating at or near full capacity. World Bank By 2019, GDP growth is projected to ease mildly in the majority of major economies as capacity constraints begin to emerge, OECD Our models … tell a broadly consistent story of an economy operating close to potential. OBR, Nov. EFO p. 43 Unemployment has continued to fall and the extent of spare capacity in the economy now seems limited. Bo. E, Nov. 2017
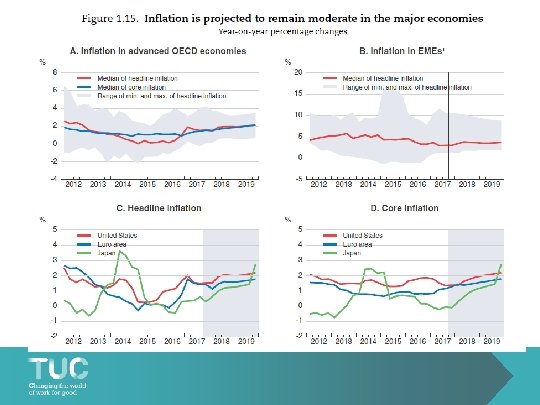
Interest rate rises: but questions over inflation
(Global) QE withdrawn
Ongoing austerity
Factors likely to affect outcomes DEMAND SUPPLY POSITIVE • • World trade Lower inflation, ? higher real incomes • Weaker sterling NEGATIVE • • • Interest rate rises (global) QE withdrawn Ongoing austerity Brexit uncertainty Property Debt • Lack of capacity TOTAL MORE OF THE SAME: ONGOING HARDSHIP, FRAGILITY