Economic Indicators Business Cycle Real GDP versus Nominal

Economic Indicators • Business Cycle – “Real” GDP versus “Nominal” – GDP Deflator – C+I+G+NX – 6 month contraction = Recession • Unemployment Rate – 4 Types – Calculation • Inflation – CPI/GDP Deflator – Cost of Living Adjustment – “Real” Income

• • • Causes cancer Why entering Chinese waters? REI Black Friday closing Republican poll leader University removed state flag

GDP • Total value of all final goods and services produced within a country within a given year. • C + I + G + NX

Gross Domestic Product • C- Consumer Spending • I- Business Investment and Inventory • G- Government Spending • NX- Net Exports (Exports minus Imports)

GDP • C + I + G + NX • Don’t Count – Used – Transfers – Non-market – Intermediate goods*
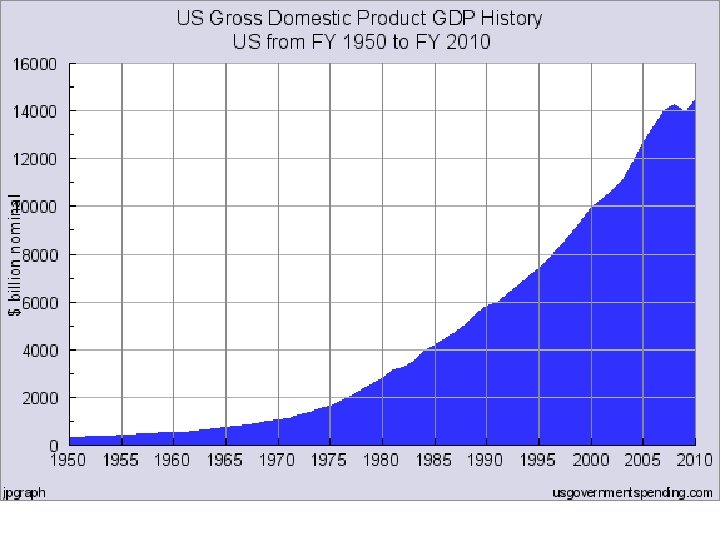

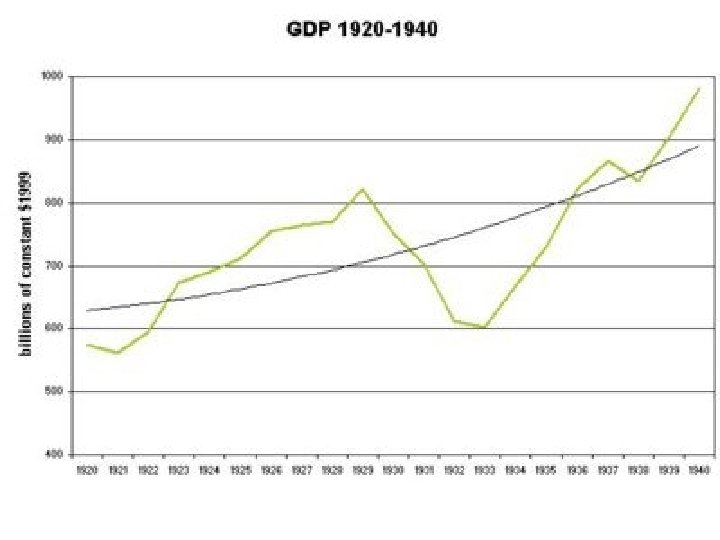
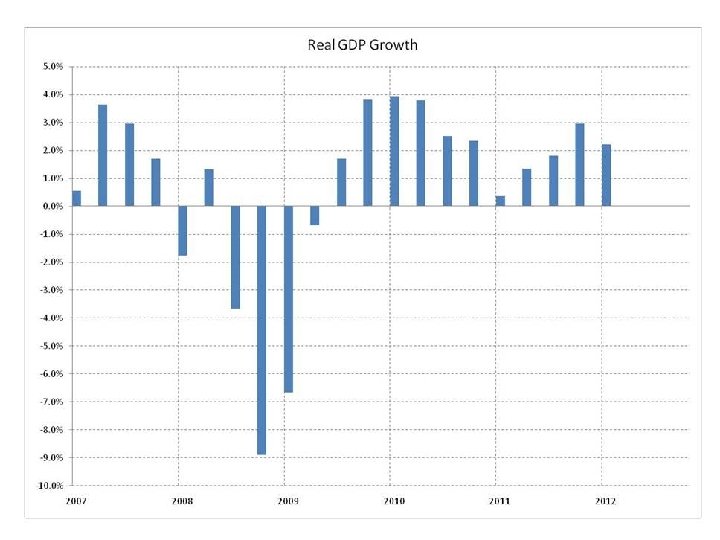
Business Cycle Recession- real GDP goes down for at least 6 months. R E A L G D P

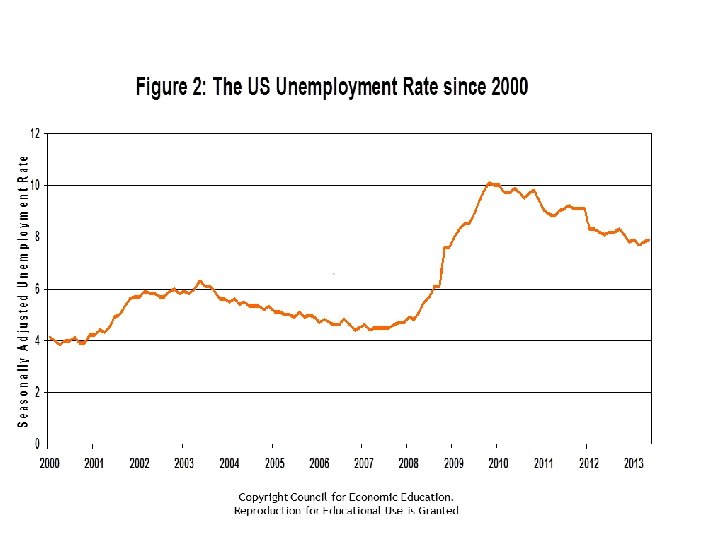
Unemployment Rate= Unemployed Persons/Total Labor Force X 100 Labor Force= all civilians 16+ who are working or looking for a job Unemployed Persons= 16+ civilians who are looking for a job but do not have one

All Stats are for People 16 or Older • • Population = 1000 Pop. with jobs = 600 Pop. Without jobs = 400 Pop. Actively seeking employment in past month = 190 • Pop. from previous category who currently have a job = 40
")
Unemployment (National)

Types of Unemployment • Frictional- temporary while searching • Structural-lack of skills/lack of need for skills/replacement by technology/replacement by merger or streamlining • Cyclical- related to health of overall economy • Seasonal- seasonal • Not


Not Unemployed If… • • Under 16 Have a Job Are not actively seeking a job Are not currently available to work

Poor _____ • Extra Credit • Write a story about a person who experiences all 4 types of unemployment in a given year and then drops out of the labor force. • 1 page double spaced • 6 points

Unemployment Formula Unemployment Rate= Unemployed Persons/Total Labor Force X 100 Labor Force= all civilians 16+ who are working or looking for a job Unemployed Persons= 16+ civilians who are looking for a job but do not have one

• • • Frictional Structural Cyclical Seasonal Not

Hit the debt ceiling, government slashes spending, GDP tanks • • • Frictional Structural Cyclical Seasonal Not

You can’t stand this class anymore, drop out, and start looking for work • • • Frictional Structural Cyclical Seasonal Not

• • • A former switchboard operator is having trouble finding a skilled position Frictional Structural Cyclical Seasonal Not

New Jersey surf instructor in January • • • Frictional Structural Cyclical Seasonal Not

Mr. Parish this summer. • • • Frictional Structural Cyclical Seasonal Not

Calculate Population = 14, 000 Population 16 -64 = 10, 000 Employed Persons = 6, 000 Unemployed Persons = 215 ----------------------------Labor Force = ______ Unemployment Rate = _______ Labor Force Participation Rate = _______
")
Unemployment (National)

Labor Force Participation Rate

Labor Force Participation Rate

Labor Force Participation Rate
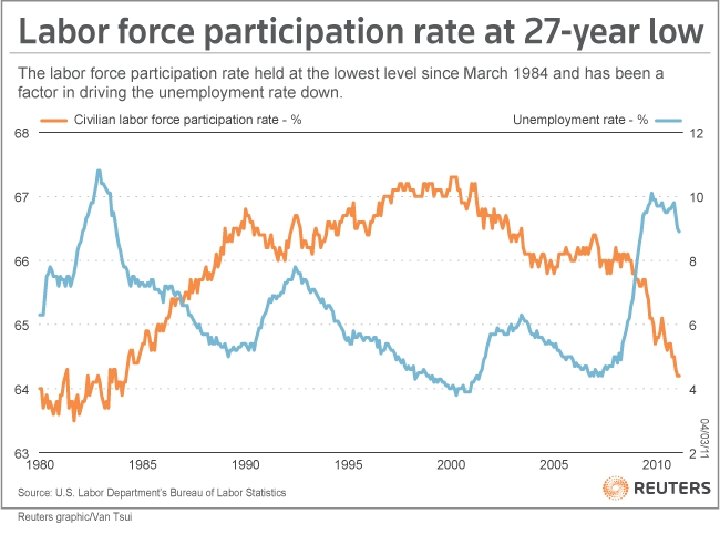

Labor Force Participation Rate • % of working age people who are – Working – Looking for a Job • Working Age – 16 -64

Calculate Population = 14, 000 Population 16 -64 = 10, 000 Employed Persons = 6, 000 Unemployed Persons = 215 ----------------------------Labor Force = ______ Unemployment Rate = _______ Labor Force Participation Rate = _______

Labor Force Participation Rate • % of working age people who are – Working – Looking for a Job • % working age population in the labor force • Working Age – 16 -64

Calculate Population = 10, 000 Population 16 -64 = 8, 000 Employed Persons = 5, 000 Unemployed Persons = 350 ----------------------------Labor Force = 5, 350 Unemployment Rate = 6. 54% Labor Force Participation Rate = 66. 88%

Agenda • Debate and House News – Goodbye Mr. Weeper! • GDP Review and Unemployment by State • Measures of Inflation – CPI versus GDP Deflator • 10 minutes to finish classwork (otherwise HW)

Economic Indicators • Business Cycle – “Real” GDP versus “Nominal” – GDP Deflator – C+I+G+NX – 6 month contraction = Recession • Unemployment Rate – 4 Types – Calculation – Labor Force Participation • Inflation – CPI/GDP Deflator – Cost of Living Adjustment – “Real” Income • Stock Indices

2015 US GDP: C+I+G+NX • Sale of a Delorean

2015 US GDP: C+I+G+NX • Purchase of $10, 000 of Disney stock

2015 US GDP: C+I+G+NX • 10, 000 unsold Ford f-150 pickups

2015 US GDP: C+I+G+NX • Tires purchased by Ford Motor Company

2015 US GDP: C+I+G+NX • Machines purchased by Ford Motor Company

2015 US GDP: C+I+G+NX • East Penn Schools purchases an i. Pad for every student

2015 US GDP: C+I+G+NX • I just purchased a Man in the Yellow Hat costume

2015 US GDP: C+I+G+NX • A bottle of delicious Canadian maple syrup • Eh?

2015 US GDP: C+I+G+NX • Largest Component by far?

2015 US GDP: C+I+G+NX • Component that would shrink if a Republican is elected and keeps his/her promise

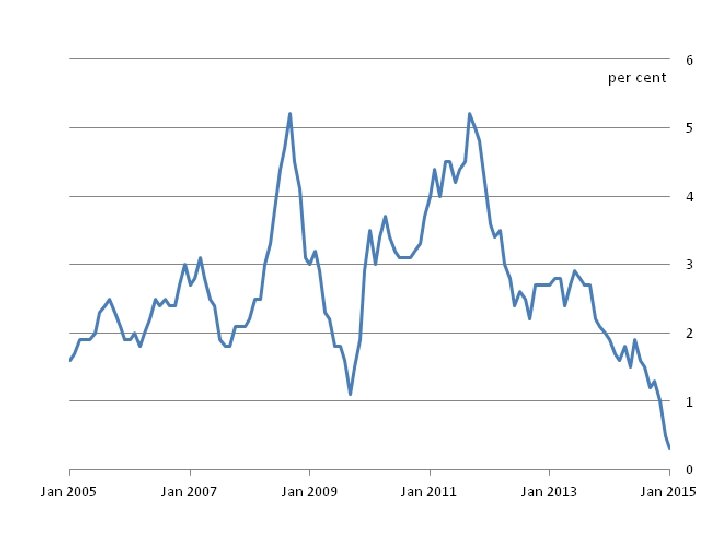
Inflation • Prices go • Value of the dollar goes

Inflation • Prices go UP • Value of the dollar goes DOWN

Inflation • TWO CAUSES?

Demand-Pull Inflation

Cost-Push Inflation

Stagflation
")
Measures of Inflation • GDP Deflator • Consumer Price Index (CPI)

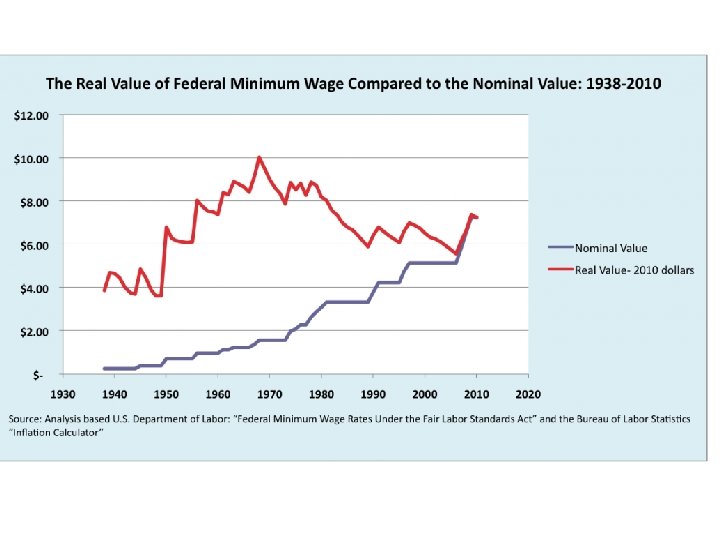
Inflation Terms • Nominal- unadjusted dollar amounts • Real- adjusted for inflation

Using the GDP Deflator • Nominal $$$$/GDP deflator x 100= Real $$$ • Real $$$ = Adjusted for Inflation • Base Year Deflator = 100

Consumer Price Index • Measures change in price level of a “fixed basket of goods” • Used for Social Security “cost of living” adjustments (COLA)

Consumer Price Index • Herbert Hoover= $75, 000 • President Obama = $400, 000

Consumer Price Index • Babe Ruth’s Salary – 1931= $80, 000 • Average Player Today= $2, 272, 620

Consumer Price Index

GDP Deflator

GDP Deflator versus CPI • GDP Deflator – variable basket – Best for real GDP • CPI – fixed basket – Best for COLA (ex. Social security)
 measure the performance of a segment of the stock market •")
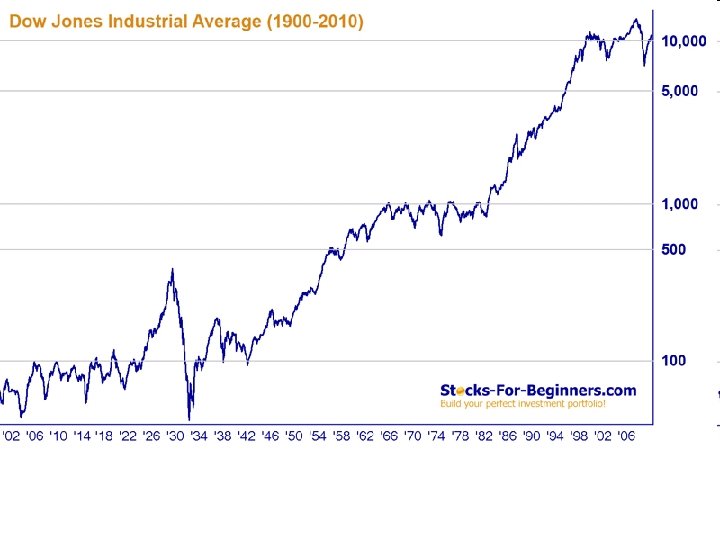
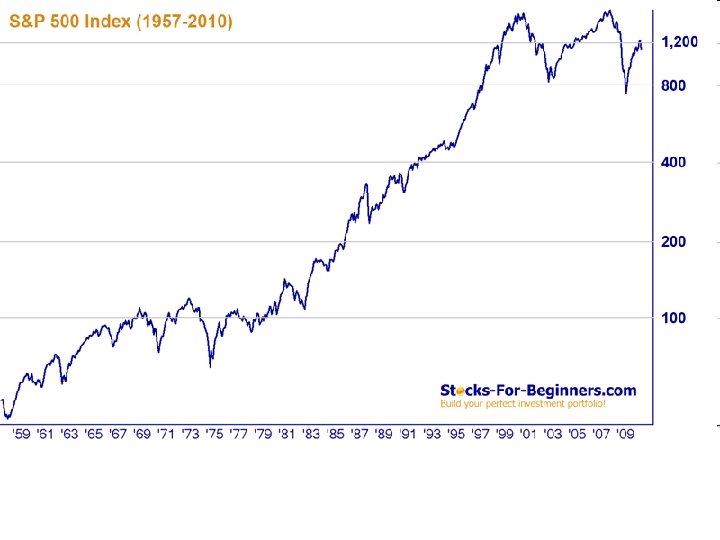
Stock Indexes (Indices) measure the performance of a segment of the stock market • Dow Jones Industrial Average – 30 Large Companies • S&P 500 • 500 companies of various industries • NASDAQ – 3, 000 companies – Technology/growth companies (ex- Google)
 measure the performance of a segment of the stock market •")
Stock Indexes (Indices) measure the performance of a segment of the stock market • Dow Jones Industrial Average – 30 Large Companies • S&P 500 • 500 companies of various industries • NASDAQ – 3, 000 companies – Technology/growth companies (ex- Google)

NASDAQ

Stock Terms • Ticker- company abbreviation • Share- a single “piece” of a company “pie” • Portfolio- a collection of investments • Index- measures performance of a segment of the stock market

Economic Indicators • Business Cycle – *GDP = 18. 1 Trillion – GDP Growth = 2% (3. 22% average since 1948) • Unemployment Rate – *5. 1% • Inflation – CPI • Stock Indices

Externalities • Consequence of economic activity affecting an uninvolved party • Positive or Negative • Production or Consumption
- Slides: 72