Economic Growth and the Human Condition Allan L


- Slides: 21

Economic Growth and the Human Condition Allan L. Mc. Cutcheon Lee B. Becker Jenny Marlar Glenn Phelps Tudor Vlad

“Easterlin Paradox” • • James Easterlin (1973, 1974) Fred Hirsch (1976) The “hedonic treadmill” As the overall level of wealth increases in a society, it is not accompanied by a commensurate increase in the overall level of subjective well-being (SWB) • Relative versus absolute wealth/income

The Hedonic Treadmill • Research has provided conflicting evidence for the hypothesis – Several researchers have found a declining marginal utility of income (e. g. , Diener et al. 1995, Diener and Oishi 2000, Frank 2005, Layard et al. 2008) – Other researchers have found contradicting evidence (e. g. , Di Tella 2002, Hagerty and Veenhoven 2005 & 2006, Inglehart et al. 2008)

The Hedonic Treadmill (cont. ) • Using 2006 Gallup World Poll data, a number of researchers have reported a clear association between the income of nations and the average level of SWB in the nation (e. g. , Stevenson and Wolfers 2008, Deaton 2008, Diener et al. 2008) • Association between income and SWB tends to be curvilinear (logarithmic) – Declining marginal utility of income

Other Influences: Health • A number of researchers have reported that those with poorer health also tend to report lower levels of SWB (e. g. , Brinkman 1978, Mehnert et al. 1990, Michalos et al. 2000) • Others argue that it is the self-perception of health that is critical (e. g. , Okun 1984, Diener et al. 2008) • Direction of causality is also debated

Other Influences: Age • Research on age and SWB is inconclusive – Some have reported that younger people have higher levels of SWB (Wilson 1967, Shmotkin 1990, Deaton 2008) – Others have found that older people tend to have higher levels of SWB (Cantril 1965) – Still others have reported finding no association between age and SWB (Inglehart 1990, Diener and Suh 1998, Lucas and Gohm 2000)

Other Influences: Democracy • Several researchers report that individuals living in nations with greater political and civil liberties report higher levels SWB (e. g. , Diener et al. 1995, Schyns 1998, Inglehart and Klingemann 2000) – High correlation between income and democratic institutions in societies

Our Hypothesis • The positive association between and subjective well-being within nations is moderated by the level of repression (i. e. , anti-democratic practices) characterizing the nation. • Multi-level model with 2 levels – Level 2 is the nation – Level 1 is the individual • Cross-level interaction

Our Data and Measures • Gallup’s World Poll data: Level 1 – – Subjective Well-Being Income (self reported) Health (self reported) Age • Freedom House Freedom of the Press – 2007 score • World Bank GDP PPP (2006) – Gross Domestic Product Purchasing Power Parity (per capita)

Our Data and Measures (cont. ) • Gallup World Poll Data – Continuous survey of adult residents of more than 140 nations, representing more than 95% of the world’s population – core questions cover the subjects of Leadership, Law & Order, Food & Shelter, Work, Economics, Health, Well-being, and Engaged Citizenship, as well as personal and household demographics – Mixed mode: RDD where 80%+ have telephones – Approximately 1000 respondents in each nation

Our Data and Measures (cont. ) • Subjective well-being – Please imagine a ladder with steps numbered from zero at the bottom to ten at the top. Suppose we say that the top of the ladder represents the best possible life for you and the bottom of the ladder represents the worst possible life for you. Where would you place yourself on this ladder today? • Personal Health index – Are you satisfied or dissatisfied with your personal health? – Do you have any health problems that prevent you – from doing any of the things people your age normally can do?

Our Data and Measures (cont. ) • Personal Health index – Now, please think about yesterday, from the morning until the end of the day. Think about where you were, what you were doing, who you were with, and how you felt. Did you feel well-rested yesterday? – Did you experience the following feelings during a lot of the day yesterday? How about physical pain? – Did you experience the following feelings during a lot of the day yesterday? How about worry? – Did you experience the following feelings during a lot of the day yesterday? How about sadness?

Our Data and Measures (cont. ) • Freedom House Press Freedom (2007)

Our Data and Measures (cont. ) • World Bank GDP PPP

Multi-Level Models Model 1: Model 2: 15

Descriptive Statistics Variables Mean St Dev Min Max Level 2 Repression 46. 6 22. 25 9. 00 91. 00 GDP PPP (Ln) 8. 62 1. 20 6. 45 10. 55 Level 1 SWB 5. 35 2. 13 0. 00 10. 00 Income (Ln) 8. 86 1. 34 2. 48 13. 05 Age 39. 50 16. 58 15. 00 99. 00 Health 74. 51 28. 65 0. 00 100. 00 N=92, 746 Nations =112

Model 1: Income, Age, and Health Variables Intercept Level 2 Repression GDP PPP Level 1 Income * Repression Age 17 Health Model 1 -1. 088* -. 002. 650*** 0. 494*** ---0. 002* 0. 012*** Model 2

Model 2: With Level 1 Interaction Variables Intercept Level 2 Repression GDP PPP Level 1 Income * Repression Age 18 Health Model 1 -1. 088* Model 2 -1. 081* -. 002. 650*** -0. 002 0. 649*** 0. 494*** ---0. 002* 0. 012*** 0. 506*** -0. 002* 0. 012***

SWB by Ln Income (Nation centered) Cross-Level Interaction SWB Democratic Repressive Low High Ln Income (Nation Centered)

Conclusions • Net of the influences of age and health, income has a strong, positive influence on the level of Subjective Well-Being – In an absolute sense (level of nation’s income) – In a relative sense (Easterlin’s paradox) • The influence of democracy/repression is indirect —those who live in more repressive nations are likely to experience less SWB from increased personal income

Thank You Allan_Mc. Cutcheon@Gallup. com 21
 Economic growth vs economic development
 Economic growth vs economic development
 Geometric tolerance
 Economy of pallavas
 In what situation should a nail service not be performed
 Economic condition of sangam age
 Absolute growth rate and relative growth rate
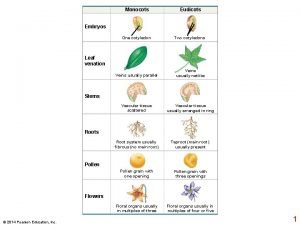
 Eudicot
 Primary growth and secondary growth in plants
 Vascular ray
 Ssema
Ssema Economic growth and development
 Combination of inflation and unmoving economic growth
 Corporate governance and economic growth
 Communication and the human condition
 Step growth polymerization vs chain growth
 Geometric growth population
 Neoclassical growth theory vs. endogenous growth theory
 Difference between organic and inorganic growth
 Harrod domar model
 Solow's model of economic growth
 Ppc curve economic growth
