Economic Geography What Influences Economic Activity 2 Sectors


 for paper, lumber n Deciduous")
 n Dependent on one commodity")


 – – 2. Business")


- Slides: 31
Economic Geography What Influences Economic Activity? 2. Sectors of the Economy 3. Location Factors in Services 1.
Economic geography n How do people earn a living? – Physical environment – Cultural conditions – Technology – Politics/economic system n How does that vary by place? n How does it connect places?
What influences economic activity? n. A country’s access to human, natural and capital resources. n Do they have a skilled workforce? Do they have natural resources? Are their transportation and communication networks modern, outdated or nonexistent? Do they have access to new technology?
What influences economic activity? cont. n. A country’s location and ability to exchange goods. – Are they landlocked? Are they an island or coastal nation? How close are they to shipping lanes? What is their access to communications
What influences economic activity? cont. n They are members of a political or economic alliance that provides access to markets. – Examples would be, the European Union (EU), North American Free Trade Agreement(NAFTA)
Why do countries trade? Think about the concepts of spatial interaction: 1. Complementarity - when two regions, through trade, can specifically satisfy each other's demands 2. Transferability – refers to the costs involved in moving goods 3. Intervening Opportunity – a closer opportunity, greatly from one place to another. When costs of moving people are goods from one place to another are high, transferability decreases, but when costs are low, transferability increases. diminishes the attractiveness of sites farther away. To import goods and services they need n To export goods and services they can sell for profit n
What is comparative advantage? n Comparative advantage means a country will export goods and services that they can produce at lower relative costs than other countries.
What are the effects of comparative advantage? n Enables nations to produce goods and services they can sell for profit n Influences the development of industries (ex. steel, aircraft, automobile, clothing) n Supports specialization and efficient use of human resources n A driver of trade between countries
Five Sectors of the Economy
Primary economic activity n “Gathering” industries – Fishing – Forestry § Commercial vs. subsistence § Potentially renewable resources n “Extractive” industries – Mining – Quarrying (gravel, sand) § Nonrenewable resources § Huge capital investment: then what?
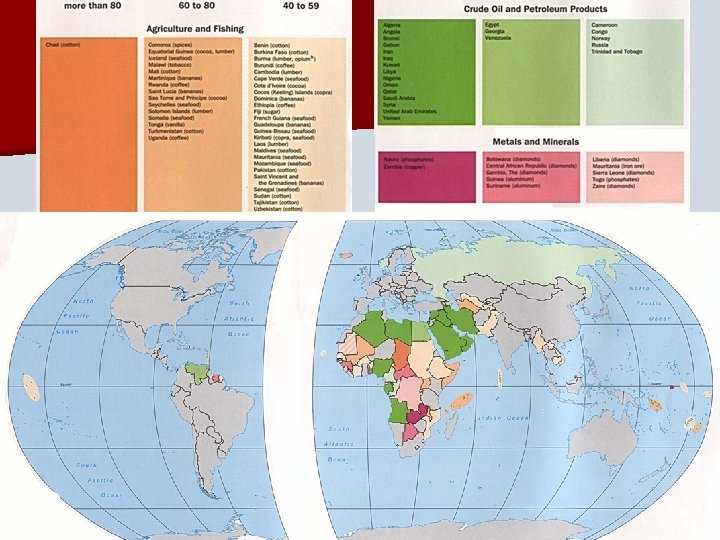
Economic Activity in Primary Sector What are the spatial patterns that emerge from this map and the next map? Does the percentage of activity derived from primary economic activity correlate with economic development/prosperity? Does having certain resources allow for greater prosperity?
Shift in agriculture employment n Why do you think we see a decline in agricultural employment? Think back to the ag unit and the changes discussed there.
Fisheries n Protein for 1 billion people n Inland 6%, aquaculture 23%, oceans 71% n Tragedy of the commons
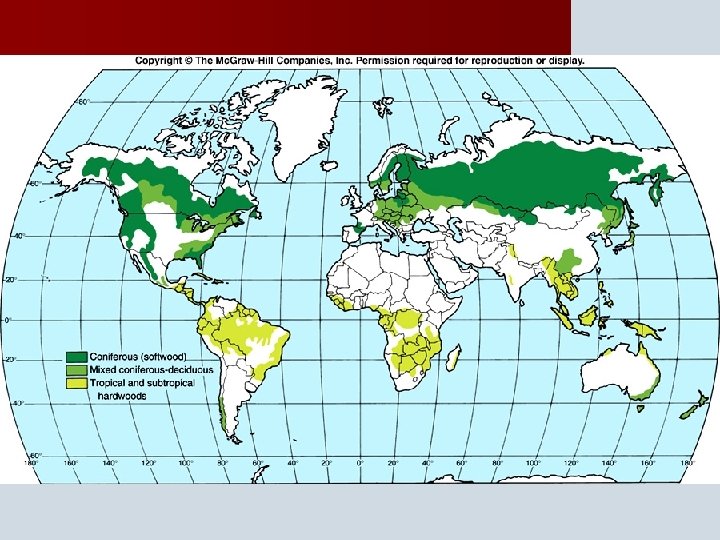
Forestry n Commercial use or fuelwood n Coniferous (softwood) for paper, lumber n Deciduous (hardwood) for furniture, etc. n Tropical hardwood for fuelwood, furniture – And clearing land for other economic activities (agriculture, mining, urbanization)
Resource-based economies n Multiple scales (from countries to towns) n Dependent on one commodity n Volatile commodity prices n Boom-and-bust cycles n Need value-added activity
Secondary economic activity n Adding value to primary products n Manufacturing, processing, energy, construction
Where does industry locate? n Situation factors – Cost of carrying inputs vs. outputs – Accessibility to different modes n Site factors – Cost of land – Cost and skill of labor – Availability of capital
Five location factors 1. Raw materials – From primary activity or manufactured goods – Most important when: § Bulky or heavy inputs § Lose weight in processing § Perishable inputs
Five location factors 2. Market – Final consumer or another firm – Most important when: § Bulky or heavy outputs § Weight added in processing § Perishable outputs
Five location factors Energy – More important historically than today – Mills in Britain, New England, etc. 4. Labor – Price, skill, availability – Usually not mobile 5. Transportation – Costs vary by mode, distance, transfers 3.
The graph on the right shows where a particular industry would be most likely to locate based upon the inputs of the product being manufactured. Can you think of any possible exceptions to these locations?
Agglomeration economies n Economies of scale: producing additional units costs less than producing the first few n Benefits of concentrating many firms in one place n Benefits of concentrating many firms in one industry in one place
Three Types of Services 1. Consumer (services to indvidual consumers) – – 2. Business (services to facilitate other business) – – 3. Retail Personal (health care, education) Producer (F. I. R. E) Transportation Public (provide protection & security for the previous two)
Service Economy n What are the spatial patterns that emerge from this map? Does the percentage of activity derived from service economic activity correlate with economic development/prosperity?
Shift in US Work Force n Why is there a shift in employment in the US over the past 150 years. What factors have driven this shift (think nationally and internationally)
Location in Services n Three geographic levels 1. Urban (choosing a city to locate in) § Choosing between cities 2. Neighborhood (choosing a part of the city) § Choosing a location within an urban area 3. Site (choosing the specific spot) § Choosing location within neighborhood
1. Urban Income 2. Accessibility 1. – 3. Competition – 4. Agglomeration Consumers – – 5. Physical Infrastructure Population Demographics City Image
2. Neighborhood Population Density 2. Accessibility 1. – Transportation Infrastructure 3. 4. 5. 6. Income Public Services Incentives Zoning Regulations
3. Site 1. Neighbors – 2. Complimentary Accessibility – – Transportation Infrastructure Traffic Patterns Costs 4. Availability 5. Parking 6. Competition 3.