Economic Development Classification Systems IBSL Economics P Messere

Economic Development & Classification Systems IB-SL Economics P. Messere
 GDP Increase Region")
Assessing Living Standards Increase in GDP for World’s regions (1980 -2000) GDP Increase Region (% annual average change) 1980 -85 Developed Market Economies 1985 -90 1990 -00 2. 5 3. 7 2. 4 Developing Countries 3 4. 5 4. 8 E. European countries 3. 1 1. 5 -2. 3 According to the above table, which region has shown the greatest improvement in economic welfare?

Development – What & For Whom? Has an economy developed when economic growth (increased GDP per capita) occurs but the following conditions are also present? – Incomes for the poorest 25% to 50% of the population remain unchanged – Large proportion of the population is unable to meet basic needs for food, shelter, sanitation, health care etc… – Long term unemployment increases with improved productivity – The growth is fuelled by a few wealthy land owners producing primary goods for export rather than domestic consumption & profits are reinvested abroad, rather than at home

Economic Growth vs. Development n Economic Growth – The increase in real national income (GDP/GNP) during a given time period, usually one year – Economic growth is a quantitative concept allowing for comparisons both between countries and over time
 – Originally referred to the process")
Economic Growth vs. Development n Economic Development (Past) – Originally referred to the process of industrialization (structural transformation of economy primarily dependent on agriculture to one producing manufactured goods) accompanied by increased real per capita GDP/GNP • Definition proved too narrow for development economists as it did not illustrate true development in terms of increased living standards or quality of life for citizens
 – Includes economic growth but must")
Economic Growth vs. Development n Economic Development (recent) – Includes economic growth but must include reduction of: • Poverty • Income inequality • Unemployment – Development is qualitative concept accounting for questions of what is being produced and who is getting it?

Development – Broader Context
 n World Bank (International Bank for Reconstruction")
Classifications of Developing Countries: World Bank (IBRD) n World Bank (International Bank for Reconstruction & Development) System – divides 133 countries (both developed & and developing) with populations in excess of 1 million into four groups according to per capita income levels: • • Low income: per cap. GNP < $785 in 1997 Middle income: $786 - $3, 125 Upper middle-income: $3, 126 - $9, 655 High income: per cap. GNP > $9656 in 1997
 n World Bank’s System – first three")
Classifications of Developing Countries: World Bank (IBRD) n World Bank’s System – first three groups (per cap. GNP to $9655) comprise 107 mostly developing countries – last group (high income economies) made up of 26 nations; 24 from First World and other two (Kuwait & UAE) classified as developing
 divides")
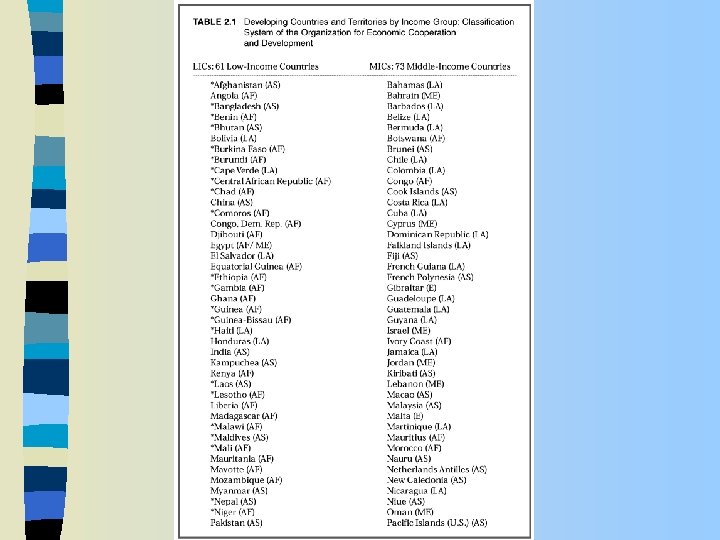
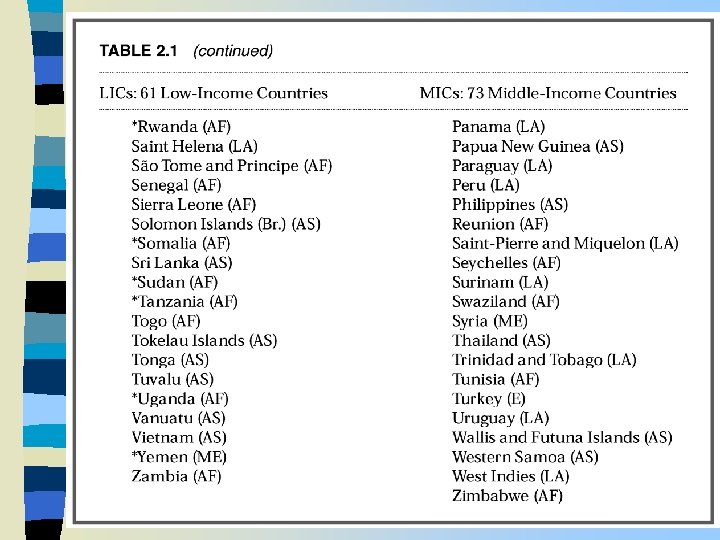
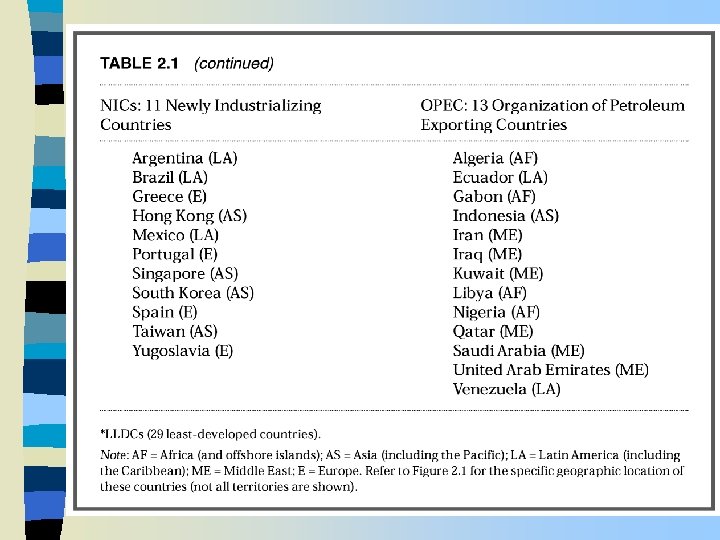
Classifications of Developing Countries: OECD n OECD (Organization for Economic Cooperation & Development) divides third world into four groups: – 61 low-income countries (LICs) with per cap. income less than $659 including 29 least developed countries (LLDCs) – 73 middle-income countries (MICs) – 11 newly industrializing countries (NICs) – 13 members of OPEC

Alternative Measures of Development n To overcome problem of using GDP growth as measure of development, economists construct measurements based on relatively quantifiable and identifiable variables showing relative living standards and overall human welfare – Such common indicators include: • • • ‘Distance’ between richest 10% and poorest 10% in society Doctors per 1, 000 people & average travel time to hospital Number of people with access to clean drinking water Average daily caloric intake person Road km & other transportation networks in km per capita Telephones/computers/internet access per 1, 000 inhabitants
 – Additional indicators include: • Infant mortality rates •")
Alternative Measures of Development (con’t) – Additional indicators include: • Infant mortality rates • Life expectancy • Percentage spent on public education relative to national budget/GDP • GDP/GNP adjusted for pollution / environmental damage / non-monetary activities such as barter • Adjusting income figures showing long-run sustainability by factoring in depreciation of environmental capital eg. natural resources

Composite Indexes n n No single indicator can show overall development Composite indexes created where number of different variables used together and indexed in order to make comparisons possible – Physical Quality of Life Index – United Nations Human Development Index (most commonly used) – Human Poverty Index
 – PQLI")
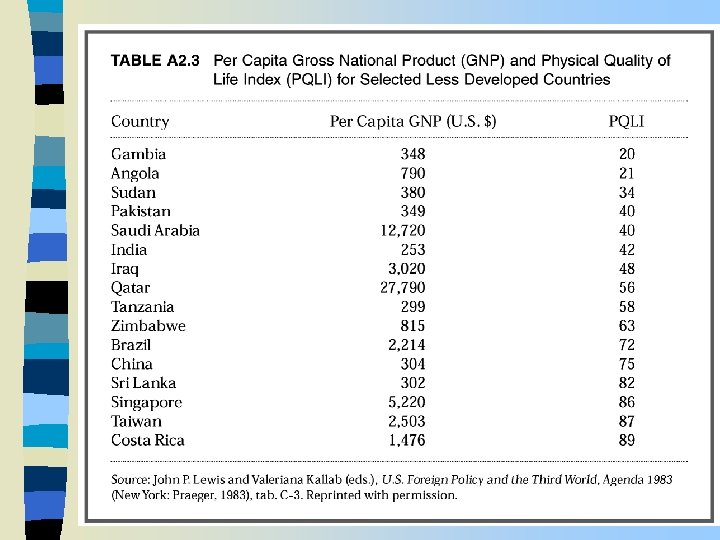
Alternative Measures of Development: PQLI n Physical Quality of Life Index (PQLI) – PQLI uses three indicators (weighted equally) to form a simple composite index where performance of each country is rated on a scale of 1 (worst) to 100 (best): • life expectancy: 100 = 77 yrs, & 28 yrs. = 1 • infant mortality: 100 = 9 per 1000 & 1 = 229 per 1000 • literacy rates (as per country data)

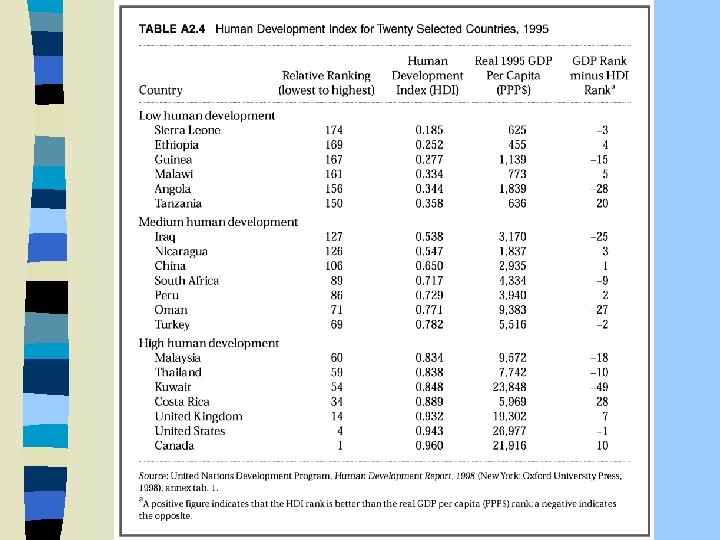
Alternative Measures of Development: United Nations HDI n The United Nations Human Development Index (HDI) – HDI attempts to rank all countries on scale of 0 (lowest human development) to 1 (highest human development) based on three goals: • life expectancy at birth (longevity) • educational attainment (knowledge) • real per capita income (living standard)

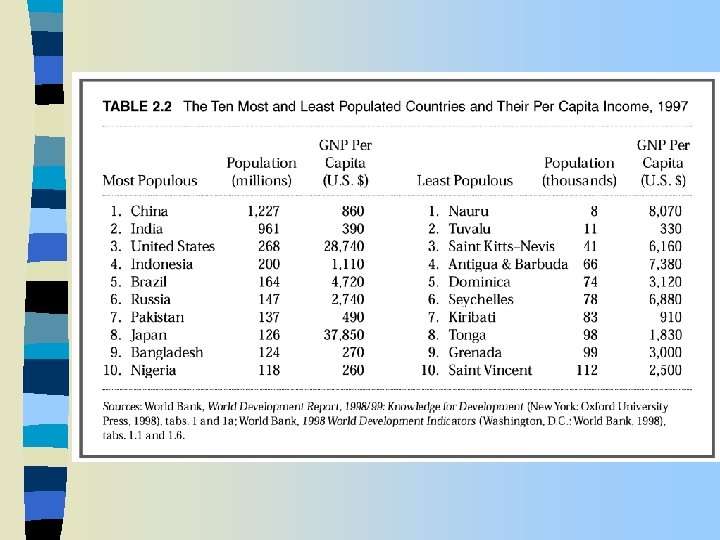
The Structural Diversity of Developing Economies n Size and income level

The Structural Diversity of Developing Economies n n n Size and income level Historical background Physical and human resources Ethnic and religious composition Relative importance of public and private sectors Industrial structure
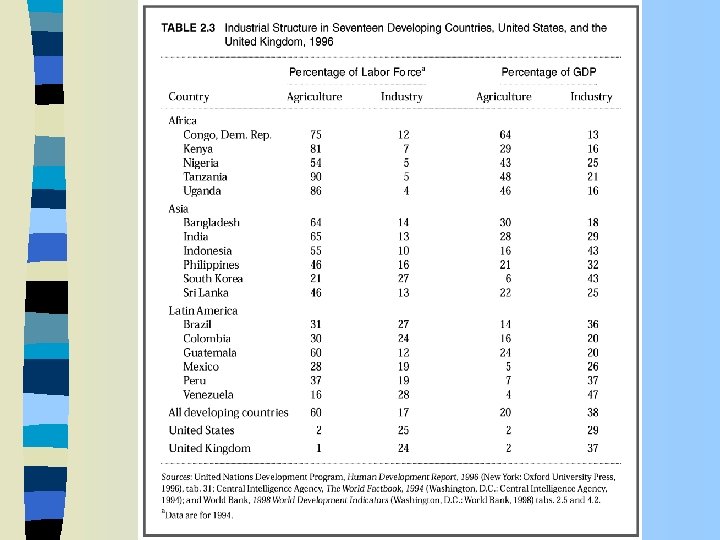

The Structural Diversity of Developing Economies n n Size and income level Historical background Physical and human resources Ethnic and religious composition n n Relative importance of public and private sectors Industrial structure External dependence Political structure, power, and interest groups
- Slides: 26