
Econometrics 2 Lecture 1 ML Estimation Diagnostic Tests









- Slides: 64
Econometrics 2 - Lecture 1 ML Estimation, Diagnostic Tests
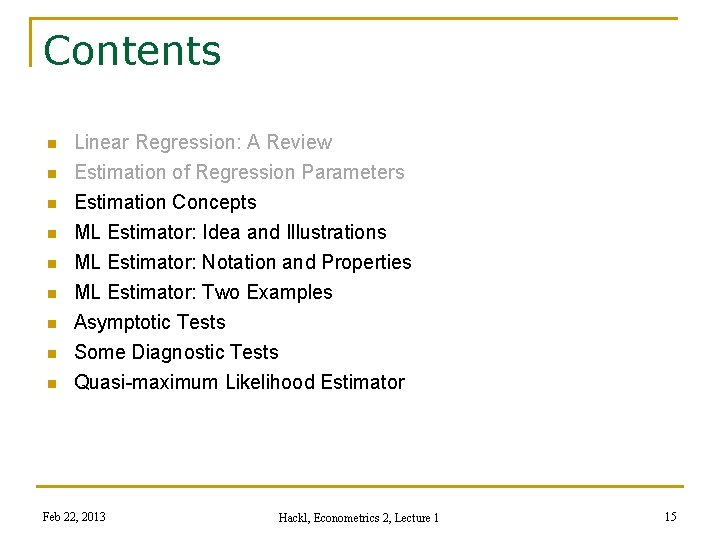
Contents n n Linear Regression: A Review Estimation of Regression Parameters n Estimation Concepts ML Estimator: Idea and Illustrations ML Estimator: Notation and Properties ML Estimator: Two Examples Asymptotic Tests Some Diagnostic Tests n Quasi-maximum Likelihood Estimator n n n Feb 22, 2013 Hackl, Econometrics 2, Lecture 1 2
The Linear Model Y: explained variable X: explanatory or regressor variable The model describes the data-generating process of Y under the condition X A simple linear regression model Y = a + b. X b: coefficient of X a: intercept A multiple linear regression model Y = b 1 + b 2 X 2 + … + b. KXK Feb 22, 2013 Hackl, Econometrics 2, Lecture 1 3
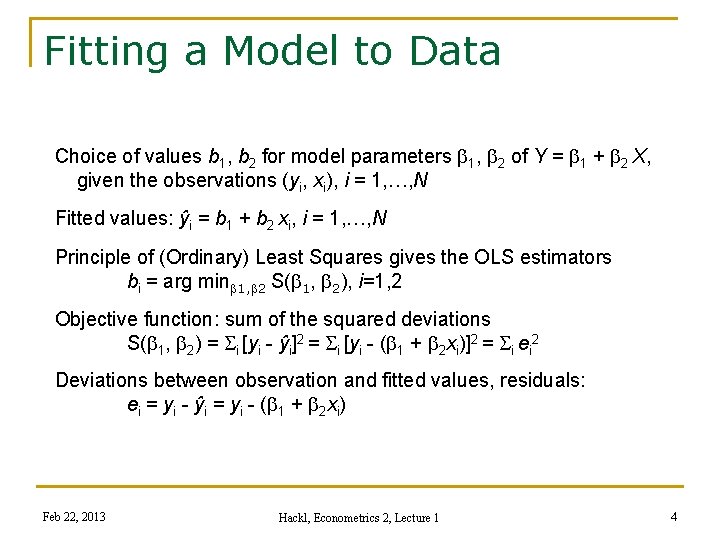
Fitting a Model to Data Choice of values b 1, b 2 for model parameters b 1, b 2 of Y = b 1 + b 2 X, given the observations (yi, xi), i = 1, …, N Fitted values: ŷi = b 1 + b 2 xi, i = 1, …, N Principle of (Ordinary) Least Squares gives the OLS estimators bi = arg minb 1, b 2 S(b 1, b 2), i=1, 2 Objective function: sum of the squared deviations S(b 1, b 2) = Si [yi - ŷi]2 = Si [yi - (b 1 + b 2 xi)]2 = Si ei 2 Deviations between observation and fitted values, residuals: ei = yi - ŷi = yi - (b 1 + b 2 xi) Feb 22, 2013 Hackl, Econometrics 2, Lecture 1 4
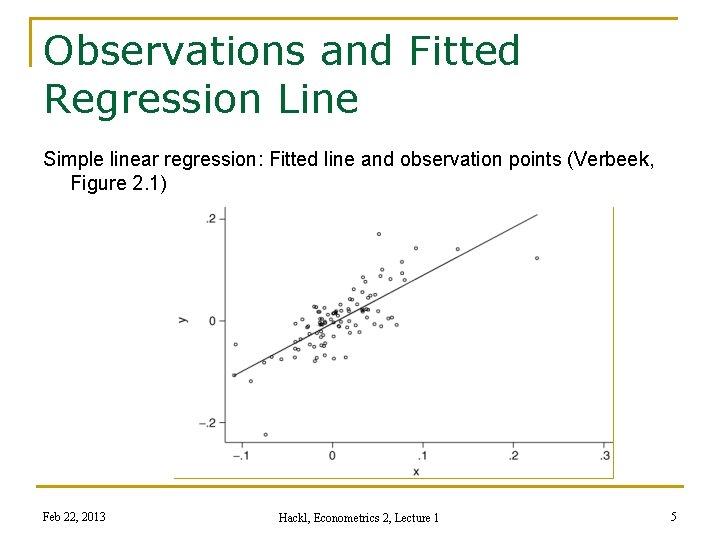
Observations and Fitted Regression Line Simple linear regression: Fitted line and observation points (Verbeek, Figure 2. 1) Feb 22, 2013 Hackl, Econometrics 2, Lecture 1 5
Contents n n Linear Regression: A Review Estimation of Regression Parameters n Estimation Concepts ML Estimator: Idea and Illustrations ML Estimator: Notation and Properties ML Estimator: Two Examples Asymptotic Tests Some Diagnostic Tests n Quasi-maximum Likelihood Estimator n n n Feb 22, 2013 Hackl, Econometrics 2, Lecture 1 6
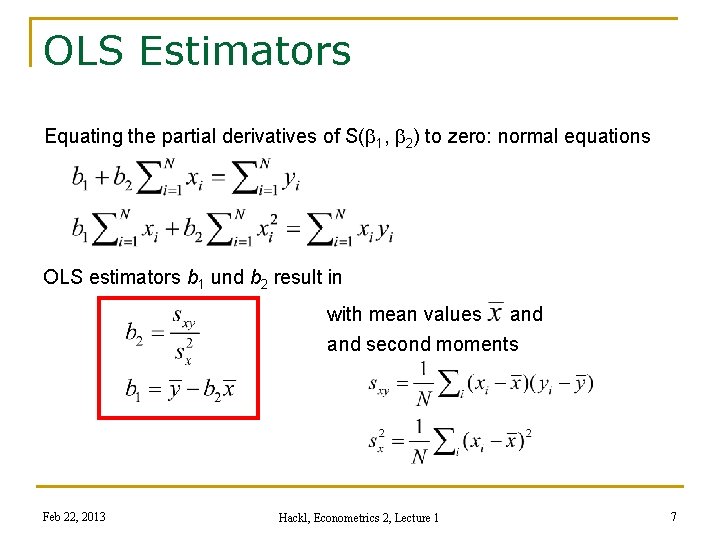
OLS Estimators Equating the partial derivatives of S(b 1, b 2) to zero: normal equations OLS estimators b 1 und b 2 result in with mean values and second moments Feb 22, 2013 Hackl, Econometrics 2, Lecture 1 7
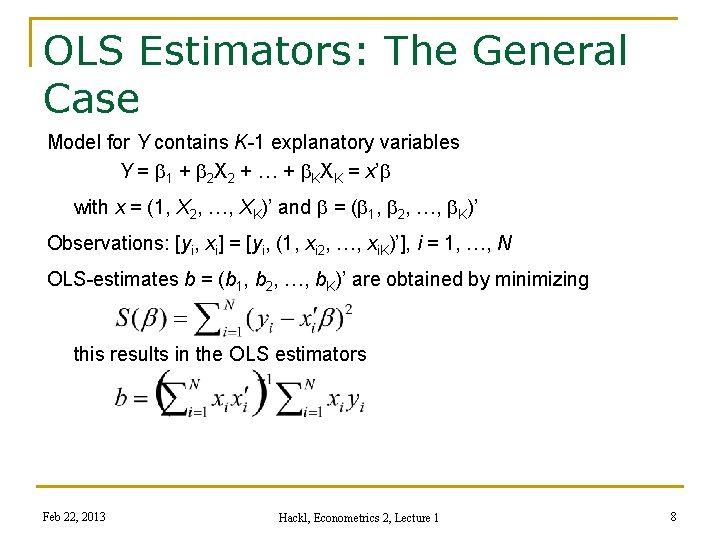
OLS Estimators: The General Case Model for Y contains K-1 explanatory variables Y = b 1 + b 2 X 2 + … + b. KXK = x’b with x = (1, X 2, …, XK)’ and b = (b 1, b 2, …, b. K)’ Observations: [yi, xi] = [yi, (1, xi 2, …, xi. K)’], i = 1, …, N OLS-estimates b = (b 1, b 2, …, b. K)’ are obtained by minimizing this results in the OLS estimators Feb 22, 2013 Hackl, Econometrics 2, Lecture 1 8
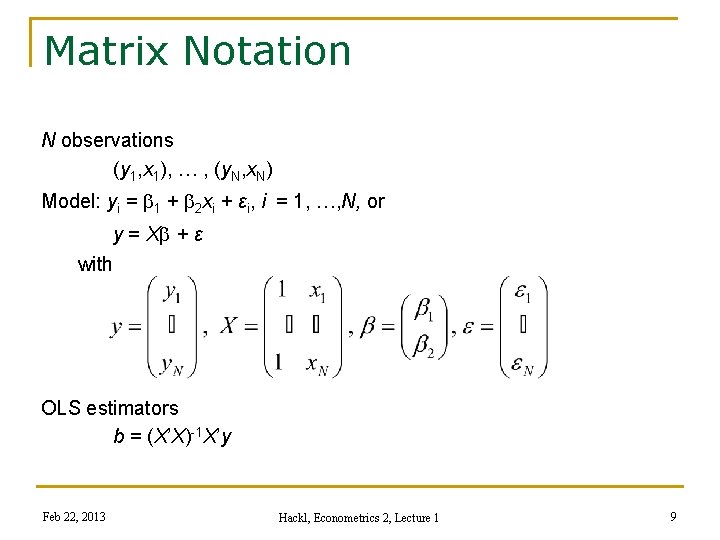
Matrix Notation N observations (y 1, x 1), … , (y. N, x. N) Model: yi = b 1 + b 2 xi + εi, i = 1, …, N, or y = Xb + ε with OLS estimators b = (X’X)-1 X’y Feb 22, 2013 Hackl, Econometrics 2, Lecture 1 9
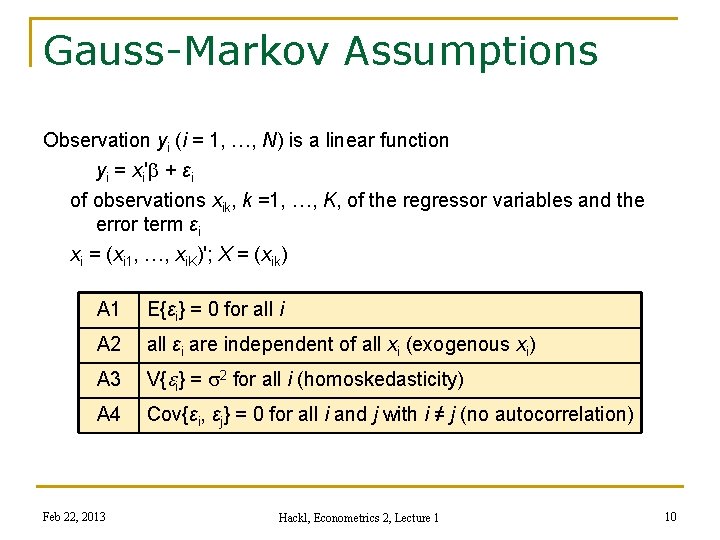
Gauss-Markov Assumptions Observation yi (i = 1, …, N) is a linear function yi = xi'b + εi of observations xik, k =1, …, K, of the regressor variables and the error term εi xi = (xi 1, …, xi. K)'; X = (xik) A 1 E{εi} = 0 for all i A 2 all εi are independent of all xi (exogenous xi) A 3 V{ei} = s 2 for all i (homoskedasticity) A 4 Cov{εi, εj} = 0 for all i and j with i ≠ j (no autocorrelation) Feb 22, 2013 Hackl, Econometrics 2, Lecture 1 10
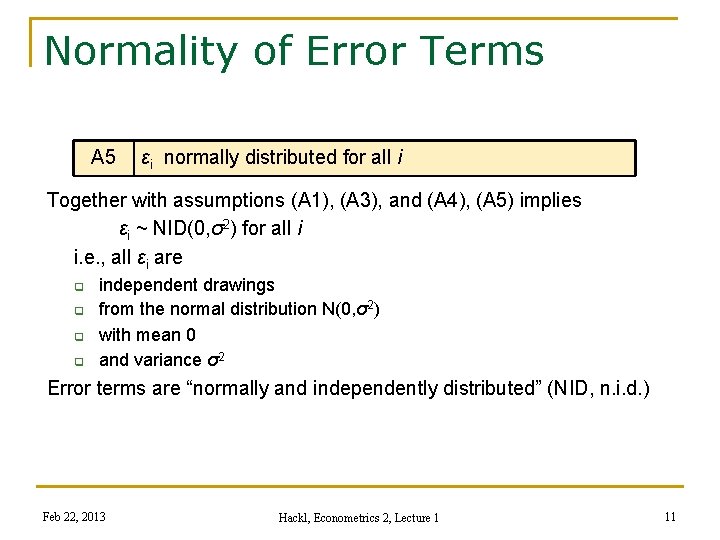
Normality of Error Terms A 5 εi normally distributed for all i Together with assumptions (A 1), (A 3), and (A 4), (A 5) implies εi ~ NID(0, σ2) for all i i. e. , all εi are q q independent drawings from the normal distribution N(0, σ2) with mean 0 and variance σ2 Error terms are “normally and independently distributed” (NID, n. i. d. ) Feb 22, 2013 Hackl, Econometrics 2, Lecture 1 11
Properties of OLS Estimators OLS estimator b = (X’X)-1 X’y 1. The OLS estimator b is unbiased: E{b} = β 2. The variance of the OLS estimator is given by V{b} = σ2(Σi xi xi’ )-1 3. The OLS estimator b is a BLUE (best linear unbiased estimator) for β 4. The OLS estimator b is normally distributed with mean β and covariance matrix V{b} = σ2(Σi xi xi’ )-1 Properties n 1. , 2. , and 3. follow from Gauss-Markov assumptions n 4. needs in addition the normality assumption (A 5) Feb 22, 2013 Hackl, Econometrics 2, Lecture 1 12
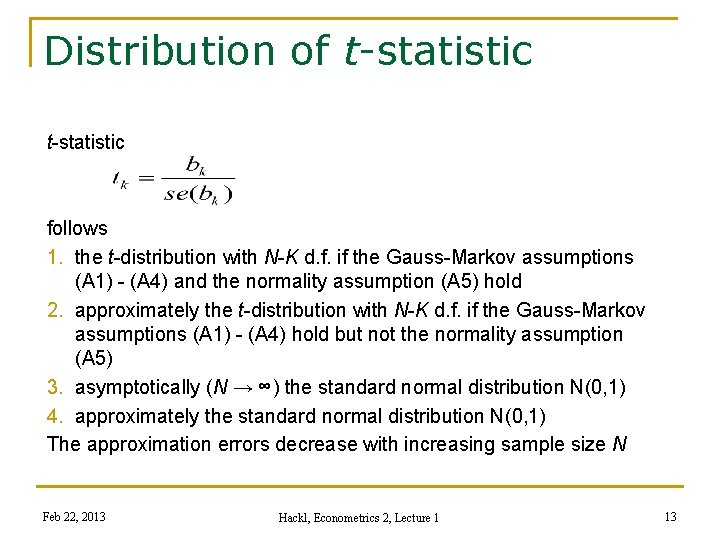
Distribution of t-statistic follows 1. the t-distribution with N-K d. f. if the Gauss-Markov assumptions (A 1) - (A 4) and the normality assumption (A 5) hold 2. approximately the t-distribution with N-K d. f. if the Gauss-Markov assumptions (A 1) - (A 4) hold but not the normality assumption (A 5) 3. asymptotically (N → ∞) the standard normal distribution N(0, 1) 4. approximately the standard normal distribution N(0, 1) The approximation errors decrease with increasing sample size N Feb 22, 2013 Hackl, Econometrics 2, Lecture 1 13
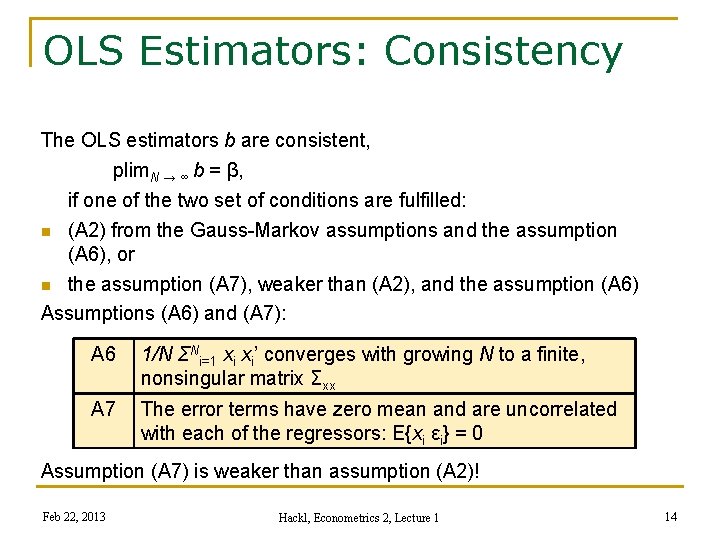
OLS Estimators: Consistency The OLS estimators b are consistent, plim. N → ∞ b = β, if one of the two set of conditions are fulfilled: n (A 2) from the Gauss-Markov assumptions and the assumption (A 6), or n the assumption (A 7), weaker than (A 2), and the assumption (A 6) Assumptions (A 6) and (A 7): A 6 1/N ΣNi=1 xi xi’ converges with growing N to a finite, nonsingular matrix Σxx A 7 The error terms have zero mean and are uncorrelated with each of the regressors: E{xi εi} = 0 Assumption (A 7) is weaker than assumption (A 2)! Feb 22, 2013 Hackl, Econometrics 2, Lecture 1 14
Contents n n Linear Regression: A Review Estimation of Regression Parameters n Estimation Concepts ML Estimator: Idea and Illustrations ML Estimator: Notation and Properties ML Estimator: Two Examples Asymptotic Tests Some Diagnostic Tests n Quasi-maximum Likelihood Estimator n n n Feb 22, 2013 Hackl, Econometrics 2, Lecture 1 15
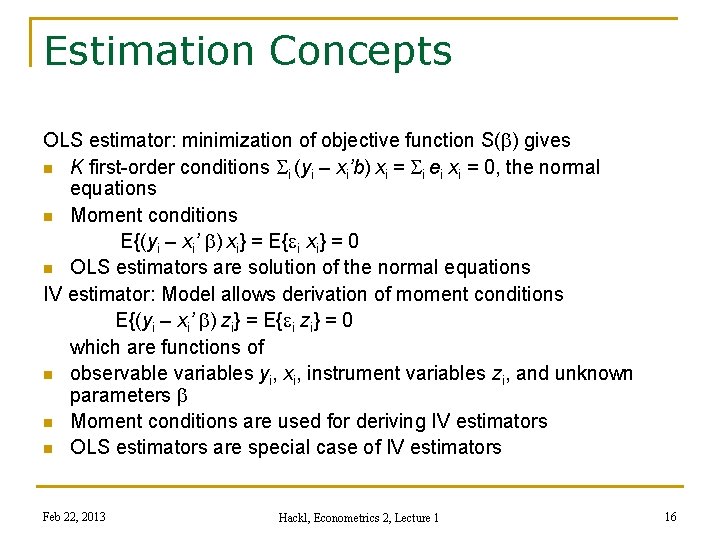
Estimation Concepts OLS estimator: minimization of objective function S(b) gives n K first-order conditions Si (yi – xi’b) xi = Si ei xi = 0, the normal equations n Moment conditions E{(yi – xi’ b) xi} = E{ei xi} = 0 n OLS estimators are solution of the normal equations IV estimator: Model allows derivation of moment conditions E{(yi – xi’ b) zi} = E{ei zi} = 0 which are functions of n observable variables yi, xi, instrument variables zi, and unknown parameters b n Moment conditions are used for deriving IV estimators n OLS estimators are special case of IV estimators Feb 22, 2013 Hackl, Econometrics 2, Lecture 1 16
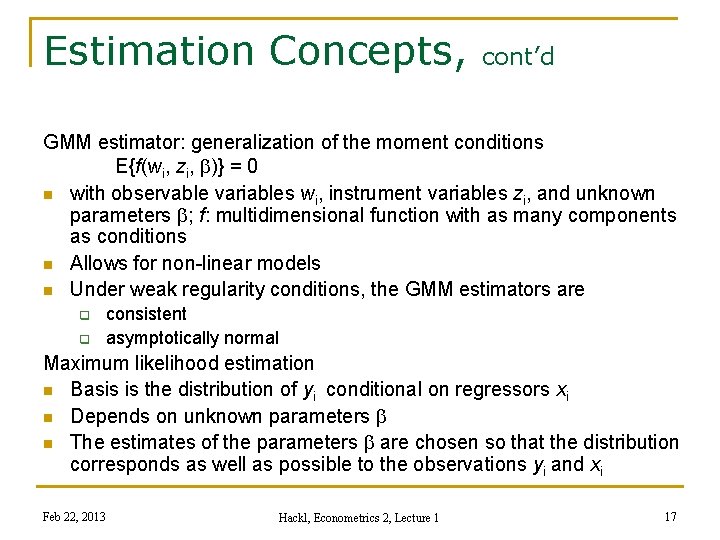
Estimation Concepts, cont’d GMM estimator: generalization of the moment conditions E{f(wi, zi, b)} = 0 n with observable variables wi, instrument variables zi, and unknown parameters b; f: multidimensional function with as many components as conditions n Allows for non-linear models n Under weak regularity conditions, the GMM estimators are q q consistent asymptotically normal Maximum likelihood estimation n Basis is the distribution of yi conditional on regressors xi n Depends on unknown parameters b n The estimates of the parameters b are chosen so that the distribution corresponds as well as possible to the observations yi and xi Feb 22, 2013 Hackl, Econometrics 2, Lecture 1 17
Contents n n Linear Regression: A Review Estimation of Regression Parameters n Estimation Concepts ML Estimator: Idea and Illustrations ML Estimator: Notation and Properties ML Estimator: Two Examples Asymptotic Tests Some Diagnostic Tests n Quasi-maximum Likelihood Estimator n n n Feb 22, 2013 Hackl, Econometrics 2, Lecture 1 18
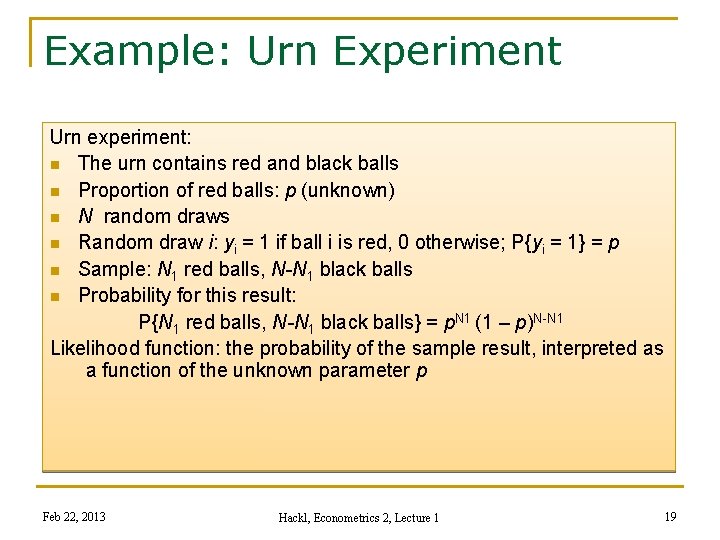
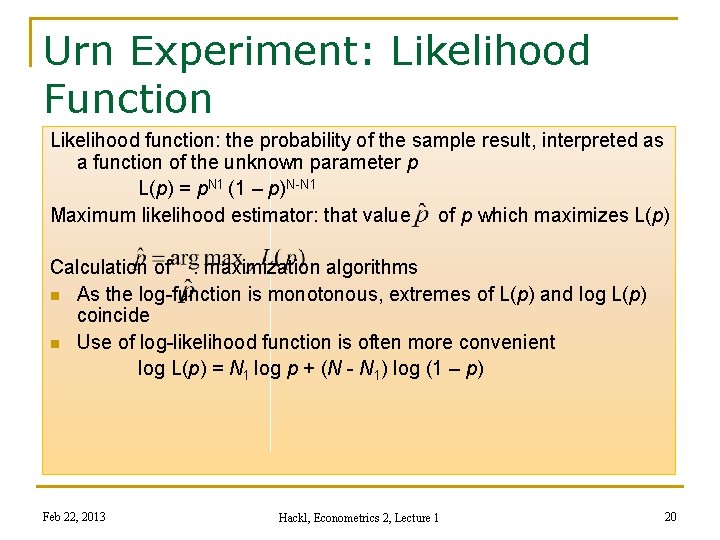
Example: Urn Experiment Urn experiment: n The urn contains red and black balls n Proportion of red balls: p (unknown) n N random draws n Random draw i: yi = 1 if ball i is red, 0 otherwise; P{yi = 1} = p n Sample: N 1 red balls, N-N 1 black balls n Probability for this result: P{N 1 red balls, N-N 1 black balls} = p. N 1 (1 – p)N-N 1 Likelihood function: the probability of the sample result, interpreted as a function of the unknown parameter p Feb 22, 2013 Hackl, Econometrics 2, Lecture 1 19
Urn Experiment: Likelihood Function Likelihood function: the probability of the sample result, interpreted as a function of the unknown parameter p L(p) = p. N 1 (1 – p)N-N 1 Maximum likelihood estimator: that value of p which maximizes L(p) Calculation of : maximization algorithms n As the log-function is monotonous, extremes of L(p) and log L(p) coincide n Use of log-likelihood function is often more convenient log L(p) = N 1 log p + (N - N 1) log (1 – p) Feb 22, 2013 Hackl, Econometrics 2, Lecture 1 20
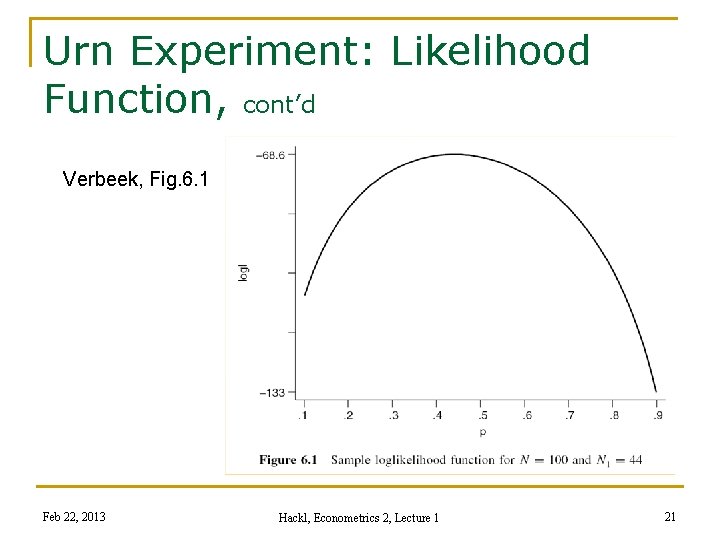
Urn Experiment: Likelihood Function, cont’d Verbeek, Fig. 6. 1 Feb 22, 2013 Hackl, Econometrics 2, Lecture 1 21
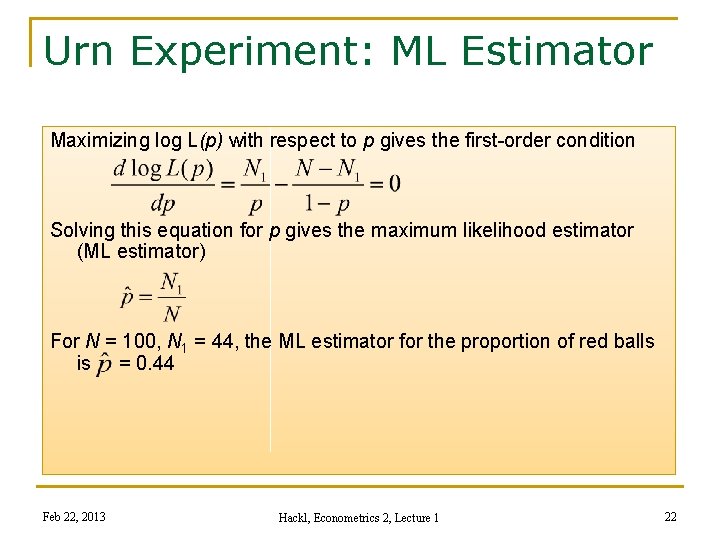
Urn Experiment: ML Estimator Maximizing log L(p) with respect to p gives the first-order condition Solving this equation for p gives the maximum likelihood estimator (ML estimator) For N = 100, N 1 = 44, the ML estimator for the proportion of red balls is = 0. 44 Feb 22, 2013 Hackl, Econometrics 2, Lecture 1 22
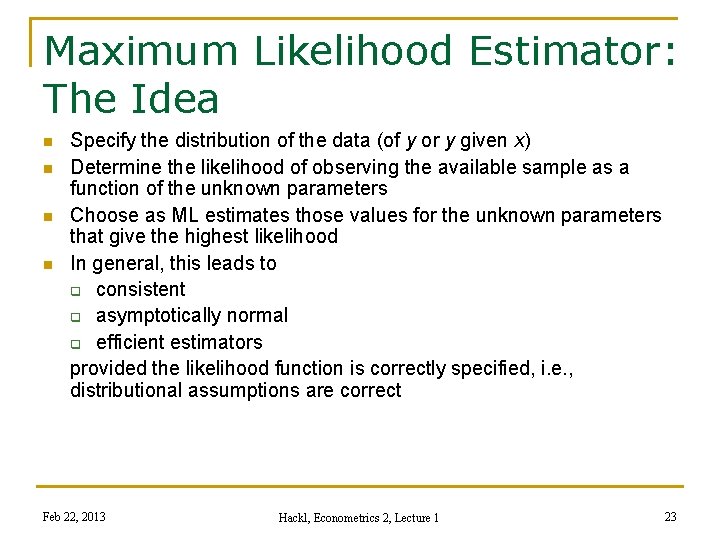
Maximum Likelihood Estimator: The Idea n n Specify the distribution of the data (of y or y given x) Determine the likelihood of observing the available sample as a function of the unknown parameters Choose as ML estimates those values for the unknown parameters that give the highest likelihood In general, this leads to q consistent q asymptotically normal q efficient estimators provided the likelihood function is correctly specified, i. e. , distributional assumptions are correct Feb 22, 2013 Hackl, Econometrics 2, Lecture 1 23
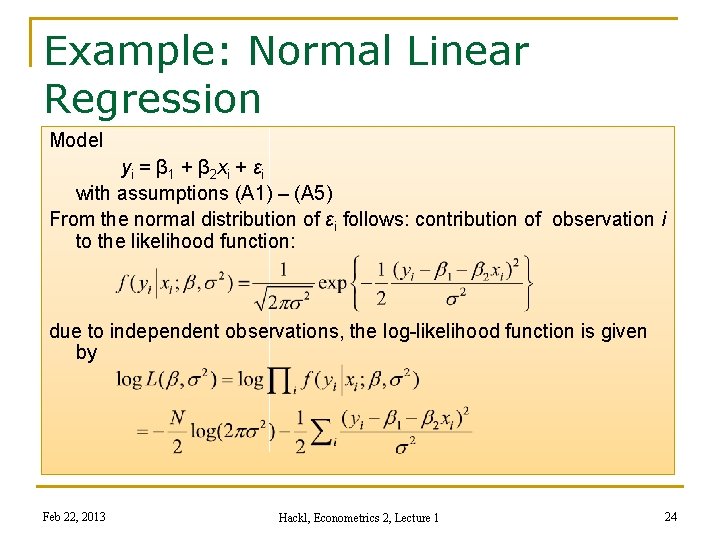
Example: Normal Linear Regression Model yi = β 1 + β 2 xi + εi with assumptions (A 1) – (A 5) From the normal distribution of εi follows: contribution of observation i to the likelihood function: due to independent observations, the log-likelihood function is given by Feb 22, 2013 Hackl, Econometrics 2, Lecture 1 24
Normal Linear Regression, cont’d Maximizing log L with respect to β and σ2 gives the ML estimators which coincide with the OLS estimators, and which is biased and underestimates σ²! Remarks: n The results are obtained assuming normally and independently distributed (NID) error terms n ML estimators are consistent but not necessarily unbiased; see the properties of ML estimators below Feb 22, 2013 Hackl, Econometrics 2, Lecture 1 25
Contents n n Linear Regression: A Review Estimation of Regression Parameters n Estimation Concepts ML Estimator: Idea and Illustrations ML Estimator: Notation and Properties ML Estimator: Two Examples Asymptotic Tests Some Diagnostic Tests n Quasi-maximum Likelihood Estimator n n n Feb 22, 2013 Hackl, Econometrics 2, Lecture 1 26
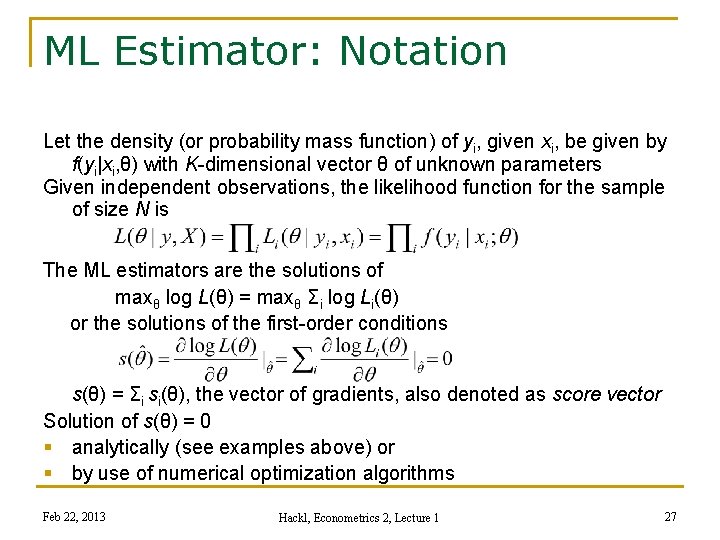
ML Estimator: Notation Let the density (or probability mass function) of yi, given xi, be given by f(yi|xi, θ) with K-dimensional vector θ of unknown parameters Given independent observations, the likelihood function for the sample of size N is The ML estimators are the solutions of maxθ log L(θ) = maxθ Σi log Li(θ) or the solutions of the first-order conditions s(θ) = Σi si(θ), the vector of gradients, also denoted as score vector Solution of s(θ) = 0 § analytically (see examples above) or § by use of numerical optimization algorithms Feb 22, 2013 Hackl, Econometrics 2, Lecture 1 27
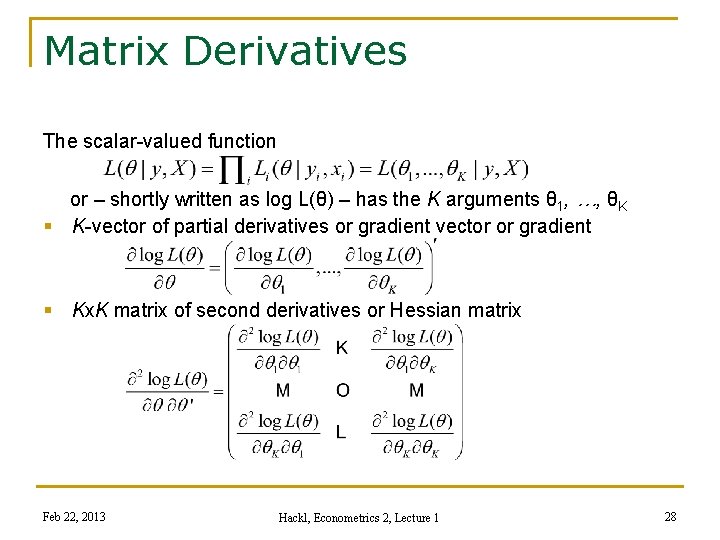
Matrix Derivatives The scalar-valued function or – shortly written as log L(θ) – has the K arguments θ 1, …, θK § K-vector of partial derivatives or gradient vector or gradient § Kx. K matrix of second derivatives or Hessian matrix Feb 22, 2013 Hackl, Econometrics 2, Lecture 1 28
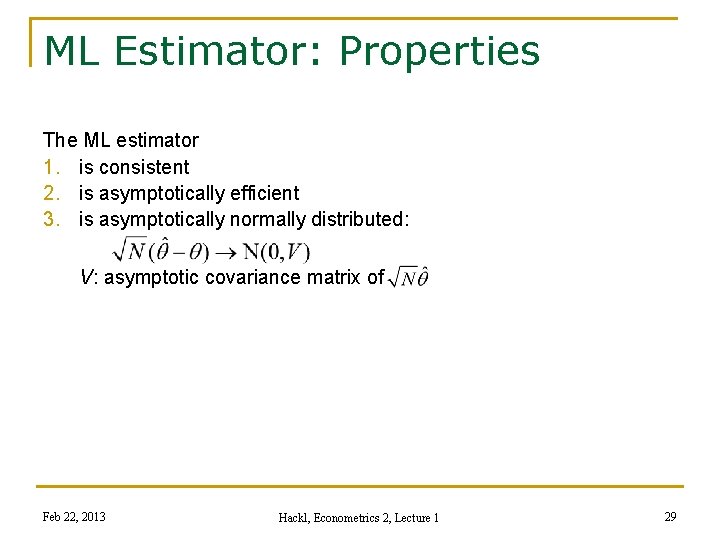
ML Estimator: Properties The ML estimator 1. is consistent 2. is asymptotically efficient 3. is asymptotically normally distributed: V: asymptotic covariance matrix of Feb 22, 2013 Hackl, Econometrics 2, Lecture 1 29
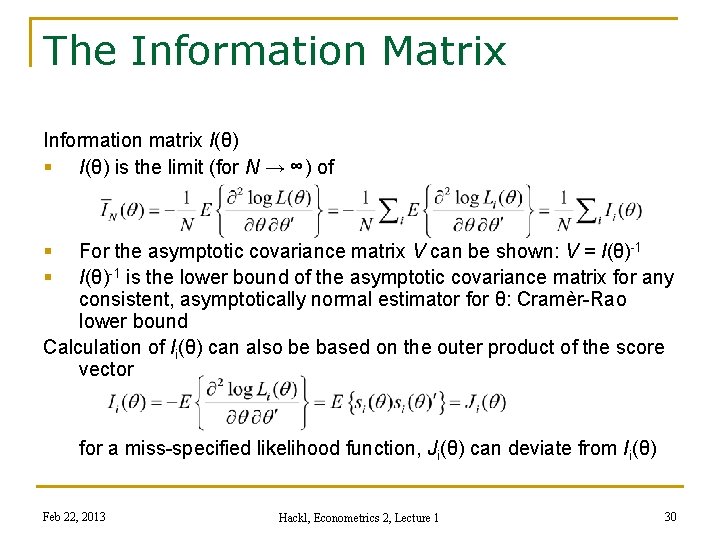
The Information Matrix Information matrix I(θ) § I(θ) is the limit (for N → ∞) of § § For the asymptotic covariance matrix V can be shown: V = I(θ)-1 is the lower bound of the asymptotic covariance matrix for any consistent, asymptotically normal estimator for θ: Cramèr-Rao lower bound Calculation of Ii(θ) can also be based on the outer product of the score vector for a miss-specified likelihood function, Ji(θ) can deviate from Ii(θ) Feb 22, 2013 Hackl, Econometrics 2, Lecture 1 30
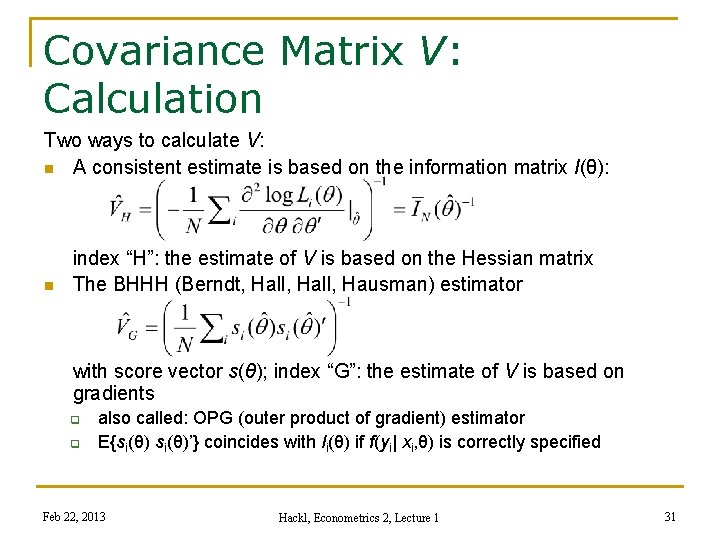
Covariance Matrix V: Calculation Two ways to calculate V: n A consistent estimate is based on the information matrix I(θ): n index “H”: the estimate of V is based on the Hessian matrix The BHHH (Berndt, Hall, Hausman) estimator with score vector s(θ); index “G”: the estimate of V is based on gradients q q also called: OPG (outer product of gradient) estimator E{si(θ)’} coincides with Ii(θ) if f(yi| xi, θ) is correctly specified Feb 22, 2013 Hackl, Econometrics 2, Lecture 1 31
Contents n n Linear Regression: A Review Estimation of Regression Parameters n Estimation Concepts ML Estimator: Idea and Illustrations ML Estimator: Notation and Properties ML Estimator: Two Examples Asymptotic Tests Some Diagnostic Tests n Quasi-maximum Likelihood Estimator n n n Feb 22, 2013 Hackl, Econometrics 2, Lecture 1 32
Urn Experiment: Once more Likelihood contribution of the i-th observation log Li(p) = yi log p + (1 - yi) log (1 – p) This gives scores and With E{yi} = p, the expected value turns out to be The asymptotic variance of the ML estimator V = I-1 = p(1 -p) Feb 22, 2013 Hackl, Econometrics 2, Lecture 1 33
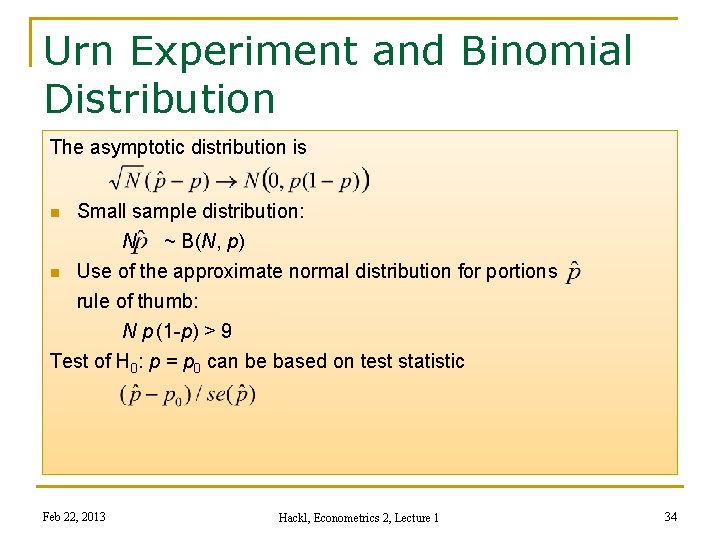
Urn Experiment and Binomial Distribution The asymptotic distribution is Small sample distribution: N ~ B(N, p) n Use of the approximate normal distribution for portions rule of thumb: N p (1 -p) > 9 Test of H 0: p = p 0 can be based on test statistic n Feb 22, 2013 Hackl, Econometrics 2, Lecture 1 34
Example: Normal Linear Regression Model yi = xi’β + εi with assumptions (A 1) – (A 5) Log-likelihood function Score contributions: The first-order conditions – setting both components of Σisi(β, σ²) to zero – give as ML estimators: the OLS estimator for β, the average squared residuals for σ²: Feb 22, 2013 Hackl, Econometrics 2, Lecture 1 35
Normal Linear Regression, cont’d Asymptotic covariance matrix: Contribution of the i-th observation (E{εi} = E{εi 3} = 0, E{εi 2} = σ², E{εi 4} = 3σ4) gives V = I(β, σ²)-1 = diag (σ²Σxx-1, 2σ4) with Σxx = lim (Σixixi‘)/N The ML estimate for β and σ² follow asymptotically Feb 22, 2013 Hackl, Econometrics 2, Lecture 1 36
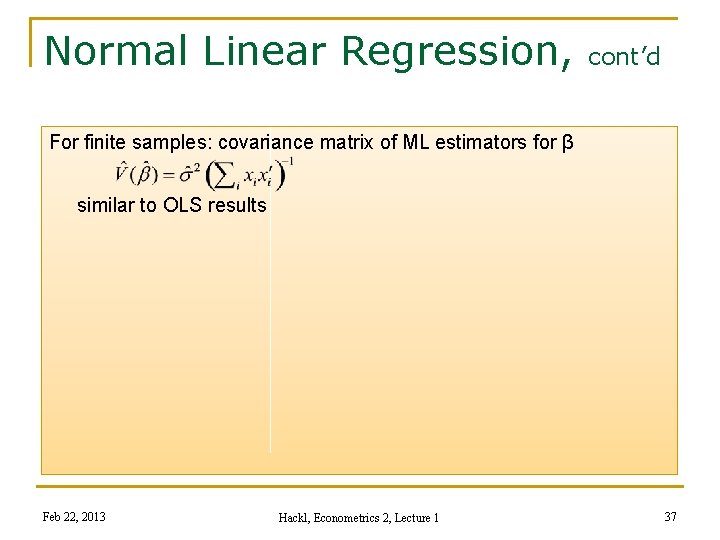
Normal Linear Regression, cont’d For finite samples: covariance matrix of ML estimators for β similar to OLS results Feb 22, 2013 Hackl, Econometrics 2, Lecture 1 37
Contents n n Linear Regression: A Review Estimation of Regression Parameters n Estimation Concepts ML Estimator: Idea and Illustrations ML Estimator: Notation and Properties ML Estimator: Two Examples Asymptotic Tests Some Diagnostic Tests n Quasi-maximum Likelihood Estimator n n n Feb 22, 2013 Hackl, Econometrics 2, Lecture 1 38
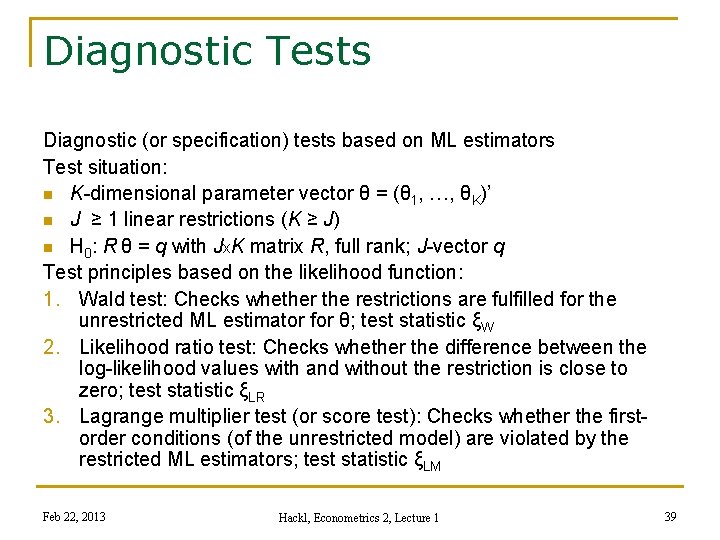
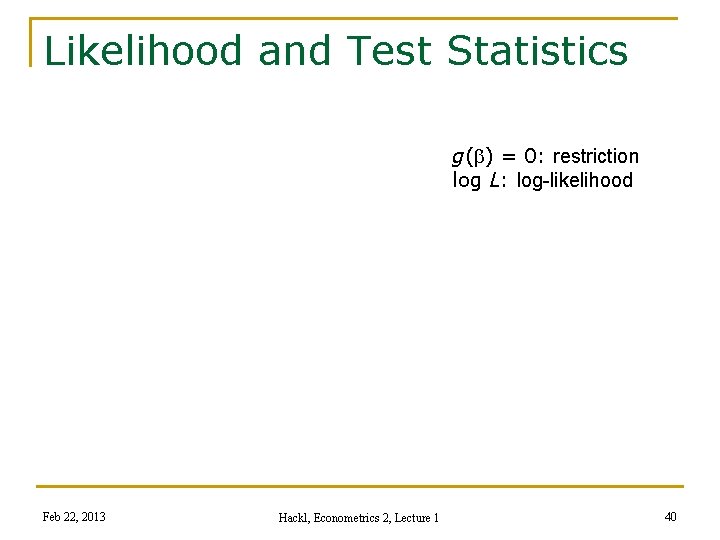
Diagnostic Tests Diagnostic (or specification) tests based on ML estimators Test situation: n K-dimensional parameter vector θ = (θ 1, …, θK)’ n J ≥ 1 linear restrictions (K ≥ J) n H 0: R θ = q with Jx. K matrix R, full rank; J-vector q Test principles based on the likelihood function: 1. Wald test: Checks whether the restrictions are fulfilled for the unrestricted ML estimator for θ; test statistic ξW 2. Likelihood ratio test: Checks whether the difference between the log-likelihood values with and without the restriction is close to zero; test statistic ξLR 3. Lagrange multiplier test (or score test): Checks whether the firstorder conditions (of the unrestricted model) are violated by the restricted ML estimators; test statistic ξLM Feb 22, 2013 Hackl, Econometrics 2, Lecture 1 39
Likelihood and Test Statistics g(b) = 0: restriction log L: log-likelihood Feb 22, 2013 Hackl, Econometrics 2, Lecture 1 40
The Asymptotic Tests Under H 0, the test statistics of all three tests n follow asymptotically, for finite sample size approximately, the Chisquare distribution with J df n The tests are asymptotically (large N) equivalent n Finite sample size: the values of the test statistics obey the relation ξW ≥ ξLR ≥ ξLM Choice of the test: criterion is computational effort 1. Wald test: Requires estimation only of the unrestricted model; e. g. , testing for omitted regressors: estimate the full model, test whether the coefficients of potentially omitted regressors are different from zero 2. Lagrange multiplier test: Requires estimation only of the restricted model; preferable if restrictions complicate estimation 3. Likelihood ratio test: Requires estimation of both the restricted and the unrestricted model Feb 22, 2013 Hackl, Econometrics 2, Lecture 1 41
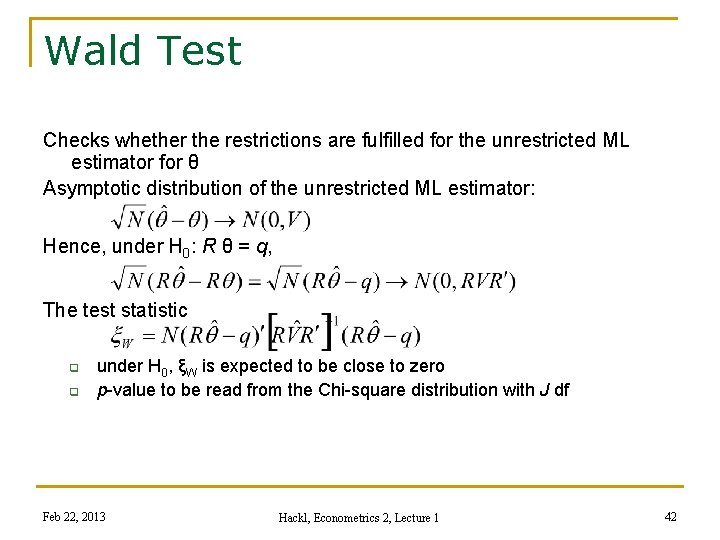
Wald Test Checks whether the restrictions are fulfilled for the unrestricted ML estimator for θ Asymptotic distribution of the unrestricted ML estimator: Hence, under H 0: R θ = q, The test statistic q q under H 0, ξW is expected to be close to zero p-value to be read from the Chi-square distribution with J df Feb 22, 2013 Hackl, Econometrics 2, Lecture 1 42
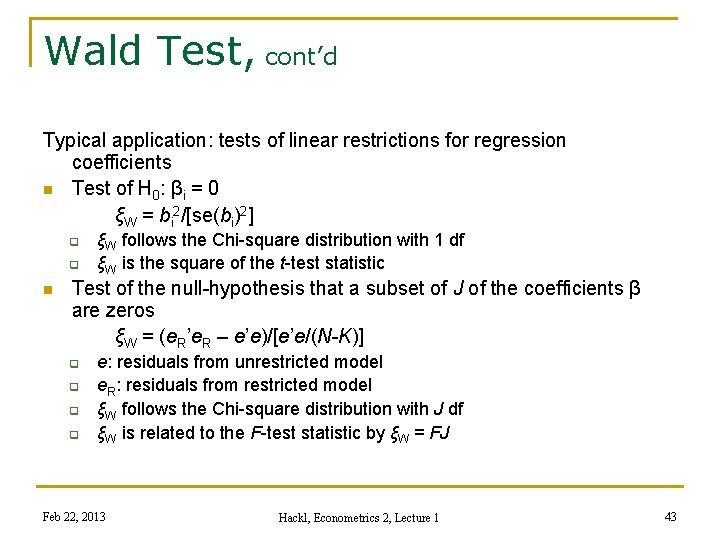
Wald Test, cont’d Typical application: tests of linear restrictions for regression coefficients n Test of H 0: βi = 0 ξW = bi 2/[se(bi)2] q q n ξW follows the Chi-square distribution with 1 df ξW is the square of the t-test statistic Test of the null-hypothesis that a subset of J of the coefficients β are zeros ξW = (e. R’e. R – e’e)/[e’e/(N-K)] q q e: residuals from unrestricted model e. R: residuals from restricted model ξW follows the Chi-square distribution with J df ξW is related to the F-test statistic by ξW = FJ Feb 22, 2013 Hackl, Econometrics 2, Lecture 1 43
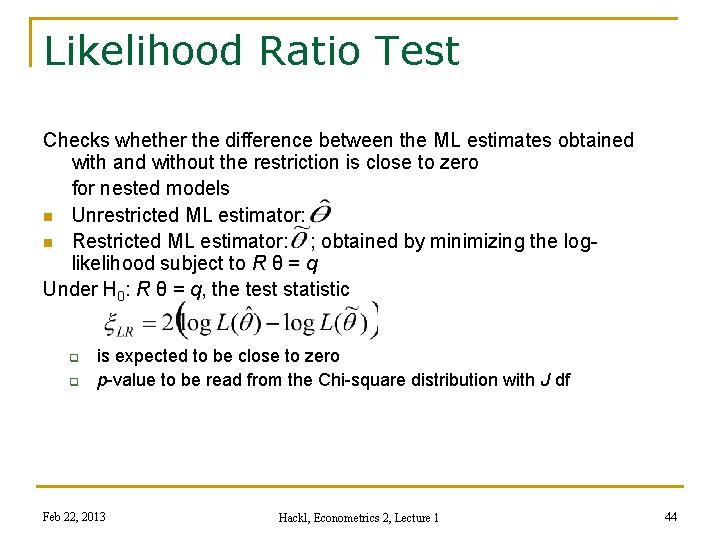
Likelihood Ratio Test Checks whether the difference between the ML estimates obtained with and without the restriction is close to zero for nested models n Unrestricted ML estimator: n Restricted ML estimator: ; obtained by minimizing the loglikelihood subject to R θ = q Under H 0: R θ = q, the test statistic q q is expected to be close to zero p-value to be read from the Chi-square distribution with J df Feb 22, 2013 Hackl, Econometrics 2, Lecture 1 44
Likelihood Ratio Test, cont’d Test of linear restrictions for regression coefficients n Test of the null-hypothesis that J linear restrictions of the coefficients β are valid ξLR = N log(e. R’e. R/e’e) q q q n e: residuals from unrestricted model e. R: residuals from restricted model ξLR follows the Chi-square distribution with J df Requires that the restricted model is nested within the unrestricted model Feb 22, 2013 Hackl, Econometrics 2, Lecture 1 45
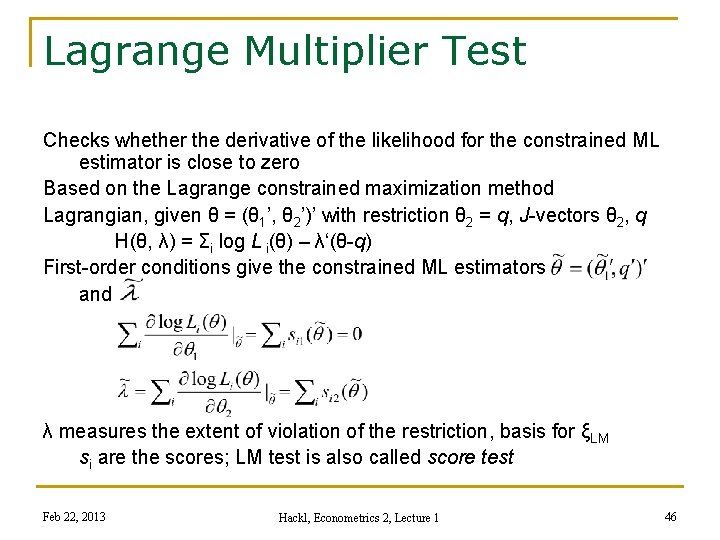
Lagrange Multiplier Test Checks whether the derivative of the likelihood for the constrained ML estimator is close to zero Based on the Lagrange constrained maximization method Lagrangian, given θ = (θ 1’, θ 2’)’ with restriction θ 2 = q, J-vectors θ 2, q H(θ, λ) = Σi log L i(θ) – λ‘(θ-q) First-order conditions give the constrained ML estimators and λ measures the extent of violation of the restriction, basis for ξLM si are the scores; LM test is also called score test Feb 22, 2013 Hackl, Econometrics 2, Lecture 1 46
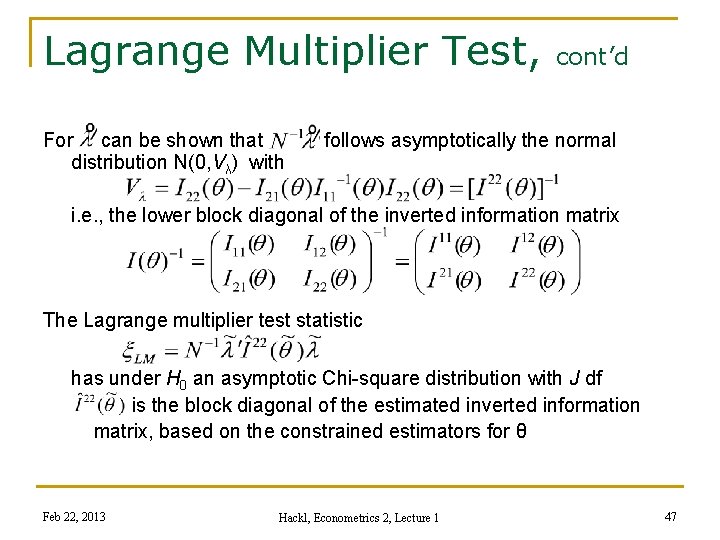
Lagrange Multiplier Test, For can be shown that distribution N(0, Vλ) with cont’d follows asymptotically the normal i. e. , the lower block diagonal of the inverted information matrix The Lagrange multiplier test statistic has under H 0 an asymptotic Chi-square distribution with J df is the block diagonal of the estimated inverted information matrix, based on the constrained estimators for θ Feb 22, 2013 Hackl, Econometrics 2, Lecture 1 47
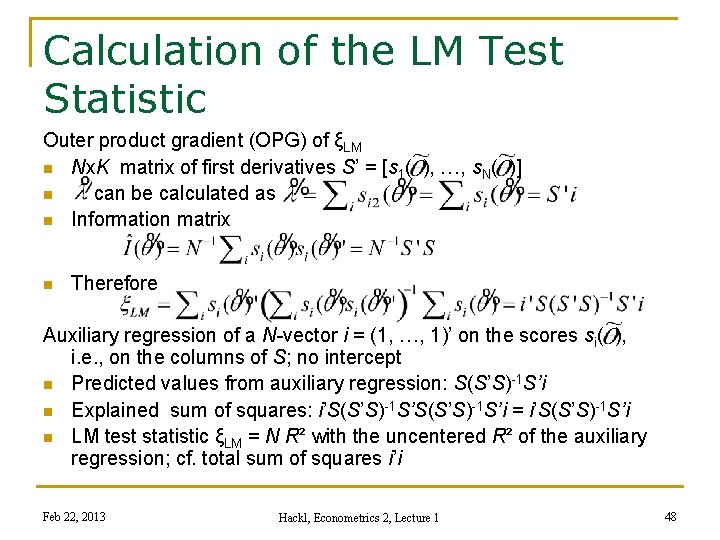
Calculation of the LM Test Statistic Outer product gradient (OPG) of ξLM n Nx. K matrix of first derivatives S’ = [s 1( ), …, s. N( )] n can be calculated as n Information matrix n Therefore Auxiliary regression of a N-vector i = (1, …, 1)’ on the scores si( ), i. e. , on the columns of S; no intercept n Predicted values from auxiliary regression: S(S’S)-1 S’i n Explained sum of squares: i’S(S’S)-1 S’i = i’S(S’S)-1 S’i n LM test statistic ξLM = N R² with the uncentered R² of the auxiliary regression; cf. total sum of squares i’i Feb 22, 2013 Hackl, Econometrics 2, Lecture 1 48
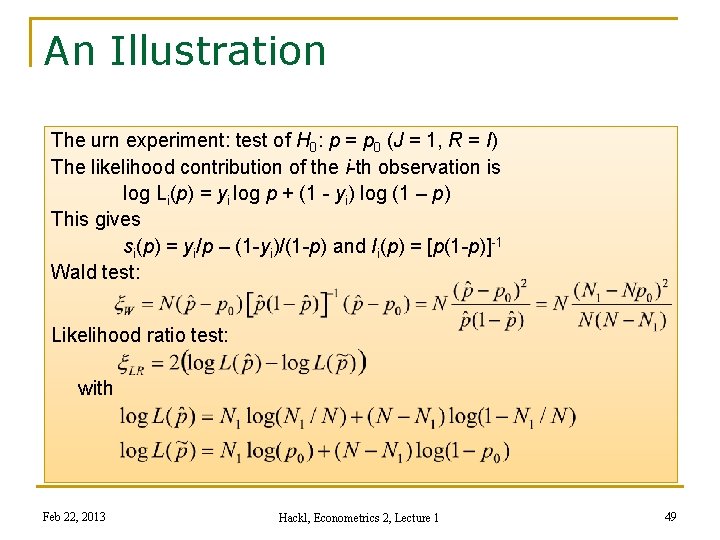
An Illustration The urn experiment: test of H 0: p = p 0 (J = 1, R = I) The likelihood contribution of the i-th observation is log Li(p) = yi log p + (1 - yi) log (1 – p) This gives si(p) = yi/p – (1 -yi)/(1 -p) and Ii(p) = [p(1 -p)]-1 Wald test: Likelihood ratio test: with Feb 22, 2013 Hackl, Econometrics 2, Lecture 1 49
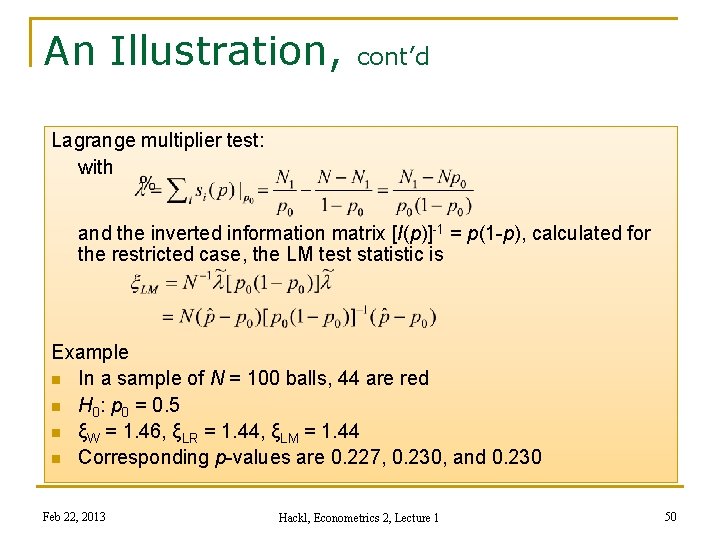
An Illustration, cont’d Lagrange multiplier test: with and the inverted information matrix [I(p)]-1 = p(1 -p), calculated for the restricted case, the LM test statistic is Example n In a sample of N = 100 balls, 44 are red n H 0: p 0 = 0. 5 n ξW = 1. 46, ξLR = 1. 44, ξLM = 1. 44 n Corresponding p-values are 0. 227, 0. 230, and 0. 230 Feb 22, 2013 Hackl, Econometrics 2, Lecture 1 50
Contents n n Linear Regression: A Review Estimation of Regression Parameters n Estimation Concepts ML Estimator: Idea and Illustrations ML Estimator: Notation and Properties ML Estimator: Two Examples Asymptotic Tests Some Diagnostic Tests n Quasi-maximum Likelihood Estimator n n n Feb 22, 2013 Hackl, Econometrics 2, Lecture 1 51
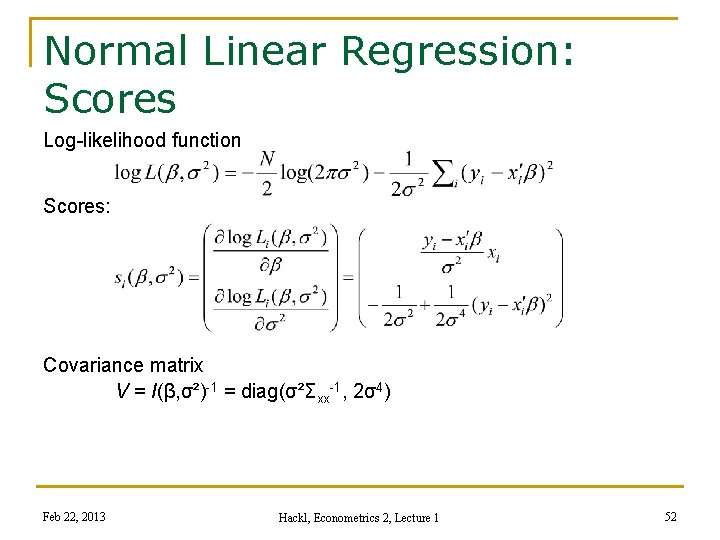
Normal Linear Regression: Scores Log-likelihood function Scores: Covariance matrix V = I(β, σ²)-1 = diag(σ²Σxx-1, 2σ4) Feb 22, 2013 Hackl, Econometrics 2, Lecture 1 52
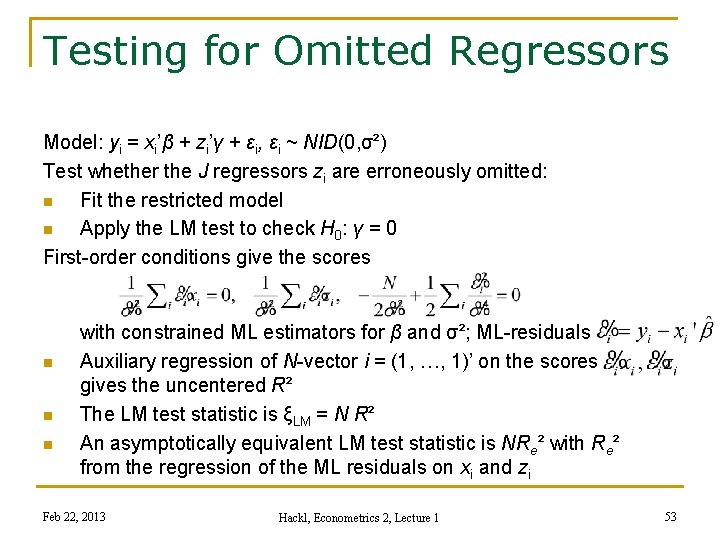
Testing for Omitted Regressors Model: yi = xi’β + zi’γ + εi, εi ~ NID(0, σ²) Test whether the J regressors zi are erroneously omitted: n Fit the restricted model n Apply the LM test to check H 0: γ = 0 First-order conditions give the scores n n n with constrained ML estimators for β and σ²; ML-residuals Auxiliary regression of N-vector i = (1, …, 1)’ on the scores gives the uncentered R² The LM test statistic is ξLM = N R² An asymptotically equivalent LM test statistic is NRe² with Re² from the regression of the ML residuals on xi and zi Feb 22, 2013 Hackl, Econometrics 2, Lecture 1 53
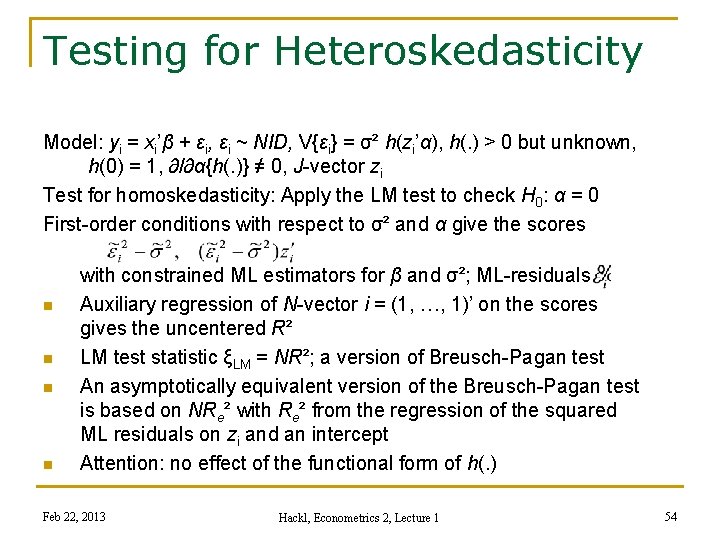
Testing for Heteroskedasticity Model: yi = xi’β + εi, εi ~ NID, V{εi} = σ² h(zi’α), h(. ) > 0 but unknown, h(0) = 1, ∂/∂α{h(. )} ≠ 0, J-vector zi Test for homoskedasticity: Apply the LM test to check H 0: α = 0 First-order conditions with respect to σ² and α give the scores n n with constrained ML estimators for β and σ²; ML-residuals Auxiliary regression of N-vector i = (1, …, 1)’ on the scores gives the uncentered R² LM test statistic ξLM = NR²; a version of Breusch-Pagan test An asymptotically equivalent version of the Breusch-Pagan test is based on NRe² with Re² from the regression of the squared ML residuals on zi and an intercept Attention: no effect of the functional form of h(. ) Feb 22, 2013 Hackl, Econometrics 2, Lecture 1 54
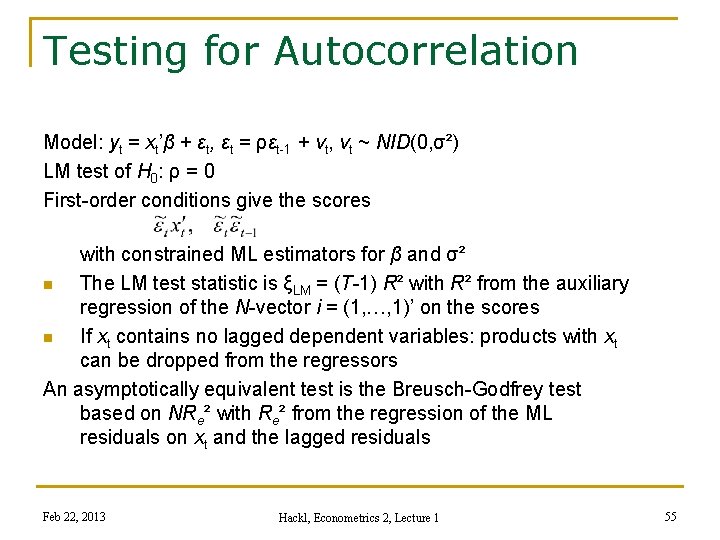
Testing for Autocorrelation Model: yt = xt’β + εt, εt = ρεt-1 + vt, vt ~ NID(0, σ²) LM test of H 0: ρ = 0 First-order conditions give the scores with constrained ML estimators for β and σ² n The LM test statistic is ξLM = (T-1) R² with R² from the auxiliary regression of the N-vector i = (1, …, 1)’ on the scores n If xt contains no lagged dependent variables: products with xt can be dropped from the regressors An asymptotically equivalent test is the Breusch-Godfrey test based on NRe² with Re² from the regression of the ML residuals on xt and the lagged residuals Feb 22, 2013 Hackl, Econometrics 2, Lecture 1 55
Contents n n Linear Regression: A Review Estimation of Regression Parameters n Estimation Concepts ML Estimator: Idea and Illustrations ML Estimator: Notation and Properties ML Estimator: Two Examples Asymptotic Tests Some Diagnostic Tests n Quasi-maximum Likelihood Estimator n n n Feb 22, 2013 Hackl, Econometrics 2, Lecture 1 56
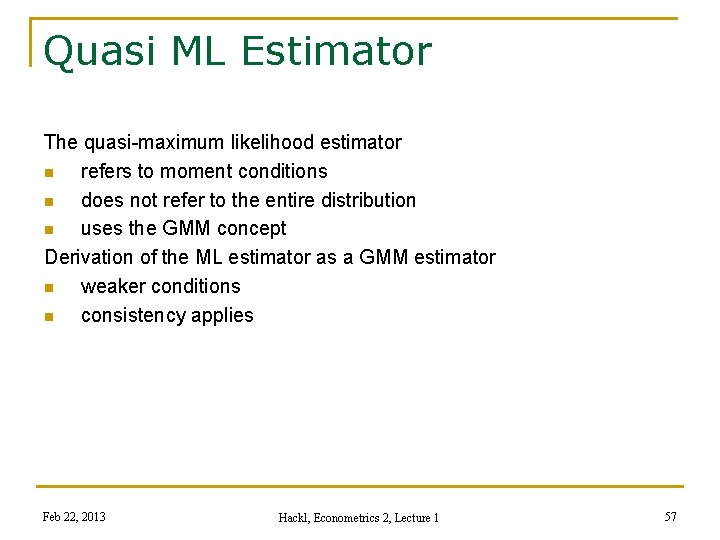
Quasi ML Estimator The quasi-maximum likelihood estimator n refers to moment conditions n does not refer to the entire distribution n uses the GMM concept Derivation of the ML estimator as a GMM estimator n weaker conditions n consistency applies Feb 22, 2013 Hackl, Econometrics 2, Lecture 1 57
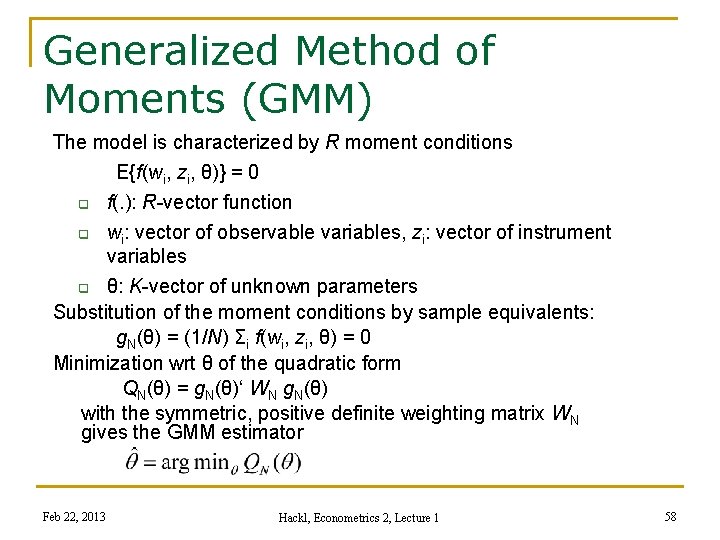
Generalized Method of Moments (GMM) The model is characterized by R moment conditions E{f(wi, zi, θ)} = 0 f(. ): R-vector function q wi: vector of observable variables, zi: vector of instrument variables q θ: K-vector of unknown parameters Substitution of the moment conditions by sample equivalents: g. N(θ) = (1/N) Σi f(wi, zi, θ) = 0 Minimization wrt θ of the quadratic form QN(θ) = g. N(θ)‘ WN g. N(θ) with the symmetric, positive definite weighting matrix WN gives the GMM estimator q Feb 22, 2013 Hackl, Econometrics 2, Lecture 1 58
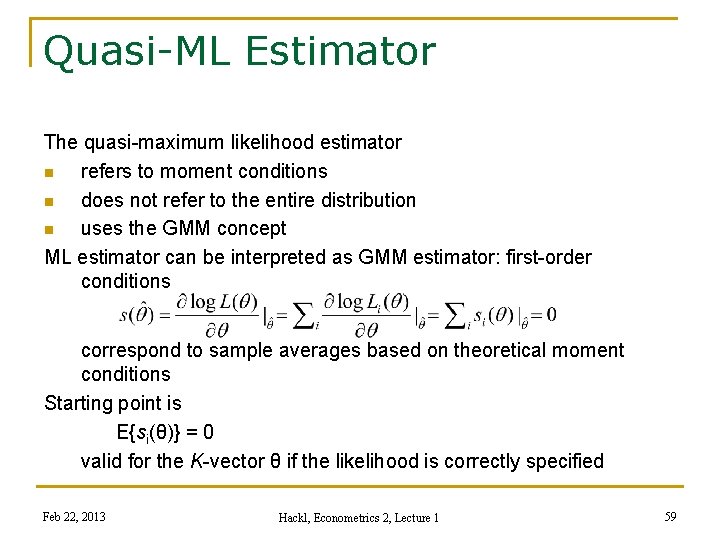
Quasi-ML Estimator The quasi-maximum likelihood estimator n refers to moment conditions n does not refer to the entire distribution n uses the GMM concept ML estimator can be interpreted as GMM estimator: first-order conditions correspond to sample averages based on theoretical moment conditions Starting point is E{si(θ)} = 0 valid for the K-vector θ if the likelihood is correctly specified Feb 22, 2013 Hackl, Econometrics 2, Lecture 1 59
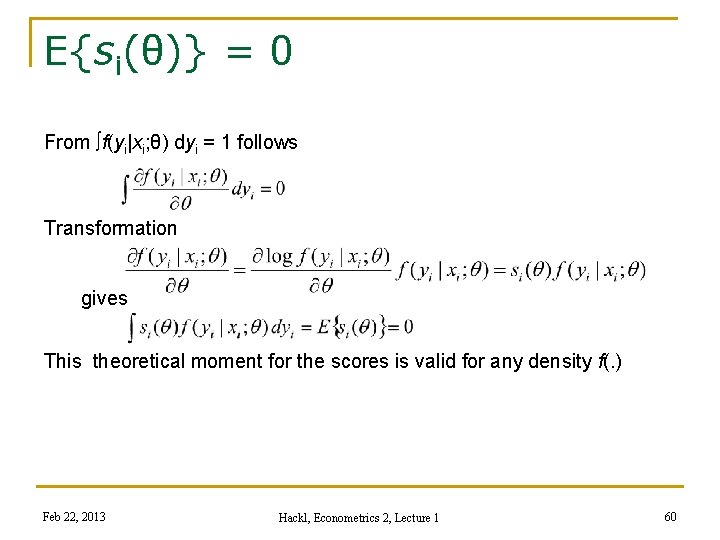
E{si(θ)} = 0 From ∫f(yi|xi; θ) dyi = 1 follows Transformation gives This theoretical moment for the scores is valid for any density f(. ) Feb 22, 2013 Hackl, Econometrics 2, Lecture 1 60
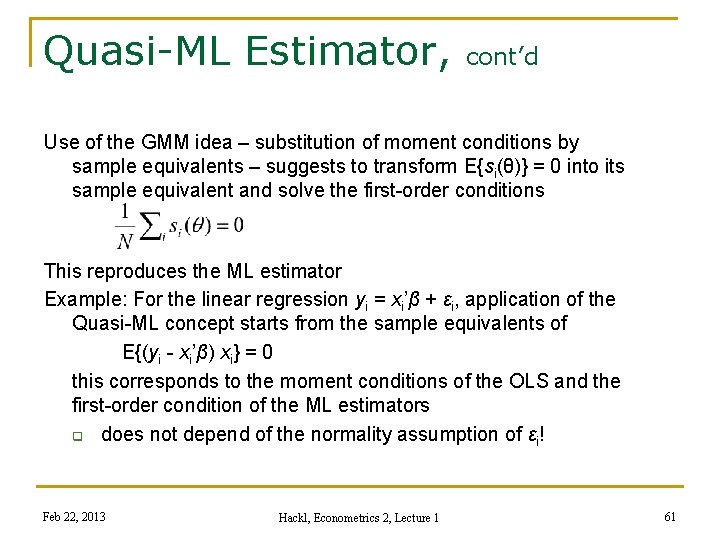
Quasi-ML Estimator, cont’d Use of the GMM idea – substitution of moment conditions by sample equivalents – suggests to transform E{si(θ)} = 0 into its sample equivalent and solve the first-order conditions This reproduces the ML estimator Example: For the linear regression yi = xi’β + εi, application of the Quasi-ML concept starts from the sample equivalents of E{(yi - xi’β) xi} = 0 this corresponds to the moment conditions of the OLS and the first-order condition of the ML estimators q does not depend of the normality assumption of εi! Feb 22, 2013 Hackl, Econometrics 2, Lecture 1 61
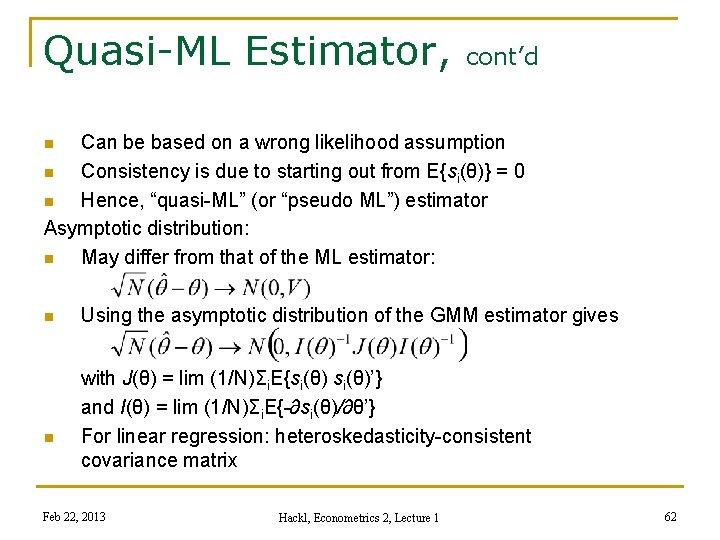
Quasi-ML Estimator, cont’d Can be based on a wrong likelihood assumption n Consistency is due to starting out from E{si(θ)} = 0 n Hence, “quasi-ML” (or “pseudo ML”) estimator Asymptotic distribution: n May differ from that of the ML estimator: n n n Using the asymptotic distribution of the GMM estimator gives with J(θ) = lim (1/N)Σi. E{si(θ)’} and I(θ) = lim (1/N)Σi. E{-∂si(θ)/∂θ’} For linear regression: heteroskedasticity-consistent covariance matrix Feb 22, 2013 Hackl, Econometrics 2, Lecture 1 62
Your Homework 1. Open the Greene sample file “greene 7_8, Gasoline price and consumption”, offered within the Gretl system. The variables to be used in the following are: G = total U. S. gasoline consumption, computed as total expenditure divided by price index; Pg = price index for gasoline; Y = per capita disposable income; Pnc = price index for new cars; Puc = price index for used cars; Pop = U. S. total population in millions. Perform the following analyses and interpret the results: a. b. Produce and interpret the scatter plot of the per capita (p. c. ) gasoline consumption (Gpc) over the p. c. disposable income. Fit the linear regression for log(Gpc) with regressors log(Y), Pg, Pnc and Puc to the data and give an interpretation of the outcome. Feb 22, 2013 Hackl, Econometrics 2, Lecture 1 63
Your Homework, cont’d c. d. Test for autocorrelation of the error terms using the LM test statistic ξLM = (T-1) R² with R² from the auxiliary regression of the ML residuals on the lagged residuals with appropriately chosen lags. Test for autocorrelation using NRe² with Re² from the regression of the ML residuals on xt and the lagged residuals. 2. Assume that the errors εt of the linear regression yt = β 1 + β 2 xt + εt are NID(0, σ2) distributed. (a) Determine the log-likelihood function of the sample for t = 1, …, T; (b) show that the first-order conditions for the ML estimators have expectations zero for the true parameter values; (c) derive the asymptotic covariance matrix on the basis (i) of the information matrix and (ii) of the score vector; (d) derive the matrix S of scores for the omitted variable LM test [cf. eq. (6. 38) in Veebeek]. Feb 22, 2013 Hackl, Econometrics 2, Lecture 1 64