
Econ 3790 Business and Economics Statistics Instructor Yogesh

Econ 3790: Business and Economics Statistics Instructor: Yogesh Uppal Email: yuppal@ysu. edu
Chapter 9, Part A: Hypothesis Tests n n Developing Null and Alternative Hypotheses Type I and Type II Errors Population Mean: s Known Population Mean: s Unknown
Developing Null and Alternative Hypotheses n Hypothesis testing can be used to determine whether a statement about the value of a population parameter should or should not be rejected. n The null hypothesis, denoted by H 0 , is a tentative assumption about a population parameter. n The alternative hypothesis, denoted by Ha, is the opposite of what is stated in the null hypothesis. n The alternative hypothesis is what the test is attempting to establish.
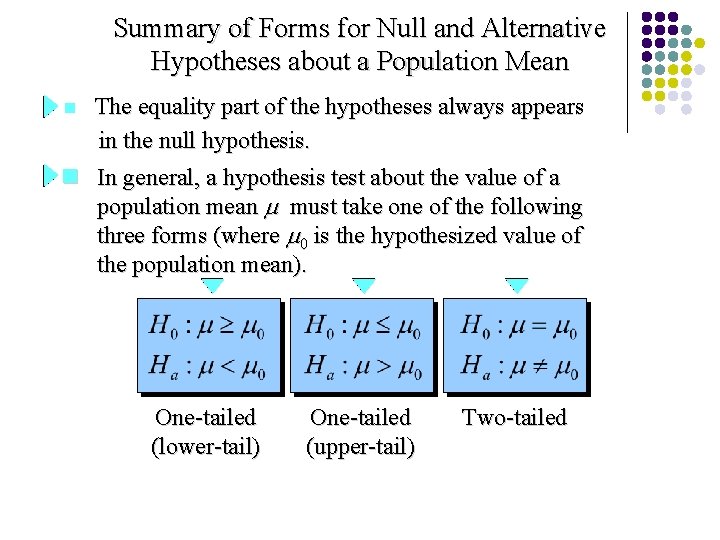
Summary of Forms for Null and Alternative Hypotheses about a Population Mean n The equality part of the hypotheses always appears in the null hypothesis. n In general, a hypothesis test about the value of a population mean must take one of the following three forms (where 0 is the hypothesized value of the population mean). One-tailed (lower-tail) One-tailed (upper-tail) Two-tailed
Type I Error n A Type I error is rejecting H 0 when it is true. Type II Error n A Type II error is accepting H 0 when it is false. n Statisticians avoid the risk of making a Type II error by using “do not reject H 0” and not “accept H 0”.
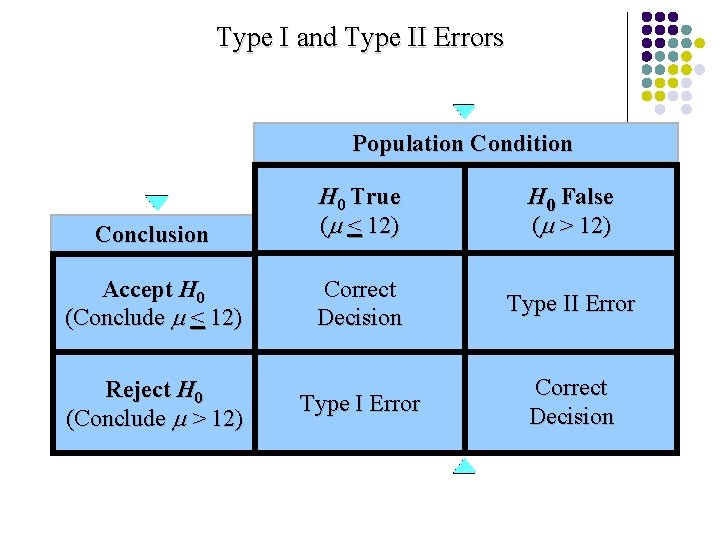
Type I and Type II Errors Population Condition Conclusion H 0 True ( < 12) H 0 False ( > 12) Accept H 0 (Conclude < 12) Correct Decision Type II Error Type I Error Correct Decision Reject H 0 (Conclude > 12)
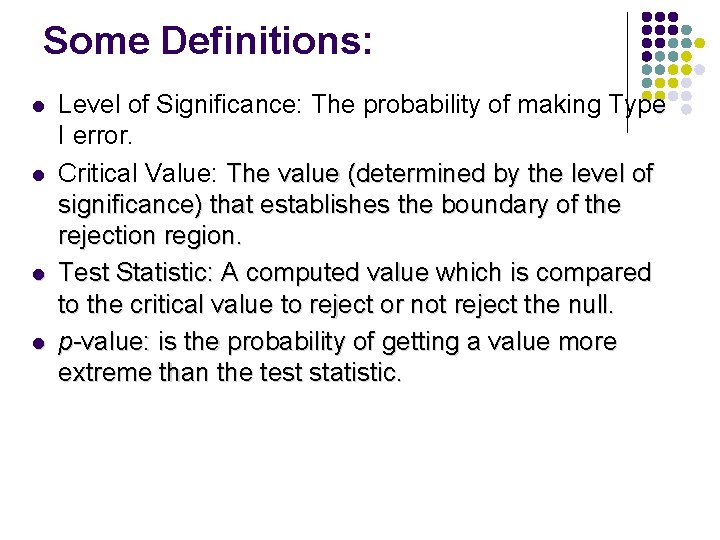
Some Definitions: l l Level of Significance: The probability of making Type I error. Critical Value: The value (determined by the level of significance) that establishes the boundary of the rejection region. Test Statistic: A computed value which is compared to the critical value to reject or not reject the null. p-value: is the probability of getting a value more extreme than the test statistic.
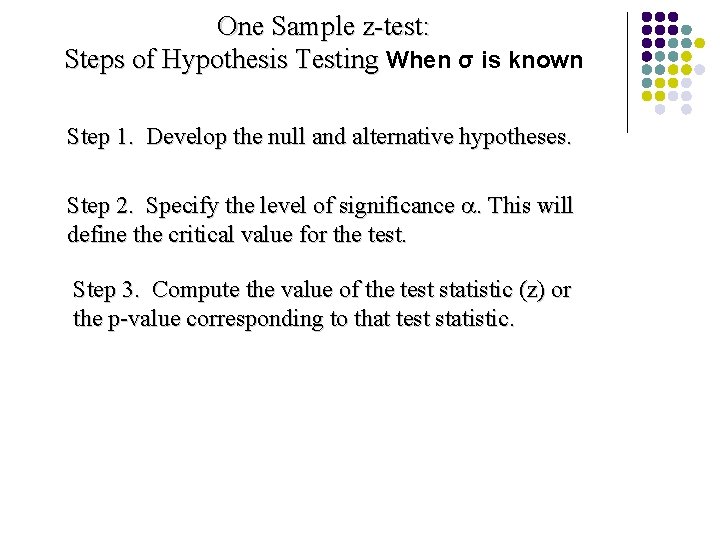
One Sample z-test: Steps of Hypothesis Testing When σ is known Step 1. Develop the null and alternative hypotheses. Step 2. Specify the level of significance . This will define the critical value for the test. Step 3. Compute the value of the test statistic (z) or the p-value corresponding to that test statistic.
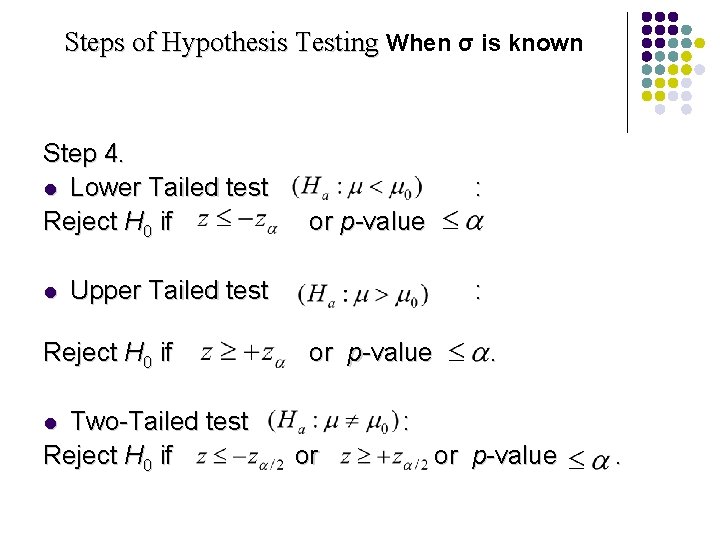
Steps of Hypothesis Testing When σ is known Step 4. l Lower Tailed test Reject H 0 if l or p-value Upper Tailed test Reject H 0 if Two-Tailed test Reject H 0 if : . : or p-value . : l or or p-value .
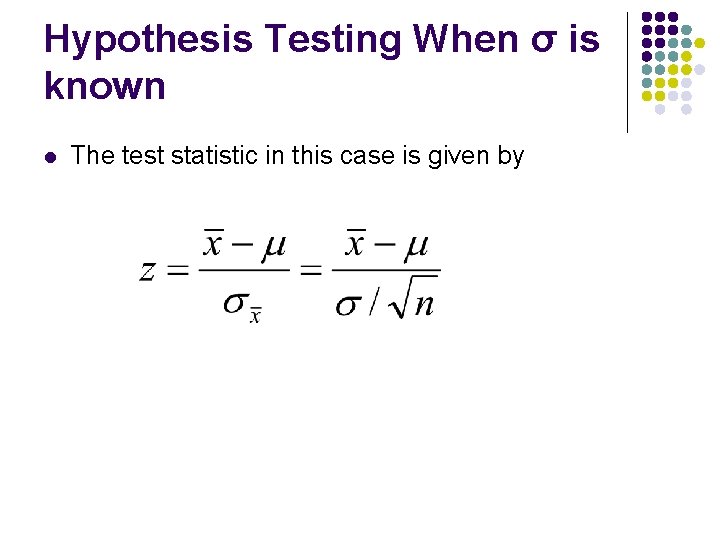
Hypothesis Testing When σ is known l The test statistic in this case is given by
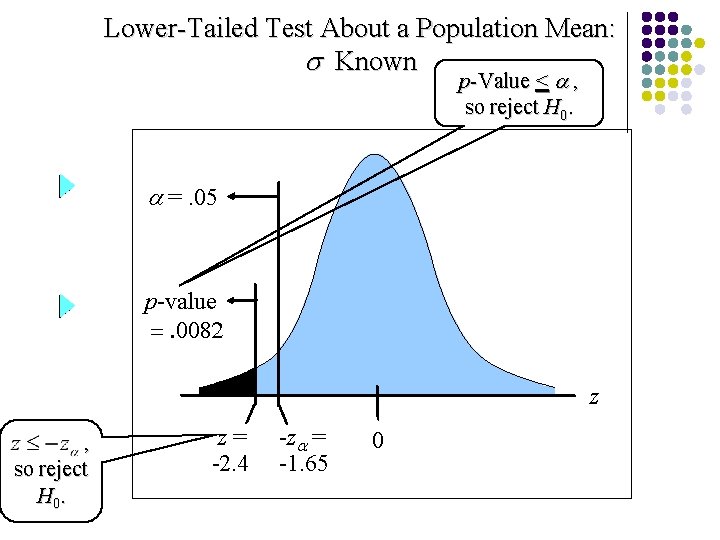
Lower-Tailed Test About a Population Mean: s Known p-Value < a , so reject H 0. a =. 05 p-value 8 z , so reject H 0. z= -2. 4 -za = -1. 65 0
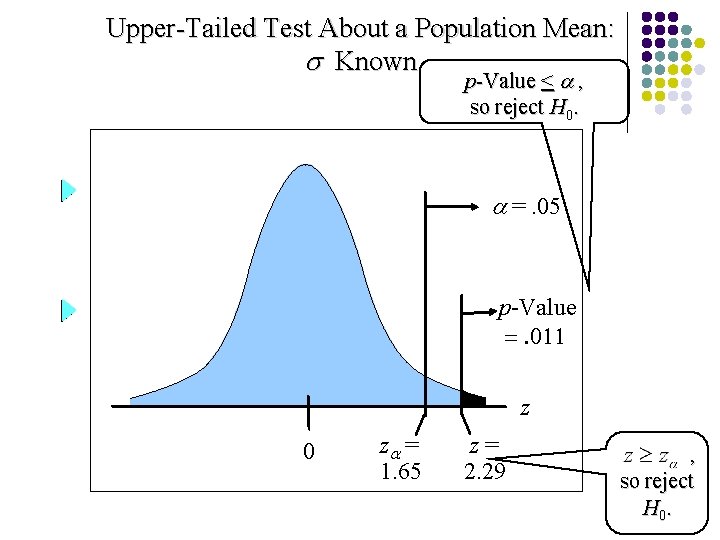
Upper-Tailed Test About a Population Mean: s Known p-Value < a , so reject H 0. a =. 05 p-Value 11 z 0 za = 1. 65 z= 2. 29 , so reject H 0.
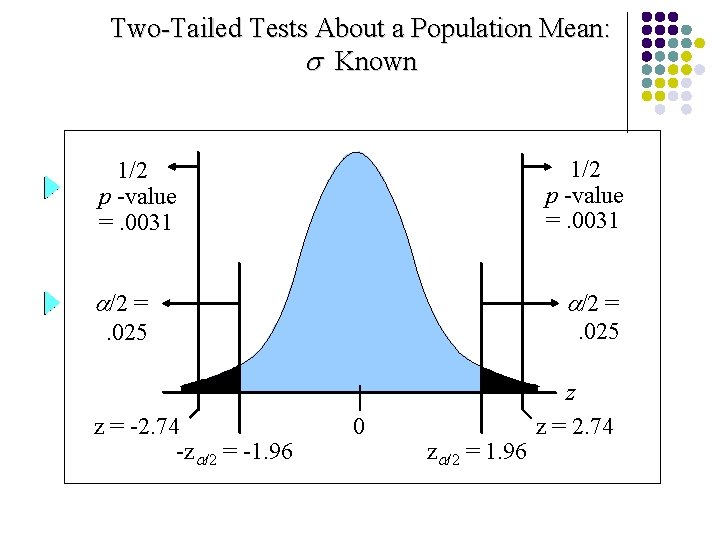
Two-Tailed Tests About a Population Mean: s Known 1/2 p -value =. 0031 a/2 = . 025 z z = -2. 74 -za/2 = -1. 96 0 za/2 = 1. 96 z = 2. 74
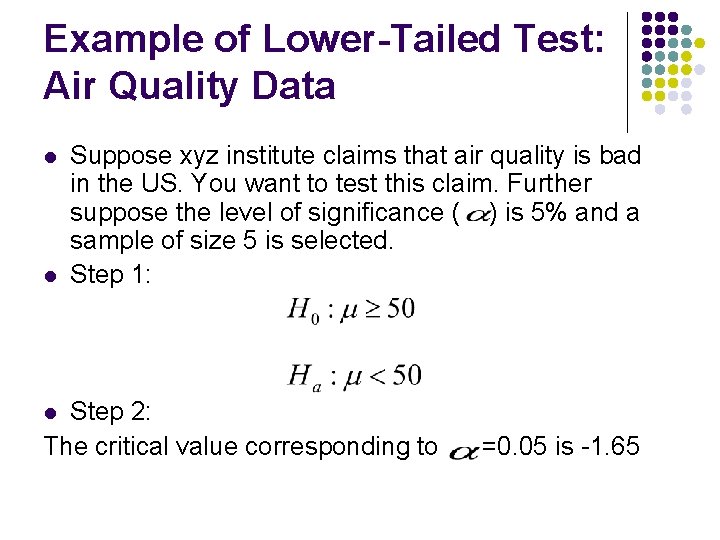
Example of Lower-Tailed Test: Air Quality Data l l Suppose xyz institute claims that air quality is bad in the US. You want to test this claim. Further suppose the level of significance ( ) is 5% and a sample of size 5 is selected. Step 1: Step 2: The critical value corresponding to l =0. 05 is -1. 65
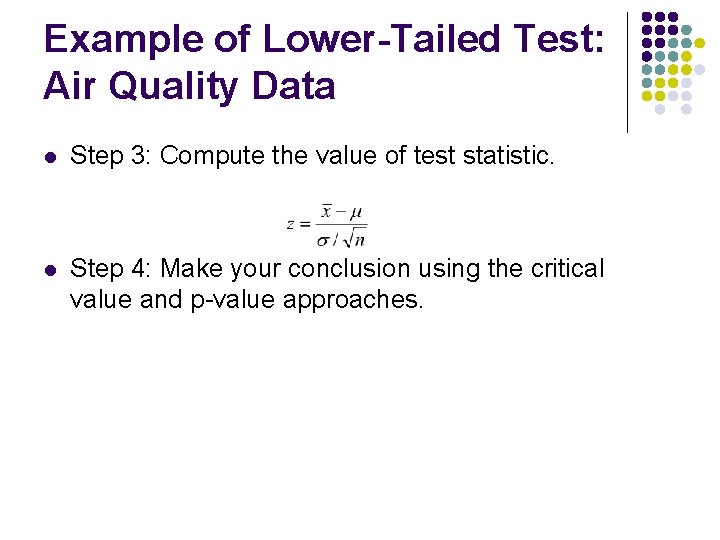
Example of Lower-Tailed Test: Air Quality Data l Step 3: Compute the value of test statistic. l Step 4: Make your conclusion using the critical value and p-value approaches.
Example of Two-Tailed Test: Air Quality Data l Suppose again xyz institute claimed that average air quality (average value of PMI) in the US is 48. Test this claim the 5% level of significance. l How does sample size affect your conclusions?
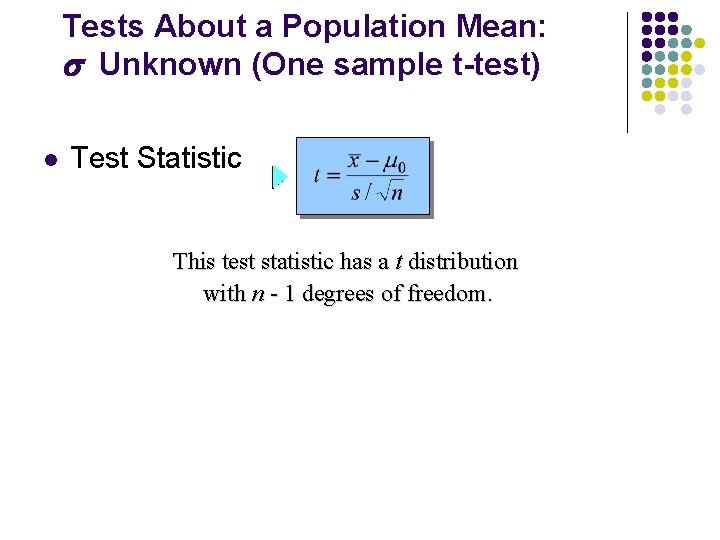
Tests About a Population Mean: s Unknown (One sample t-test) l Test Statistic This test statistic has a t distribution with n - 1 degrees of freedom.
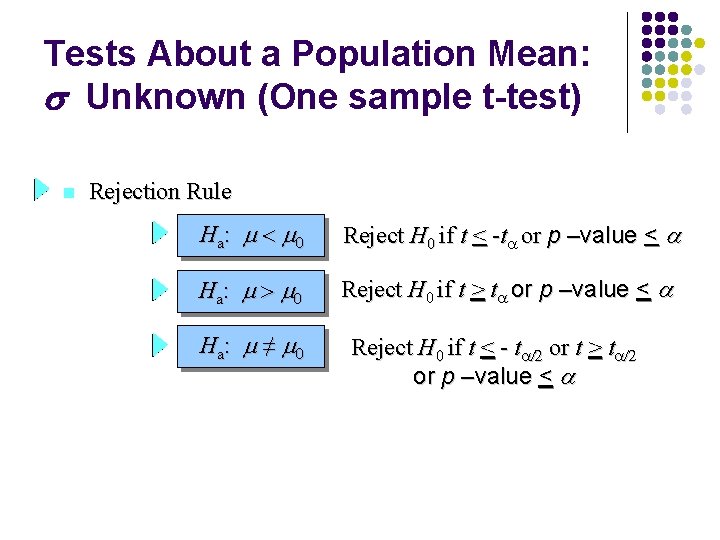
Tests About a Population Mean: s Unknown (One sample t-test) n Rejection Rule Ha: Reject H 0 if t < -t or p –value < a Ha: Reject H 0 if t > t or p –value < a Ha: ≠ Reject H 0 if t < - t or t > t or p –value < a
Example 1: One sample t-test l Suppose population standard deviation of air quality is not known. Test the claim that air quality in the US is bad using a sample size of 5.
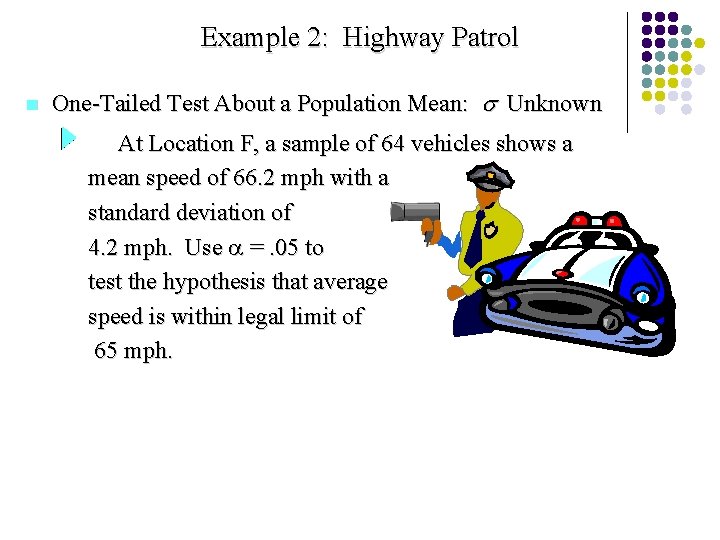
Example 2: Highway Patrol n One-Tailed Test About a Population Mean: s Unknown At Location F, a sample of 64 vehicles shows a mean speed of 66. 2 mph with a standard deviation of 4. 2 mph. Use =. 05 to test the hypothesis that average speed is within legal limit of 65 mph.
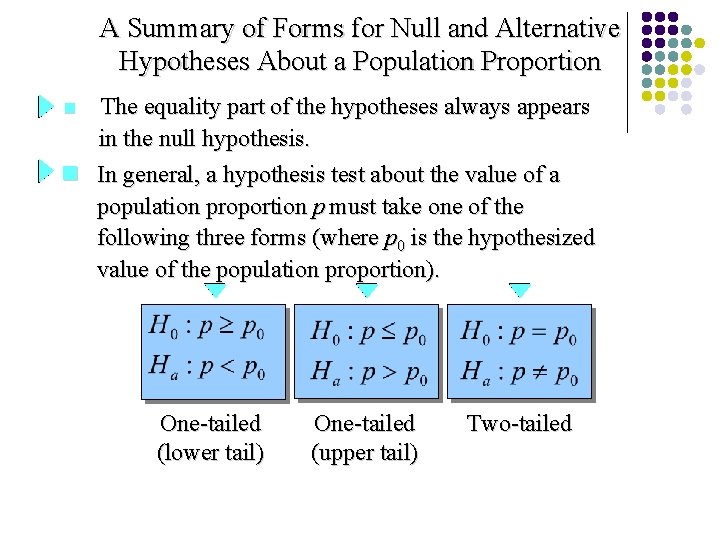
A Summary of Forms for Null and Alternative Hypotheses About a Population Proportion The equality part of the hypotheses always appears in the null hypothesis. n In general, a hypothesis test about the value of a population proportion p must take one of the following three forms (where p 0 is the hypothesized value of the population proportion). n One-tailed (lower tail) One-tailed (upper tail) Two-tailed
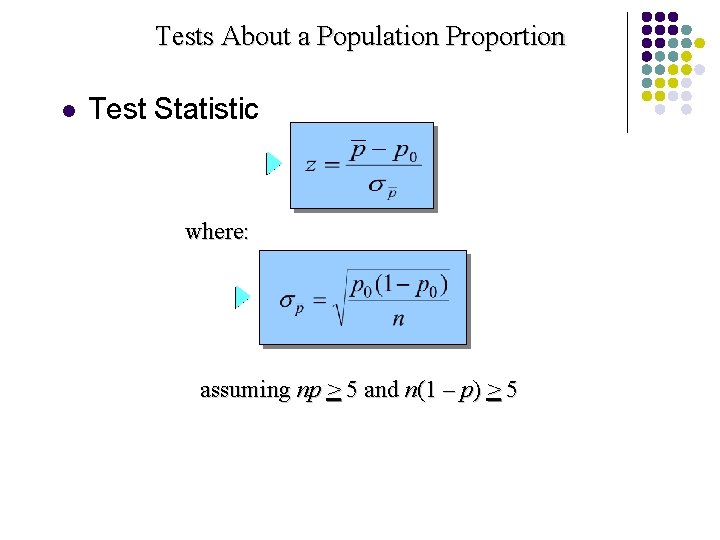
Tests About a Population Proportion l Test Statistic where: assuming np > 5 and n(1 – p) > 5
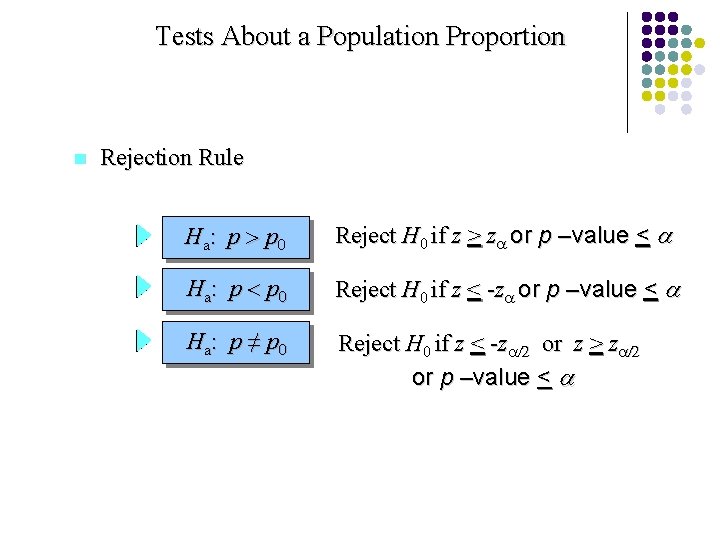
Tests About a Population Proportion n Rejection Rule Ha: p p Reject H 0 if z > z or p –value < a Ha: p p Reject H 0 if z < -z or p –value < a Ha: p ≠ p Reject H 0 if z < -z or z > z or p –value < a
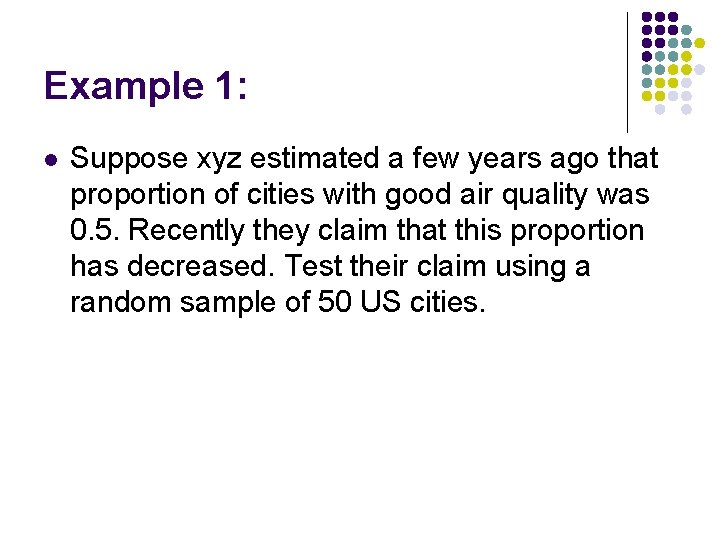
Example 1: l Suppose xyz estimated a few years ago that proportion of cities with good air quality was 0. 5. Recently they claim that this proportion has decreased. Test their claim using a random sample of 50 US cities.
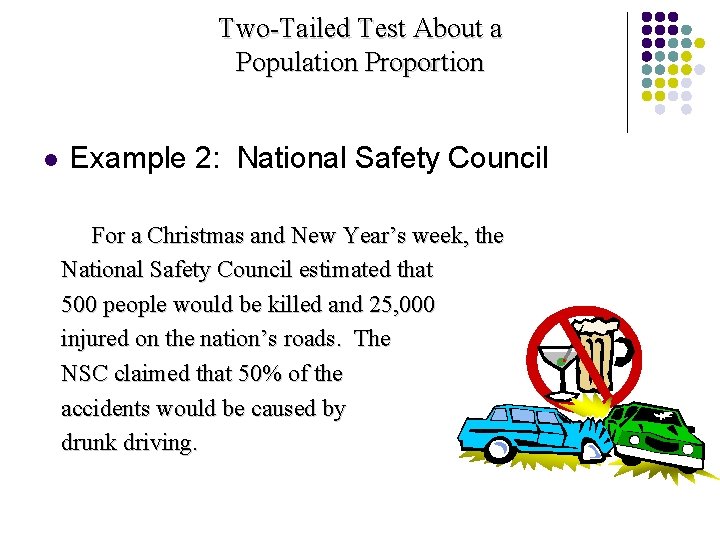
Two-Tailed Test About a Population Proportion l Example 2: National Safety Council For a Christmas and New Year’s week, the National Safety Council estimated that 500 people would be killed and 25, 000 injured on the nation’s roads. The NSC claimed that 50% of the accidents would be caused by drunk driving.
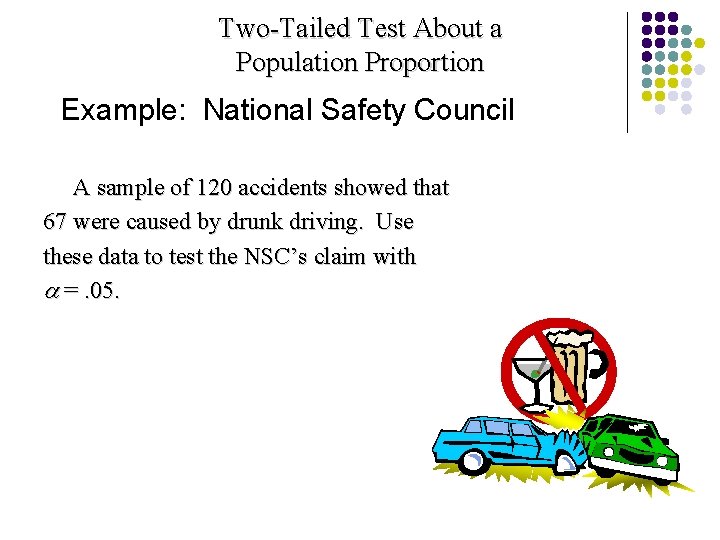
Two-Tailed Test About a Population Proportion Example: National Safety Council A sample of 120 accidents showed that 67 were caused by drunk driving. Use these data to test the NSC’s claim with a =. 05.
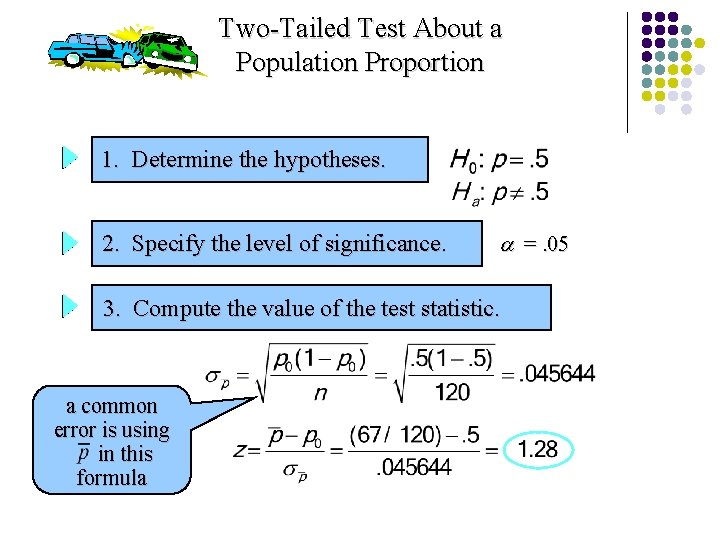
Two-Tailed Test About a Population Proportion 1. Determine the hypotheses. 2. Specify the level of significance. a =. 05 3. Compute the value of the test statistic. a common error is using in this formula
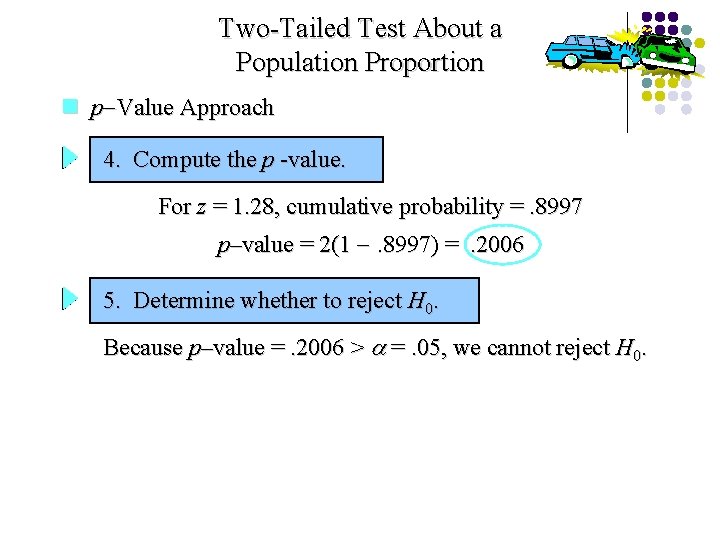
Two-Tailed Test About a Population Proportion n p-Value Approach 4. Compute the p -value. For z = 1. 28, cumulative probability =. 8997 p–value = 2(1 -. 8997) =. 2006 5. Determine whether to reject H 0. Because p–value =. 2006 > a =. 05, we cannot reject H 0.
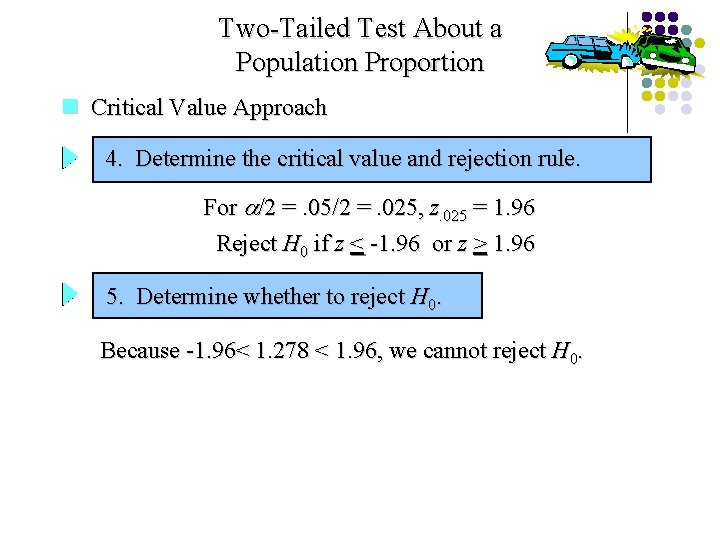
Two-Tailed Test About a Population Proportion n Critical Value Approach 4. Determine the critical value and rejection rule. For a/2 =. 05/2 =. 025, z. 025 = 1. 96 Reject H 0 if z < -1. 96 or z > 1. 96 5. Determine whether to reject H 0. Because -1. 96< 1. 278 < 1. 96, we cannot reject H 0.
- Slides: 29