ECOLOGY Honors Magnet Biology What is Ecology The

ECOLOGY Honors & Magnet Biology

What is Ecology? ? • The study of interactions that take place between organisms and their environment. • It explains how living organisms affect each other and the world they live in. 2

Habitat & Niche • Habitat is the place a plant or animal lives • Niche is an organism’s total way of life. That is, it’s role within it’s habitat • Competitive Exclusion Principle- no two organisms can occupy the same exact niche at the exact same time 3

The Nonliving Environment 5 • Abiotic factors- the nonliving parts of an organism’s environment. • Examples include air currents, temperature, moisture, light, and soil. • Abiotic factors affect an organism’s life. 4

The Living Environment 6 • Biotic factors- all the living organisms that inhabit an environment. • All organisms depend on others directly or indirectly for food, shelter, reproduction, or protection. 5

Abiotic or Biotic? Abiotic 8 6

Abiotic or Biotic? Biotic 10 7

Abiotic or Biotic? Abiotic 9 8

11 Levels of Organization 9

What are the Simplest Levels? • • Atom Molecule Organelle Cell Tissue Organ System Organism 12 10

Ch 36 -Ecological levels of organization Section 3 -1 Go to Section:

Levels of Organization 13 • Ecologists have organized the interactions an organism takes part in into different levels according to complexity. 12

1 st Level of Organization 14 • Organism: An individual living that is made of cells, uses energy, reproduces, responds, grows, and develops 13

2 nd Level of Organization 15 • Population: A group of organisms, all of the same species, which interbreed and live in the same place at the same time. 14

3 rd Level of Organization 16 • Biological Community: All the populations of different species that live in the same place at the same time. 15

4 th Level of Organization 17 • Ecosystem: Populations of plants and animals that interact with each other in a given area with the abiotic components of that area. (may be terrestrial or aquatic) 16

5 th Level of Organization • Biome: group of ecosystems with the same climate and similar dominant communities 18 17

6 th Level of Organization 19 • Biosphere: The portion of Earth that supports life. 18

20 The Biosphere • Life is found in air, on land, and in fresh and salt water. • The BIOSPHERE is the portion of Earth that supports living things. 19

What level of Organization? 24 Population 20

What level of Organization? 23 Community 21

Population Dynamics • Population: – All the individuals of a species that live together in an area • Demography: – The statistical study of populations, allows predictions to be made about how a population will change

Population Dynamics • Three Key Features of Populations – Size – Density – Dispersion

Three Key Features of Populations Size: number of individuals in an area
 - Death")
Three Key Features of Populations • Growth Rate: – Birth Rate (natality) - Death Rate (mortality) – How many individuals are born vs. how many die – Birth rate (b) − death rate (d) = rate of natural increase (r)

Three Key Features of Populations Density: measurement of population per unit area or unit volume Pop. Density = # of individuals ÷ unit of space

How Do You Affect Density? 1. Immigration: movement of individuals into a population 2. Emigration: movement of individuals out of a population 3. Density-dependent factors: Biotic factors in the environment that have an increasing effect as population size increases (disease, competition, parasites) 4. Density-independent factors: Abiotic factors in the environment that affect populations regardless of their density (temperature, weather)

Factors That Affect Future Population Growth Immigration Natality + + Population Emigration - Mortality

Three Key Features of Populations • Dispersion: describes the spacing of organisms relative to each other. Spacing depends on available resources. May be: – Clumped – Uniform – Random

Population Dispersion

How Are Populations Measured? • Population density = number of individuals in a given area or volume • Count all the individuals in a population • Estimate by sampling • Random sampling method – See ‘Interpreting Ecological Data’ WS • Mark-Recapture Method – We’ll either do a short lab or solve 1 -2 problems

Estimating Population Size: Mark and Recapture Method • Biologists use traps to capture the animals alive and mark them in some way. The animals are returned unharmed to their environment. • Over a long time period, the animals from the population are continued to be trapped and data is taken on how many are captured with tags. • A mathematical formula is then used to estimate population size: Estimate of Total Population = (total number captured) x (number marked) (total number recaptured with mark)

How Do Populations Grow? • Idealized models describe two kinds of population growth: 1. Exponential Growth- J curve 2. Logistic Growth- S surve
: – The maximum population size that can be")
Carrying Capacity • Carrying Capacity (k): – The maximum population size that can be supported by the available resources – There can only be as many organisms as the environmental resources can support

Exponential Growth Curve Figure 35. 3 A

Logistic Growth Curve

Concept Map Section 5 -1 Population ecology Population Growth can be Logistic growth Exponential growth characterized by No limits on growth Unlimited resources represented by Constant growth rate J-shaped curve characterized by Limits on growth which cause a Falling growth rate Go to Section: represented by S-shaped curve

Section Outline Section 5 -2 • Limits to Growth A. Population Limiting Factors 1. Density-Dependent Factors a. b. c. d. Competition Predation Parasitism and Disease Essentially anything “biotic” 2. Density-Independent Factors: a. abiotic- weather and climate, natural disasters (bottlenecks), human activities (CFC’s, Burning fossil fuels, etc). Go to Section:

Human Population Growth & historical events Industrial Revolution begins Agriculture begins Plowing and irrigation Bubonic plague

“Booms” and “Busts” What can be inferred from the graph? EXPLAIN! *This graph is on EVERY standardized test!

Reproductive Strategies • R Strategists § Short life span § Small body size § Reproduce quickly § Have many young § Little to no parental care § Ex: cockroaches, bacteria

Reproductive Strategies • K Strategists § Long life span § Large body size § Reproduce slowly § Have few young § Provides parental care § Ex: humans, elephants

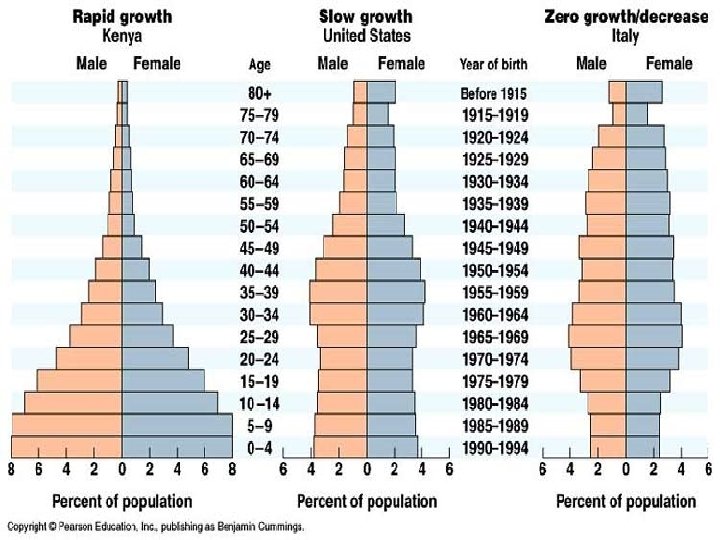
Age Distribution • Distribution of males and females in each age group of a population • Used to predict future population growth

Human Population Growth • J curve growth • Grows at a rate of about 80 million yearly – r =1. 3% • Why doesn’t environmental resistance take effect? – Altering their environment – Technological advances • The cultural revolution • The agricultural revolution • The industrial-medical revolution

The Human Population • Doubled three times in the last three centuries • About 6. 1 billion and may reach 9. 3 billion by the year 2050 • Improved health and technology have lowered death rates

Estimating Population Size • How do we find population sizes in a given area for species other than humans? • Method 1: Mark and Recapture (See lab and/or worksheet): – Formula: total # captured X # marked/ total # recaptured with mark • Method 2: Random sampling (see handout): Plot a desired area, randomly choose several smaller areas within plot, count the # in each smaller area, plot on grid, mathematically derive estimate of population size

Community = group of populations of different species living close enough to interact

Community Interactions • Competition • Predation • Symbiotic relationships – Mutualism-ex-Lichens – Commensalism-ex-lichens and a tree – Parasitism-ex-mosquitos and us!

Trophic Structures • The trophic structure of a community is determined by the feeding relationships between organisms. • Trophic levels = links in the trophic structure • The transfer of food energy from plants herbivores carnivores decomposers is called the food chain.

What limits the length of a food chain? • Inefficiency of energy transfer along chain • Long food chains less stable than short chains Fig. 53. 10

Dominant and Keystone Species exert strong controls on community structure. • Dominant Species have the highest biomass or are most abundant. • Keystone Species exert control by their importance in ecological niche. – Show HHMI video

Sea otters off the California coast eat sea urchins and keep them from decimating the kelp beds, home to many fish and crustaceans. • Removal of sea otters • Sea urchin increase and destroy kelp beds • Ecosystem collapses • Sea otter is a keystone species.

Flow of energy in ecosystem • Words to know: autotrophs, heterotrophs, herbivore, carnivore, omnivore, detrivore • Energy flow: food chains, food webs • Ecological pyramids (Only 10 % of available energy moves up the pyramid).

• Dominant species: species has the highest biomass or is the most abundant in the community • Keystone species: species exert control on community structure by their important ecological niches – Loss of sea otter increase sea urchins, destruction of kelp forests – Grizzly bear (transfer nutrients from sea land by salmon diet) – Prairie dogs (burrows, soil aeration, trim vegetation)

Disturbances influences species diversity and composition • A disturbance changes a community by removing organisms or changing resource availability (fire, drought, flood, storm, human activity) • Ecological succession: transitions in species composition in a certain area over ecological time

Two types of Succession 1. Primary Succession: a. Creates new colonies of organisms in new areas where no soil exists (EX: islands formed by volcanoes) b. takes a long time b/c soil(break down of rocks) c. Pioneer species – 1 st organisms to move into an area d. Community continues to grow until limiting factors, environ. change , or natural disasters e. Climax community - stable, mature; not much change occurring

2. Secondary succession a. Changes that occur to a community after a natural disaster or environmental destruction b. "Old" species die and new species may move in c. This one doesn’t take as long as primary because the soil is already established.

Primary Succession • Plants & animals invade where soil has not yet formed – Ex. colonization of volcanic island or glacier

Secondary Succession • Occurs when existing community is cleared by a disturbance that leaves soil intact – Ex. abandoned farm, forest fire Soon after fire. As this photo taken soon after the fire shows, the burn left a patchy landscape. Note the unburned trees in the distance. One year after fire. This photo of the same general area taken the following year indicates how rapidly the community began to recover. A variety of herbaceous plants, different from those in the former forest, cover the ground.

Flow of energy in ecosystem • Words to know: autotrophs, heterotrophs, herbivore, carnivore, omnivore, detrivore • Energy flow: food chains, food webs • Ecological pyramids - Only 10 % of available energy moves up the pyramid. The other 90% was: 1) used in metabolic processes; 2) ‘lost’ as heat.

Section 3 -2 Ecological Pyramids Energy Pyramid Shows the relative amount of energy available at each trophic level. Organisms use about 10 percent of this energy for life processes. The rest is lost as heat. Biomass Pyramid Represents the amount of living organic matter at each trophic level. Typically, the greatest biomass is at the base of the pyramid. Go to Section: Pyramid of Numbers Shows the relative number of individual organisms at each trophic level.

Global cycles • Water -evaporation, transpiration, precipitation • Carbon -photosynthesis and respiration • Nitrogen -relies on bacteria • Phosphorus -weathering of rock

The Water Cycle Section 3 -3 Water cycle Condensation Precipitation Evaporation Transpiration Runoff Seepage Root Uptake Go to Section:

Section 3 -2 Ecological Pyramids Energy Pyramid Shows the relative amount of energy available at each trophic level. Organisms use about 10 percent of this energy for life processes. The rest is lost as heat. Go to Section: Biomass Pyramid Represents the amount of living organic matter at each trophic level. Typically, the greatest biomass is at the base of the pyramid. Pyramid of Numbers Shows the relative number of individual organisms at each trophic level.

Carbon Cycle • Depends on two main processes. Photosynthesis and Respiration • Remember the equations for both!

Figure 3 -13 The Carbon Cycle Section 3 -3 Carbon Cycle CO 2 in Atmosphere CO 2 in Ocean Go to Section:

Nitrogen cycle • Most nitrogen is in the atmosphere • Plants can only use nitrogen in the form of ammonium or nitrate • Bacteria convert atmospheric nitrogen to ammonium or nitrates, which is absorbed by plants • There are other bacteria that can convert these molecules back to atmospheric nitrogen

Figure 3 -14 The Nitrogen Cycle Section 3 -3 Nitrogen Cycle N 2 in Atmosphere NH 3 Go to Section: NO 3 and NO 2 -

Phosphorus Cycle • Depends heavily on the weathering of rock • Plants absorb dissolved phosphate ions from the soil • Also, decomposers can return phosphates back to soil • Because weathering is a slow process, phosphorus is often a limiting nutrient to plant growth

Biomes Each set of Biomes is defined by a unique set of abiotic factors-particularly climateand has a characteristic ecological community.

Figure 4 -17 The World’s Major Land Biomes Section 4 -3 Go to Section: Biomes of the Earth Tropical rain forest Temperate grassland Temperate forest Tundra Tropical dry forest Desert Tropical savanna Temperate woodland shrubland Northwestern coniferous forest Mountains and ice caps Boreal forest (Taiga)

Ten Major Biomes Compare/Contrast Table Biome Precipitati Temper Soil Diversity Trees on 4 -3 ature Section Tropical high hot poor high dense Rain Forest Tropical Dry Forest Tropical Savanna Desert Temperate Grassland Shrubland (chaparral) Go to Section: Grasses variable mild rich Sparse ** tropical RF are the most diverse of all biomes moderate medium variable mild clay moderate sparse dense low variable poor moderate summer rich hot summer poor low, hot winter moderate sparse moderate absent sparse dense low medium absent

Temperate mode summer rich deciduous rate moderate, Forest winter cold high dense sparse Coniferou high s Forest (Boreal)inc ludes taiga summer mild, winter cold rocky, acidic low dense sparse Tundra Summer mild, winter cold poor low absent Medium **know-permafrost **biome classificati ons usually don’t include icecaps low

Figure 4 -17 Zones of a Marine Ecosystem Section 4 -4 Marine Ecosystems land 200 m Coastal ocean 1000 m Open ocean 4000 m 6000 m Ocean trench 10, 000 m Continental shelf Go to Section: Photic zone Continental slope and continental rise Abyssal plain Aphotic zone

• Aquatic ecosystems: – Freshwater: a-flowing, b-standing c-wetlands -Estuaries- where fresh water merges with salt water. Very diverse -Marine: Intertidal; Pelagic (photic and aphotic); benthic (area along ocean floor) Page 80 -81. The abyssal zone is the deepest region of the ocean (deepest point is over 7 miles deep). Why is the sea salty? Go to http: //www. myuniversalfacts. com/2006/05/why-is-sea-salty. html

Extension Work 25 - Create a foldable on the following Land Biomes: - Tropical Rain Forest Tropical Savanna Desert Temperate Grassland Temperate Woodland/ Shrubland Coniferous Forest Boreal Forest Tundra 79

Include the following information: • • • 26 Precipitation Temperature Soil Diversity Plants Animals 80

Causes of Ecological Problems • Acid Precipitation – Results from the presence of sulfur oxides and nitrogen oxides in the air – Come from the burning of fossil fuels • Greenhouse Effect – Due to a rise in atmospheric carbon dioxide and methane – Carbon dioxide released from the combustion of fossil fuel

More causes • Ozone depletion – Due to CFC’s used as refrigerants and propellants – CFC’s turn ozone into oxygen gas • Biological magnification – Because of pyramid of numbers, small concentrations of toxins in an environment become concentrated to dangerous levels in higher trophic organisms • Habitat destruction

Other things to know… • What is Biodiversity? – How have humans threatened biodiversity? Give some specific examples • What is Biological Magnification? http: //www. biologycorner. com/worksheets/article s/biological_magnification. html • What’s the difference between: • Renewable resources • Non-renewable resources – Give examples!
- Slides: 82