Ecology Ecosystem Characteristics Nutrient Cycling and Energy Flow


 is directly")


 of")


- Slides: 54
Ecology – Ecosystem Characteristics, Nutrient Cycling and Energy Flow
Let us consider ecosystems • We have looked at the biosphere, and the biomes within the biosphere, the populations and communities… • Now ecosystems. How do we define the term ecosystem? • Similar to our broad definition of ecology relationships between the physical environment and the organisms inhabiting a specific region
Modern Ecosystem Studies • The foundation for ecosystem analyses and most ecological studies is established based upon two general observable characteristics of nature • 1) Organisms form natural assemblages, each with somewhat predictable membership (remember the biomes), and • 2) Organisms are directly and indirectly linked based upon their feeding or trophic relationships
Perception of the World Around Us • It is easy to lose sight of the forest through the trees. Relationships among the members of an ecosystem can be quite complex and it is sometimes difficult to look at the totality of the system • However, Lotka did not lose sight of the system
Admittedly simple, it is also elegant What are the parts outlined by Lotka in this oversimplified diagram?
These relationships embody the basic ecosystem characteristics • Two major components of interest here • First is a function of energy flow in an ecosystem, that is, productivity and transfer of energy among organisms and the physical environment • Second is a function of the transfer and cycling of nutrients among organisms and the physical environment
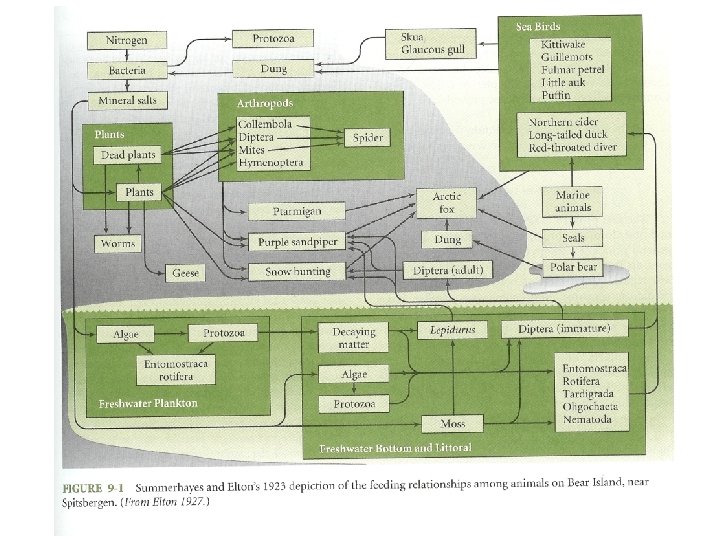
We have eluded to “simple” systems and descriptive studies • The slide that follows represents a description of a high latitude ecosystem • The trophic relationships are shown by connecting the members of the ecosystem and their food sources • Remember, this is supposed to be a simple system
So, how do we proceed? • The two components we have identified, energy and nutrients, are so tightly coupled that there is complete interdependence • The joint consideration of these two components was just not done historically – partially due to the lack of detailed analyses, and partly due to the complexity of most systems
Elucidation of boundaries • It is not just complexity that makes ecosystem studies difficult, but where do you draw the lines? Recall our difficulties with ecotones and communities! • That is, what do we include in the system, and what do we exclude from our consideration of an ecosystem? • How might we make this distinction? What type of system might allow us to draw ecosystem boundaries?
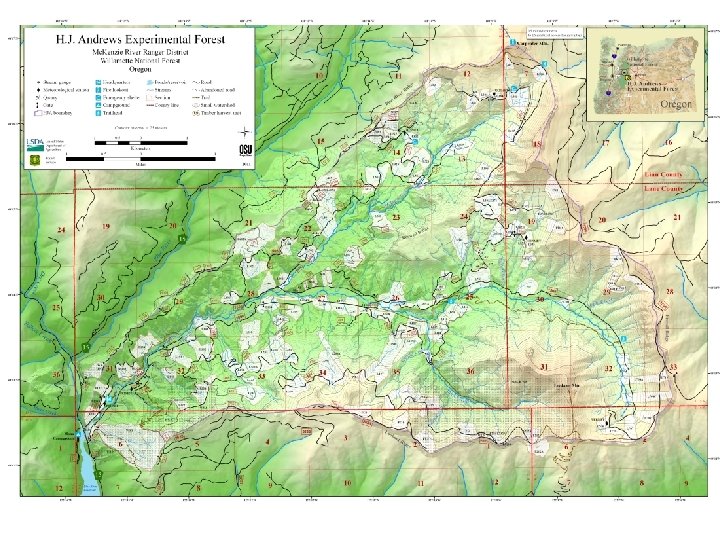
Watershed studies are simplest • Why? Why are watershed studies a “good place to start” when looking at boundaries and distinction among ecosystems? • Recall our field site, H. J. Andrews Experimental Forest – that is a single watershed
So, where do we begin? • Although energy and nutrient flow are realistically inseparable on a system wide scale, we can gather data by looking at the component parts (reductionist approach) • Study the individual and energy usage in a reductionist approach • Then extrapolate to the system level by putting the pieces back together
And, start at the bottom • A common method of comparing different ecosystems is to evaluate the relative amounts of net primary productivity (NPP) • By definition, this quantity is the total energy or nutrients accumulated (by an individual, population, or community) by growth and reproduction • Note that this is different than GPP (gross primary productivity)!
Quantifying NPP • The standard representation of this quantity is the difference between the gross primary productivity (GPP) and losses due to respiration • This is a measurable characteristic on an individual level, at least measured with some degree of accuracy
Look at this in terms of where the energy goes in one link of the web
Factors influencing photosynthesis • One of the most important factors – light intensity or light availability • We have eluded to this in the discussions of the photic zone and compensation depth measures • Saturation point is the level at which additional light (intensity) does not increase the rate of photosynthesis
What is photosynthetic efficiency? • The intensity of incident solar radiation of full sunlight is about ten times the saturation point, so, what percentage of the solar energy is actually used for growth and reproduction? • In general photosynthetic efficiency is very low, on the order of 1 to 2% (but note that this is about 10% of the useable solar radiation) • Most is reflected and the absorption of light by molecules other than our photosystem pigments (with subsequent re-radiation of that energy in the form of heat)
Temperature is also important Here, the light intensity (the three different curves) is directly related to the temperature regime and the uptake measures of carbon dioxide in the system.
Water may be a limiting resource • Effects are obvious – water is a key component to the photosynthetic pathway and if it is limiting, the process cannot continue effectively regardless of the amount of light or temperature available to the various species • Some forms exhibit phenomenal adaptations to limited water and really this is an issue of the ability of forms to survive in these habitats (remember our CAM and C 4 plants)
Finally, chemical nutrients may limit the net primary productivity • Generally reflects the limitations in nitrogen and/or phosphorus • Addition of these compounds often enhances the productivity of systems and generally, both are required to maximize the productivity • Can we determine the health of a system? We can measure availability of these nutrients to evaluate limitations to productivity (such as the Redfield ratio of N: P as dissolved inorganic compounds in the water)
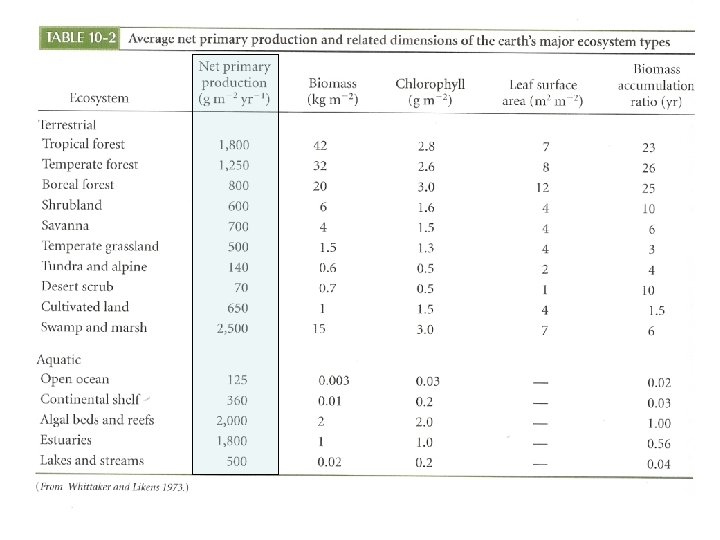
What about the Ecosystem Level? • As opposed to the reductionist approach, it is sometimes more informative to evaluate the characteristics on an ecosystem level, the so-called synthetic approach • Look at some of the NPP data available for different ecosystems
Beyond the primary productivity • It is desirable to know not only the NPP, but also the productivity on the ecosystem level (that is, all species of a community) • We often lump members of an ecosystem on the basis of trophic position, that is, how these forms make a living • From this process we can construct an ecological pyramid based upon available energy or standing crop
Simple pyramid of energy
Biological Systems • One aspect is the efficiency (or should I say inefficiency) of biological systems • Our diagram of allocation of energy hinted at this and our pyramid exhibits this numerically • The amount of energy that is passed from one trophic level to the next is generally very low
Estimates of Ecological Efficiency • Calculated efficiencies range from about 5% to more than 25% (i. e. , the amount of available energy in one level that is passed to the next level) • This is not necessarily ecosystem based, or a trophic level feature, but level/system specific • Conservative estimate of 10% is a reasonable working number (Kozlovski’s generalization)
Actual calculation of the efficiency is not a simple or quick task
What do real data tell us? How accurate are our predictions? Ecological efficiency is extraordinarily variable from system to system and from level to level. Our estimate of 10% efficiency is just that and a gross generalization at best.
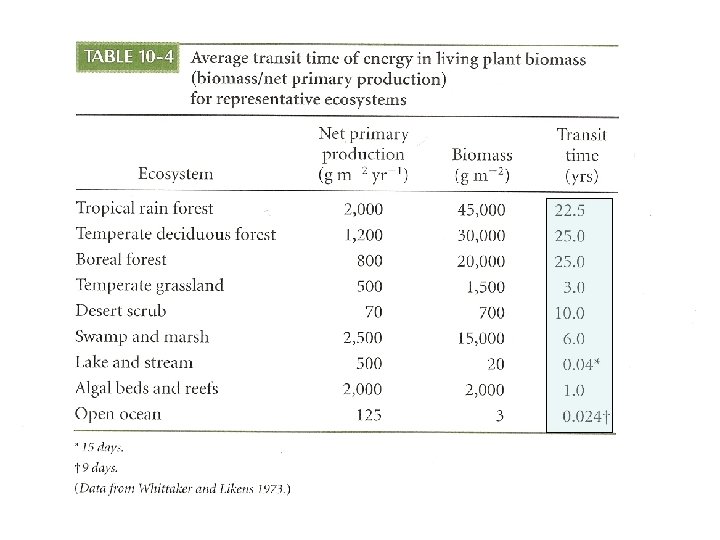
Another interesting measure… • Residence time of the energy in the various trophic levels – the amount of time that energy stays in a trophic level (aka the accumulation of energy in the various levels – ) • The longer the residence time, the greater the accumulation of biomass in the ecosystem • So which ecosystems will have the longest residence time? ? ?
Factors influencing this feature Residence time = Energy stored in biomass Net Productivity + Net gain in litter (accumulation/rate of fall) What is this telling us, i. e. , how does this help us evaluate the dynamics of the system? Compare some systems.
Remember the productivity!
Some of the complexities • Ecosystems are not closed entities • The energy in a system is not confined to the productivity of the community members, there also outside contributions, as well as external sinks for energy • Another complicating factor in the evaluation of productivity, the definition and isolation of autochthonous sources from allochthonous sources
Similarly, losses from a system • The losses from a particular trophic level do not necessarily reflect respiration and excretion – it may include the deportation of energy to areas outside your particular ecosystem • This can be the result of transient biological factors, or • Physical processes such as run-off or sedimentation in lotic systems
What two factors limit the number of trophic levels in a specific ecosystem? • First, and most importantly, the ecological efficiencies – doubling, for example, the efficiency directly translates into the doubling of the energy available to the next trophic level • Second, the net primary productivity of the system – increasing the base NPP can result in an increase in the available energy at each subsequent level – Could we do this artificially?
Can we generalize regarding the number of trophic levels? Sort of. It is perhaps the combination of productivity and the ecological efficiencies that really dictates, or more appropriately allows, a larger number of trophic levels in a given ecosystem. Look at the differences in the efficiencies, up to five times as the difference and the data suggest that this is the most important factor!
Break time
Now, Nutrients in the Ecosystem • Before we look at specifics, we need to reiterate one very important difference between energy and nutrients – • What is the source of most of the physical energy on earth? And where does it ultimately go (at least most of it)? • How about nutrients? Where do they come from? Where do they go?
Look at Nutrient Cycling
And indeed, it is cycling! • Really on this level, we can treat water, carbon, nitrogen, phosphorus, sulfur, (really, any nutrient) all in the same manner. • The material we have on earth is about it, i. e. , we really are dealing with a closed system (at least on the biosphere level) • Small amounts are added and lost, but not too much in terms of exchange outside of the biosphere
System-wide Analyses • In consideration of the components in this type of analysis, the goal is to include all of the important pieces of the puzzle • Realistically this is difficult, but at the same time, evaluation of the cycling of nutrients can also give us a view of the energy transfer within the system • This is in part due to the nature of the materials in the compartments of the system
The nature of living systems (Recall the heat used to maintain higher body temperature by endothermic forms as well as some ectotherms)
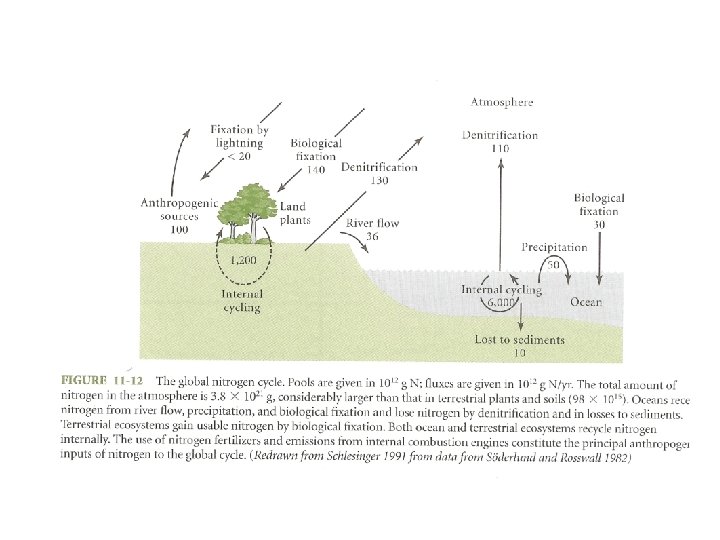
Consider Nitrogen • We know that nitrogen is one of our most common limiting factors in consideration of the productivity of a given system • Take a look first at the cycling of nitrogen that we see on a local scale as well as on a global scale • Where do we see the greatest effects from anthropogenic sources?
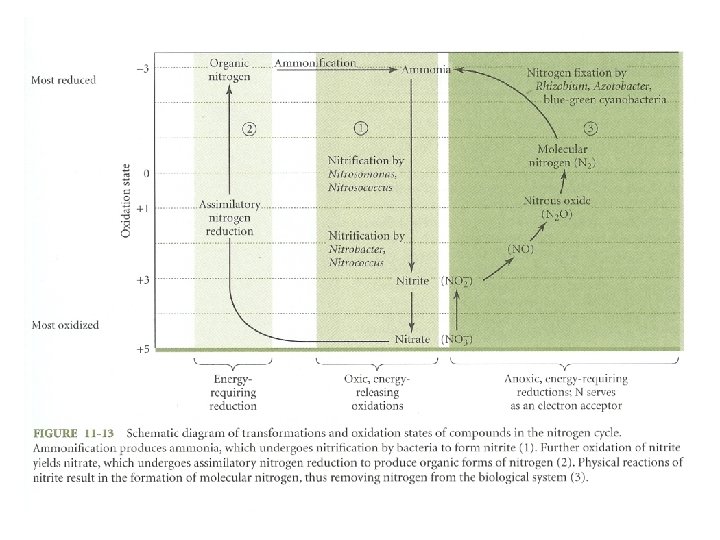
Look at Nitrogen in more detail • Organic nitrogen in the form of protein is metabolized in the process of ammonification (both are in a reduced state and therefore high energy) • Oxidation of ammonia releases energy and produces nitrites and nitrates. This process is effected by bacteria of various sorts. • We can go one of two ways from here – Nitrites are reducable into atmospheric N 2 with subsequent nitrogen fixation for usable plant nutrients (also accomplished by various bacteria) – Nitrates may be assimilated in organic macromolecules by reduction mechanisms (anabolic processes)
Carbon and Nitrogen • What is at the basis of the carbon cycle? • These are only two of the elements that must be cycled into and out-of biological systems • The dynamic nature entails change, sometimes on a massive scale, but at the very least, on the individual ontogenetic scale • The more these cycles are disturbed, the more we learn about the needed balance within the system and between the component parts of the ecosystem and biosphere as a whole
At the “heart” of cycling… • When we consider the cycling and regeneration of nutrients in terrestrial ecosystems, this process happens in the soil in terrestrial habitats • This is a function of both the abiotic and the biotic components of the soil • The abiotic components include the type of parent rock, the p. H and rainfall in terms of the rate of weathering and soil formation • Clay and humus in particular are instrumental in the retention of essential nutrients for plants
But, we also have organisms • The cycling becomes a biotic thing, when we start looking at this in terms of the detritivores and the decomposers that are resident in the soil • Large forms such as earthworms and millipedes (the keystone species? ) are major players in the breakdown of detritus • In addition to that, fungi and bacteria are also essential to the total cycling package
We can look at aquatic systems too • And really we can treat them in a very similar manner • When we consider the potential participants in the cycling of materials in an aquatic environment, we need to look at this in terms of the abiotic and the biotic components, again • What sorts of abiotic factors are contributing to the cycling of materials?
With available nutrients • We saw earlier that aquatic habitats tend to have longer food chains or food webs (i. e. , trophic levels) • We also know where this begins, with the phytoplankton • This material is then cycled through the components of the trophic levels with the passing of nutrients from one form to another
Nutrient Flow in a Salt Marsh
Export? • One of the most interesting features of this type of system is that the “cycling” of material is more of a flow through system • Salt Marshes and Estuaries are known for the influx of nutrients – but at the same time, the material produced is also exported out of the system either by physical or biological phenomena