Ecology Ecology Study of the relationships between the

Ecology

Ecology • Study of the relationships between the living (biotic factors plants, animals, predators, microbes, etc) and the non-living (abiotic factors soil, temperature, p. H, light, rainfall, wind, etc) that occur w/in a specific habitat

Ecosystem • All the living and non-living factors that interact in some way w/in a well-defined area at a specific time Ex: desert, pond, grassland, forest, tundra

WHAT AFFECTS THE DISTRIBUTION OF THE TERRESTRIAL BIOMES? CLIMATE, ELEVATION, RAINFALL, DISTANCE FROM EQUATOR – ALL OF THE THINGS THAT AFFECT CLIMATE!

Abiotic and Biotic Factors BIOTIC & ABIOTIC FACTORS Section 4 -2 Abiotic Factors Biotic Factors ECOSYSTEM

Ecological Niche • The role or function of an organism w/in a given ecosystem – Food chain path of energy through trophic levels of an ecosystem – Food web complicated, interconnected path of energy (food chain)

FOOD WEB
 • Include plants, algae, and some kinds of")
Cont. Ecological Niche 1. Producers (Autotrophs) • Include plants, algae, and some kinds of bacteria • Carries out photosynthesis process that synthesizes glucose (sugar) from CO 2 and H 2 O in the presence of light • Autotrophic cells produce ALL the food available to the ecosystem light 6 CO 2 + 6 H 2 O ------------ C 6 H 12 O 6 + 6 O 2 chlorophyll
 • Organisms which utilize nutrients synthesized by autotrophs")
Cont. Ecological Niche 2. Consumers (Heterotrophs) • Organisms which utilize nutrients synthesized by autotrophs (dependent on producers!) Ex: birds, humans, bats, elephants, butterflies, giraffes a. Respiration – Aerobic (requires O 2) breakdown of nutrients and the production of energy (ATP) and wastes 6 O 2 + C 6 H 12 O 6 ---------- ATP + 6 H 2 O + 6 CO 2
 breakdown of nutrients")
Cont. Consumers b. Fermentation – Anaerobic (does not require O 2) breakdown of nutrients and the production of energy and wastes ---- ATP + 2 alcohol + 2 CO 2 (yeasts) C 6 H 12 O 6 ---- ATP + 2 acetic acid + 2 CO 2 (bacteria) ---- ATP + lactic acid (bacteria)
 • Includes bacteria and fungi • Heterotrophic")
Cont. Ecological Niche 3. Decomposers (Detritivores/ Saprophytes) • Includes bacteria and fungi • Heterotrophic organisms which break down dead/ decayed organic matter and then recycle the nutrients (elements) back into the environment * NOTE: Observe how the carbon is cycled between the various organisms that are carrying out theses basic life reactions Ex: how matter (non-living) is interacting w/ organisms (living things)

Pyramids of Trophic Levels • Trophic level each step in a food chain/ “feeding” level that exists w/in an ecosystem • 5 trophic levels typically recognized: 1. Primary producers = autotrophs/ usually photosynthetic 2. Primary consumers = herbivores that consume primary producers (ex: plants and algae)

• 3. Secondary consumers = carnivores that eat herbivores 4. Tertiary consumers = carnivores that eat other carnivores 5. Decomposers = consumers that derive energy from detritus (organic wastes) and dead organisms from other trophic levels
 Decomposers")
• Energy flow through an ecosystem is unidirectional (not returned to ecosystem) Decomposers recycle matter

Practice

Ecological Pyramid • Ecological pyramid- diagram showing relationships between organisms making up an ecosystem • Looks at trophic efficiency percentage of production (available energy) transferred from 1 trophic level to the next

3 Kinds of Ecological Pyramids • 1. Pyramid of Numbers – Numbers of organisms in each trophic level

Cont. 3 Kinds of Ecological Pyramids 2. Pyramid of Energy o Measures the amount of energy available to higher trophic levels o Greatest amount of energy is present in the “producer” level o Only a small portion of this energy (10%) is passed on to primary consumers, and only a small portion of the energy (10%) in primary consumers is passed on to secondary consumers o Used to show the LOSS of energy (10% LAW) at each level o Considerable energy (in the form of heat/ 90%) is LOST to the environment at each successive feeding level

Cont. Pyramid of Energy lost: a. Sunlight is reflected off leaves instead of being used for photosynthesis b. Through respiration as heat c. Excretion and defecation d. Energy used for movement and transport . 01%. 1% 100% SUNLIGHT 1% Respiration Heat Waste Assimilation Movement 10% Producers 100%

Cont. Pyramid of Energy Ex: a. Humans cellular respiration 6 O 2 + glucose 36 ATP (energy molecules) (100%) 55% lost as heat b. Cycles: C, O 2, N 2 recycled through respiration and photosynthesis

Cont. Pyramids of Trophic Levels 3. Pyramid of Biomass o Total dry weight of ALL organisms at EACH trophic level o Low trophic efficiency a decrease in available energy at higher feeding levels o Therefore, less organic matter/ biomass can be supported at each higher level a) Total mass of producers MUST be > total mass of primary consumers b) Total mass of primary consumer MUST be > total mass of secondary consumers

Pyramid of Biomass

Ecological Pyramids Pyramid of Numbers Shows the relative number of individual organisms at each trophic level Energy Pyramid Shows the relative amount of energy available at each trophic level/ organisms use about 10% of this energy for life processes and the rest is lost as heat Biomass Pyramid Represents the amount of living organic matter at each trophic level/ typically, the greatest biomass is at the base of the pyramid

Competitive Relationship • A change in the size of 1 population affects all other organisms w/in the ecosystem • Predation (+/-) relationship in which 1 species kills and eats the prey a. Predator animal that hunts, kills and eats other animals for food -Need to be adapted for efficient hunting if they are to catch enough food to survive b. Prey organisms that predators kill for food - Must be well adapted to escape their predators if enough of them are to survive for the species to continue

Cont. Competitive Relationships 1. Niche how an organism lives/ how it does its jobs; affects the energy flow w/in ecosystem 2. Competition when 2 species uses the same resources/ when the resource is in limited supply 3. Character displacement response to competition; some changes may by physical or behavioral 4. Competitive exclusion species that is the better competitor may drive the other out a. No 2 species can occupy the same niche b. Local elimination of 1 competing species c. Species using resource more efficiently eliminates the other

Cont. Competitive Relationships 5. Coevolution 2 species interacting w/in an ecosystem; some work in opposition to each other, others cooperate w/ each other 6. Coevelution “arms race” a. Selection pressure on each other- 1 must defend itself and the other must overcome the defense b. Predator counter-attack measures Ex: stealth, camouflage, avoiding repellants

3 SPECIES OF WARBLERS & THEIR NICHES Figure 4 -5 Three Species of Warblers and Their Niches Section 4 -2 Cape May Warbler Feeds at the tips of branches near the top of the tree Bay-Breasted Warbler Feeds in the middle part of the tree Spruce tree Yellow-Rumped Warbler Feeds in the lower part of the tree and at the bases of the middle branches

Camouflage/ Cryptic Coloration

Aposematic/Warning Coloration

Mimicry Venomous Coral Snake Red Milk Snake
 and viceroy (right) butterflies exhibiting Müllerian mimicry")
• The monarch (left) and viceroy (right) butterflies exhibiting Müllerian mimicry
 way • 3 Patterns")
Symbiosis • 2 different species living together in some (unusual) way • 3 Patterns 1. Mutualism (+/+) o Both species benefit from each other 2. Commensalism (+/0) o 1 specie benefits while the other is neither helped nor harmed 3. Parasitism (+/-) o 1 specie benefits while the other is harmed o Parasite steals nourishment from host
")
Cont. Symbiosis RELATIONSHIPS: Interactions Competition Parasitism Predation Mutualism Commensalism Neutral relationship WHO WINS? (+) WHO LOSES (-) Effect on One Effect on Other

Guess the relationship?

Guess the relationship? Tick in a dog

Guess the relationship? Barnacles on whale

The Water Cycle Section 3 -3 THE WATER CYCLE Condensation Precipitation Evaporation Transpiration Runoff Seepage Root Uptake

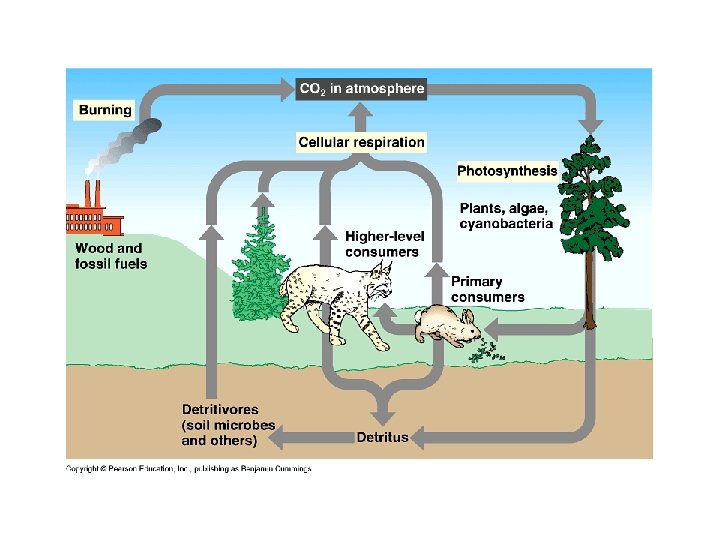
CARBON CYCLE CO 2 in Atmosphere CO 2 in Ocean
 IS NITROGEN • UNUSABLE AS GAS")
NITROGEN • 79% OF ATMOSPHERIC GAS (N 2) IS NITROGEN • UNUSABLE AS GAS – PLANTS & ANIMALS MUST HAVE IT FOR THEIR PROTEINS • ANIMALS EXCRETE NITROGEN COMPOUNDS AS METABOLIC WASTE (BREAKDOWN OF PROTEINS): URIC ACID, UREA, AND AMMONIA (LISTED FROM LEAST TO MOST TOXIC)
 N 2 Ammonia/Protein N 2 Fixing")
Nitrogen Cycle Compound Converts To By (Which Bacteria) N 2 Ammonia/Protein N 2 Fixing NH 3 Nitrites NO 2 - Nitrifying NO 2 - Nitrates NO 3 - Nitrifying NO 3 - Nitrogen N 2 Denitrifying

Nitrogen Cycle N 2 in Atmosphere Convert N 2 to proteins in plants called legumes clover NH 3 Nitrifying bacteria: convert NH 3 to nitrites & convert nitrites to nitrates NO 3 and NO 2 - Nitrates (Usable: can be absorbed by roots) Reduces nitrates to nitrogen, restoring N 2 to atmosphere

PHOSPHOROUS CYCLE
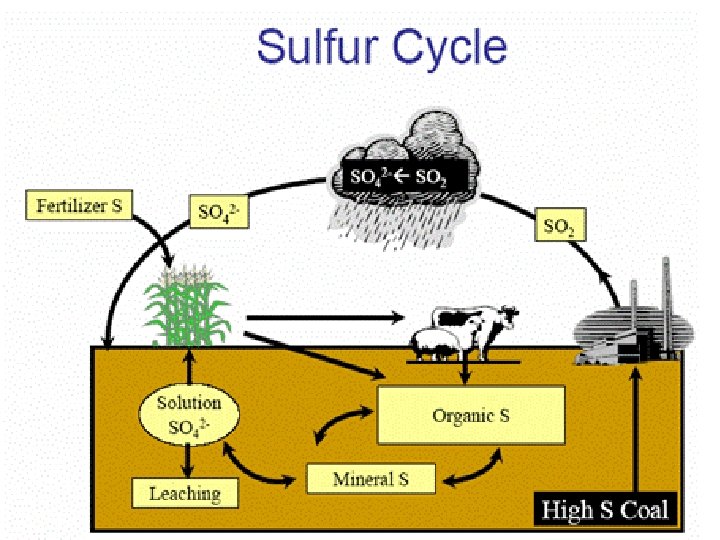

WHICH THINGS CYCLE THROUGH THE BIOSPERE? WHICH ONES DO SO WITH THE ASSISTANCE OF THE ATMOSPHERE? WATER PHOSPHOROUS SULFUR CARBON NITROGEN OXYGEN

Concept Map Section 5 -1 POPULATION GROWTH Population Growth can be Logistic growth Exponential growth characterized by No limits on growth Unlimited resources represented by Constant growth rate J shaped curve characterized by Limits on growth which cause a Falling growth rate represented by S shaped curve

3 Factors that Affect Pop Size: 1. # of births 2. #s of deaths 3. #s of inds that enter or leave the pop (IMMIGRATION & EMIGRATION) POPULATION …. • Grows when BIRTHRATE > DEATH RATE • Stays more/ less the same when BIRTHRATE = DEATH RATE • Shrinks when DEATH RATE > BIRTHRATE

EXPONENTIAL GROWTH • Occurs when inds in a pop reproduce at a constant rate • Under ideal conditions with a UNLIMITED RESOURCE, a pop will grow exponentially • J shaped curve

Figure 5 -4 Logistic Growth of Yeast Population Section 5 -1 LOGISTIC GROWTH Number of Yeast Cells Carrying capacity Time (hours) • As resources become less available, growth of pop slows or stops • CARRYING CAPACITY # of inds that a given environment can support • S-shaped curve
 • DENSITY-INDEPENDENT: AFFECT ALL POPULATIONS REGARDLESS OF SIZE")
LIMITING FACTORS (CAUSES POPULATIONS TO DECREASE) • DENSITY-INDEPENDENT: AFFECT ALL POPULATIONS REGARDLESS OF SIZE - UNUSUAL WEATHER, SEASONAL CYCLES, & CERTAIN HUMAN ACTIVITIES • DENSITY-DEPENDENT: DEPENDS ON POP SIZE - (AFFECT LARGE & DENSE POPULATIONS, NOT SMALL & SCATTERED POPULATIONS) - COMPETITION, PREDATION, PARASITISM, & DISEASE

A DENSITY-DEPENDENT LIMITING FACTOR A Density-Dependent Limiting Factor Section 5 -2 Growth of Aphids Exponential growth Peak population size Rapid decline Steady population size

Figure 5 -7 Wolf and Moose Populations on Isle Royale A DENSITY-DEPENDENT LIMITING FACTOR Section 5 -2 60 2400 50 2000 40 1600 30 1200 20 800 10 400 0 1955 1960 1965 1970 1975 Moose 1980 Wolves 1985 1990 1995 0

Human Population Growth HUMAN GROWTH POPULATION Section 5 -3 Industrial Revolution begins Agriculture begins Plowing and irrigation Bubonic plague
 Figure 5 -13 Age Distribution Section 5 -3")
HUMAN POPULATION GROWTH (AGE- STRUCTURE DIAGRAMS) Figure 5 -13 Age Distribution Section 5 -3 U. S. Population Males Females Rwandan Population Males Females

Species Diversity Section 6 -3 SPECIES DIVERSITY Insects 54. 4% Protists 4. 2% Other Animals 19. 7% Plants 18% Fungi 3. 4% Bacteria 0. 3%

Figure 6 -16 Biological Magnification of DDT Section 6 -3 BIOLOGICAL MAGNIFICATION/AMPLIFICATION • CONCENTRATIONS Magnification of Fish Eating Birds OF A HARMFUL DDT Concentration SUBSTANCE 10, 000 INCREASE IN ORGS AT HIGHER TROPHIC LEVELS IN A FOOD Large 1, 000 Fish CHAIN/ WEB • TOP CARNIVORES AT HIGHEST RISK Small Fish 100, 000 Zooplankton 10, 000 Producers 1000 Water 1

ECOLOGICAL SUCCESION SERIES OF PREDICTABLE CHANGES THAT OCCURS IN A COMM OVER TIME A. PRIMARY SUCCESION- occurs on an area of newly exposed rock or sand or lava or any area that has not been occupied previously by a living (biotic) community • Pioneer species LICHEN B. SECONDARY SUCCESION takes place where community has been removed ex: in a plowed field or a clear cut forest

PRIMARY SUCCESION SECONDARY SUCCESION
- Slides: 58