Ecology and the Biosphere Chapter 50 Ecology the

Ecology and the Biosphere Chapter 50

Ecology - the study of the interactions between organisms and their environments

The interactions between organisms and their environments determine their distributions and abundances • Distribution = geographic range • abundance=individuals per unit area • environmental factors – abiotic - non-living chemical and physical factors – biotic - living factors like other organisms

Figure 50. 1 Distribution and abundance of the red kangaroo in Australia, based on aerial surveys

Figure 50. 2 Sample questions at different levels of ecology

Examples of ecological questions: • How do diving whales select their feeding areas? • What processes recycle vital chemical elements, such as nitrogen, in a savanna ecosystem • What factors influence the diversity of tree species that make up a particular forest

Factors affecting the distribution of organisms • • dispersal behavior and habitat selection biotic factors abiotic factors

Biogeography • The study of past and present distributions of individual species • continental drift and barriers contribute to distinctive floras and faunas of the Earth’s major regions

Figure 50. 4 Biogeographic realms

Dispersal • Example: Kangaroos may not be in North America because they historically had no way of getting there. • To test this: species transplant experiments

Figure 50. 6 Set of transplant experiments for a hypothetical species

• Transplant successful - distribution limited because of dispersal problems – inaccessible, not enough time to reach area, not recognized as suitable living space • transplant unsuccessful - distribution limited by biotic or abiotic factors, I. e. , for some reason cannot survive there.

Invasive species • In modern times, normal restrictions on dispersal are lifted and invasive species can proliferate

Figure 50. 7 Spread of the African honeybee in the Americas since 1956
")
Figure 50. 8 Expansion of the geographic range of the zebra mussel (Dreissena polymorpha) since its discovery near Detroit in 1988

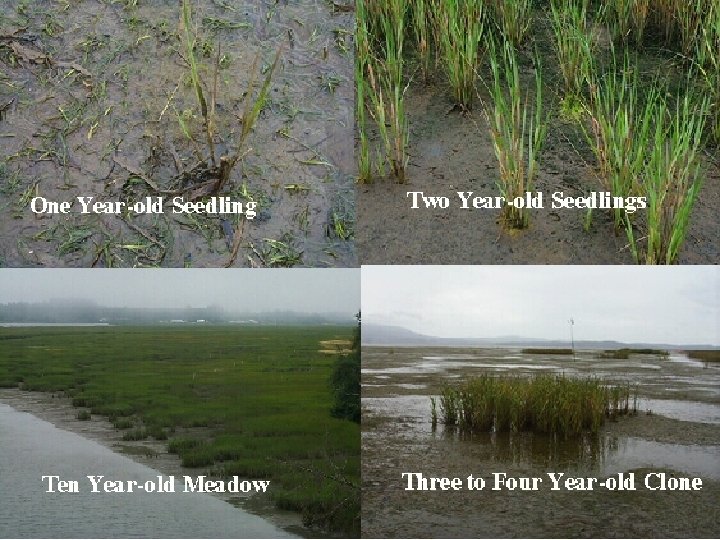
Spartina alterniflora and Spartina anglica • Saltmarsh grasses native to the Eastern U. S. (S. alterniflora) and British Isles (S. anglica). • Invasive species in Puget Sound and Willapa Bay in Washington State.

Spartina are physiologically resilient and vigorous • Physiological tolerance – Wide range of salinities – Waterlogged soils • Anoxia • Hydrogen sulfide • Fast rate of spread - average 10 -20% per year (can be much greater)
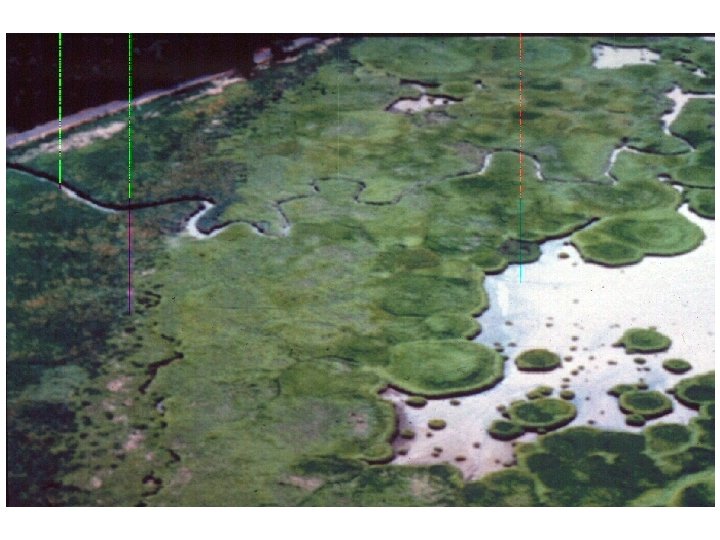

Willapa Bay • Spartina alterniflora • 10, 000 to 25, 000 acres affected • Nearly 4000 solid acres

Puget Sound • Spartina anglica • ≈7000 acres affected – Solid acres: • • Pink=<1 Peach= 1 -5 Blue=6 -100 Red=>100 1999

Managing the spartina problem • >$10 million spent since 1990 – Affected areas have increased from a few thousand to >20, 000 acres • Herbicide and mechanical control – $2000 per acre per year

Distribution of hydrogen sulfide in sediments Oxidized zone No hydrogen sulfide Anoxic zone Hydrogen sulfide-rich

Tolerating anoxic sediments • Aerenchyma • Anaerobic metabolism – Alcohol dehydrogenase • Sulfide oxidation Spartina anglica root

Biotic factors affect the distribution of organisms • Competition – interspecific – intraspecific • Predation • Mutualism - species helping each other

Figure 50. 9 Predator-removal experiments

Limpet and urchin removal experiments • Results show that the herbivores limit the distribution and abundance of seaweed • limpets appear to be the main herbivores • but why is there more seaweed when both limpets and urchins are removed?

Temperature and water are major climatic factors determining the distributions of organisms • Biome-a major type of ecosystem
 in North")
Figure 50. 10 A climograph for some major kinds of ecosystems (biomes) in North America

Global climate patterns

Figure 50. 12 What causes the seasons?

Figure 50. 14 How mountains affect rainfall
 • Winter • cold")
Figure 50. 15 Lake stratification and seasonal turnover (Layer 1) • Winter • cold water at surface • warmer deeper in lake

• Spring - surface water warms and sinks allowing mixing. Oxygen to bottom waters and nutrients to surface waters

Summer -thermocline development

summer • Thermal profile develops • thermocline -separates cold bottom water and warm surface water
")
Figure 50. 15 Lake stratification and seasonal turnover (Layer 4)

Fall • Surface water cools rapidly and sinks • thermocline disappears • remixing of lake water

Figure 50. 16 Current geographic range and predicted future range for the American beech (Fagus grandifolia) under two climate-change scenarios

Figure 50. 17 The distribution of major aquatic biomes

Figure 50. 18 Zonation in a lake
, eutrophic lake (top right), stream flowing")
Figure 50. 19 Freshwater biomes: Oligotrophic lake (left), eutrophic lake (top right), stream flowing into a river (bottom right)

Figure 50. 20 Damming the Columbia River Basin
 and estuaries (bottom)")
Figure 50. 21 Wetlands (top) and estuaries (bottom)

Figure 50. 22 Zonation in the marine environment

Figure 50. 23 Examples of marine biomes

Figure 50. 23 cx Black smoker

Figure 50. 24 The distribution of major terrestrial biomes

Figure 50. 25 a Tropical forests

Figure 50. 25 b Savanna

Figure 50. 25 bx Savanna

Figure 50. 25 c Deserts

Figure 50. 25 d Chaparral

Figure 50. 25 dx Chaparral

Figure 50. 25 e Temperate grassland

Figure 20. 25 f Temperate deciduous forest

Figure 20. 25 g Coniferous forests

Figure 20. 25 h Tundra

Figure 50. 26 A hierarchy of scales for analyzing the geographic distribution of the moss Tetraphis

Figure 50. 27 Most species have small geographic ranges

Figure 50. x 1 Patterns of distribution in the biosphere
- Slides: 61