
Ecological Pyramids Definition graphical models representing the quantitative


- Slides: 4
Ecological Pyramids Definition: graphical models representing the quantitative differences that exist between Trophic levels §Pyramids of numbers §Pyramids of biomass §Pyramids of Productivity/Energy
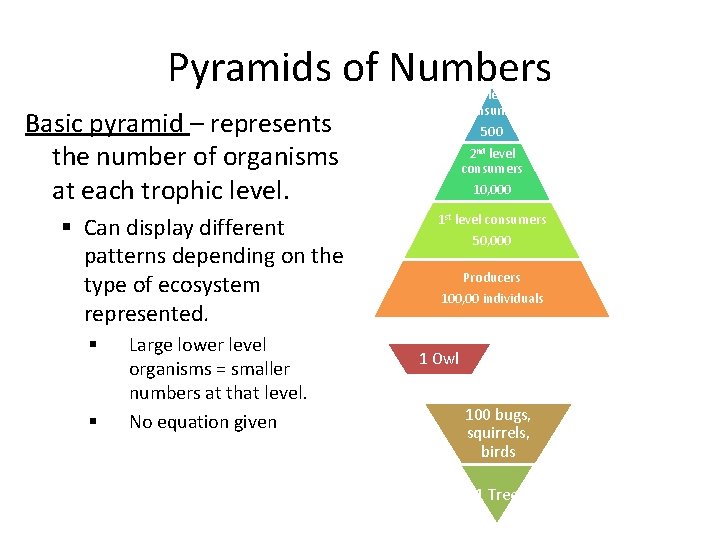
Pyramids of Numbers 3 rd level consumer Basic pyramid – represents the number of organisms at each trophic level. § Can display different patterns depending on the type of ecosystem represented. § § Large lower level organisms = smaller numbers at that level. No equation given 500 2 nd level consumers 10, 000 1 st level consumers 50, 000 Producers 100, 00 individuals 1 Owl 100 bugs, squirrels, birds 1 Tree
Pyramids of Biomass • Represents the amount of dried tissue at each trophic level. • Quantities of biomass and energy decrease along the food chain(hence: pyramid shape) • Equation: – gms/meters² or – Joules/meters² (energy)
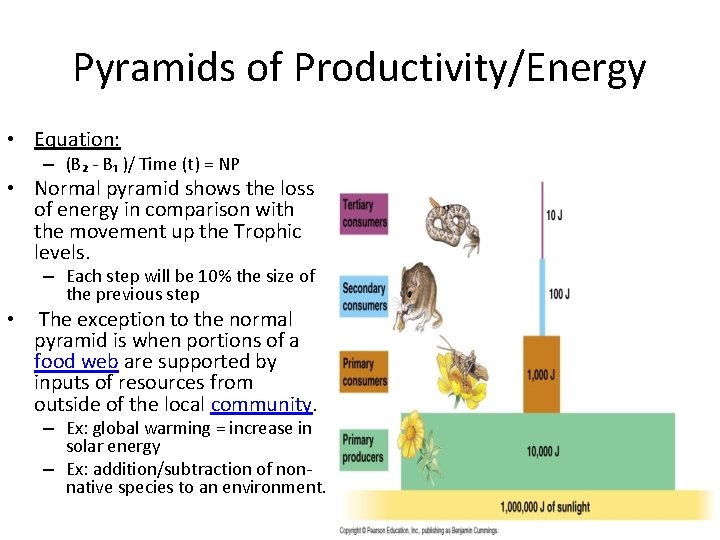
Pyramids of Productivity/Energy • Equation: – (B₂ - B₁ )/ Time (t) = NP • Normal pyramid shows the loss of energy in comparison with the movement up the Trophic levels. – Each step will be 10% the size of the previous step • The exception to the normal pyramid is when portions of a food web are supported by inputs of resources from outside of the local community. – Ex: global warming = increase in solar energy – Ex: addition/subtraction of nonnative species to an environment.