
Ecological Integrity Assessment of Maine Wetlands Andy Cutko





- Slides: 29
Ecological Integrity Assessment of Maine Wetlands Andy Cutko Maine Natural Areas Program March 2016
Topics to Be Covered • Background on Ecological Integrity Assessment • Development of EIA for use in Maine • A Tale of Two Swamps - Real Life Examples! • Take Home Messages
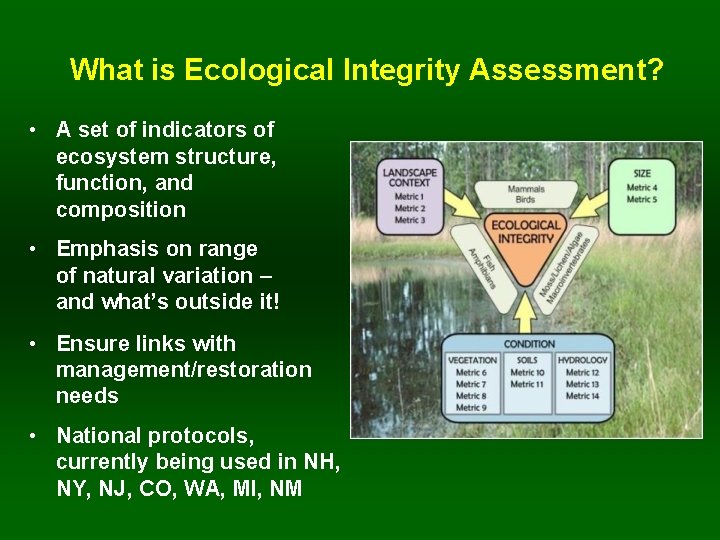
What is Ecological Integrity Assessment? • A set of indicators of ecosystem structure, function, and composition • Emphasis on range of natural variation – and what’s outside it! • Ensure links with management/restoration needs • National protocols, currently being used in NH, NY, NJ, CO, WA, MI, NM
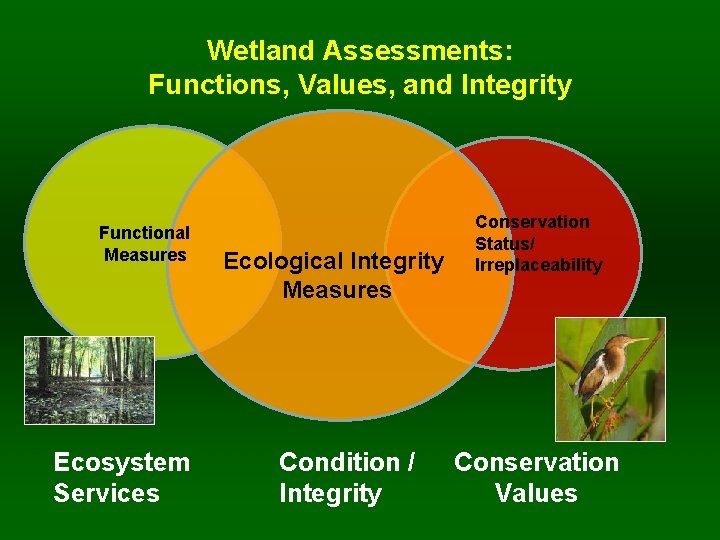
Wetland Assessments: Functions, Values, and Integrity Functional Measures Ecosystem Services Ecological Integrity Measures Condition / Integrity Conservation Status/ Irreplaceability Conservation Values
Topics to Be Covered • • Background on EIA Development of EIA for use in Maine A Tale of Two Forests - Real Life Examples! Take Home Messages
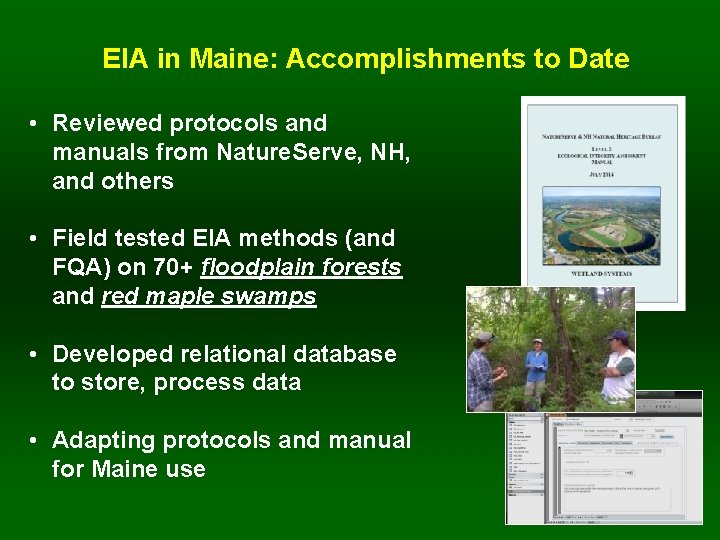
EIA in Maine: Accomplishments to Date • Reviewed protocols and manuals from Nature. Serve, NH, and others • Field tested EIA methods (and FQA) on 70+ floodplain forests and red maple swamps • Developed relational database to store, process data • Adapting protocols and manual for Maine use
Topics to Be Covered • • Background on EIA Development of EIA for use in Maine A Tale of Two Forests - Real Life Examples! Take Home Messages
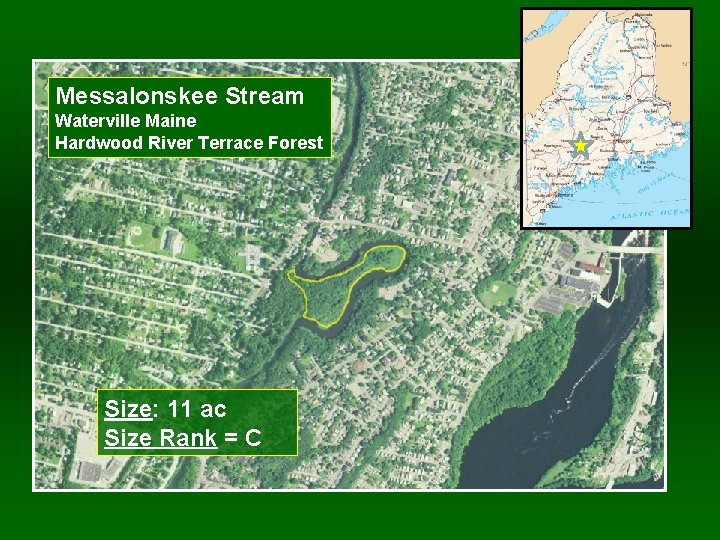
Messalonskee Stream Waterville Maine Hardwood River Terrace Forest Size: 11 ac Size Rank = C
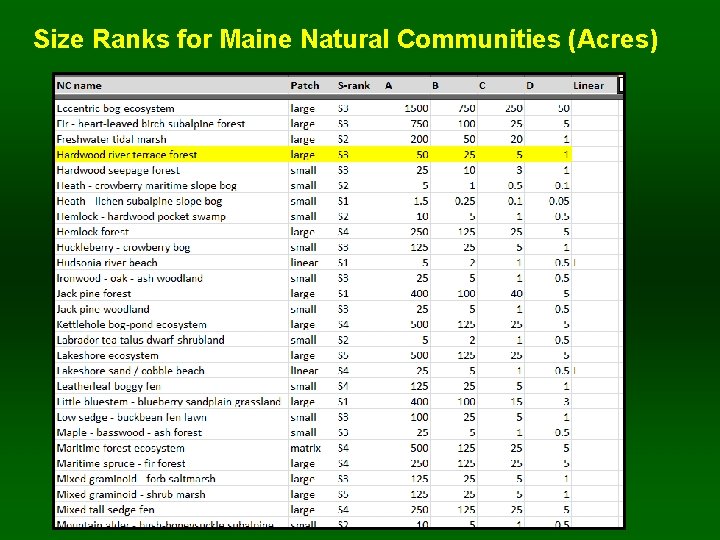
Size Ranks for Maine Natural Communities (Acres)
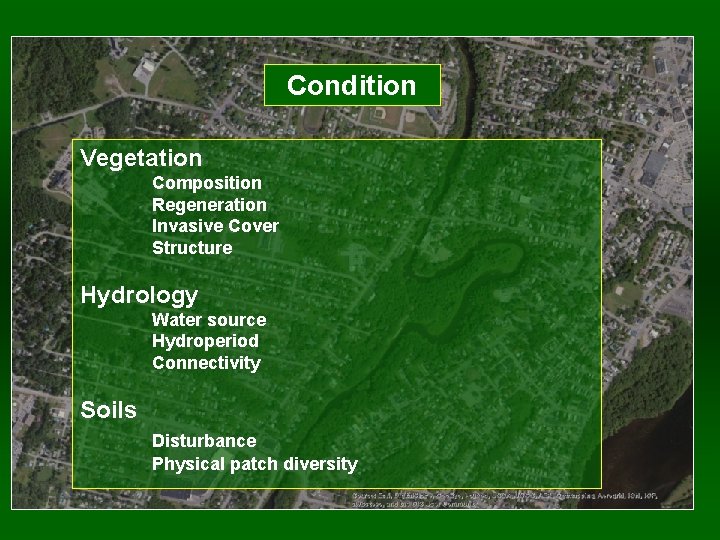
Condition Vegetation Composition Regeneration Invasive Cover Structure Hydrology Water source Hydroperiod Connectivity Soils Disturbance Physical patch diversity
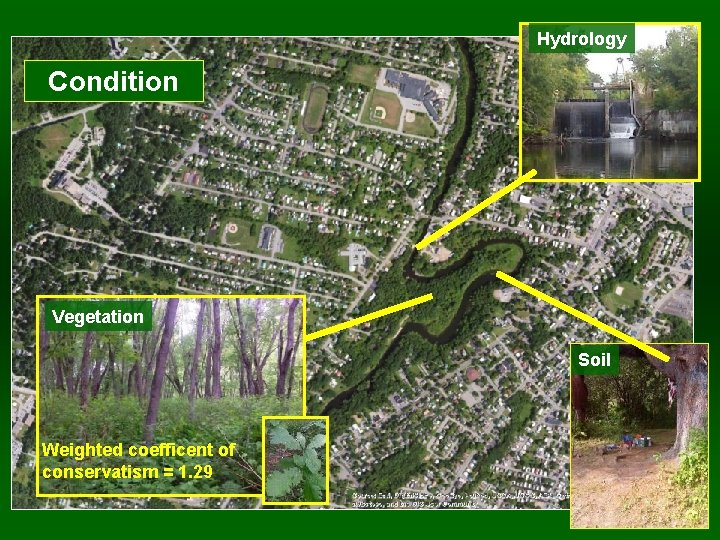
Hydrology Condition Vegetation Soil Weighted coefficent of conservatism = 1. 29
Stressors Checklist
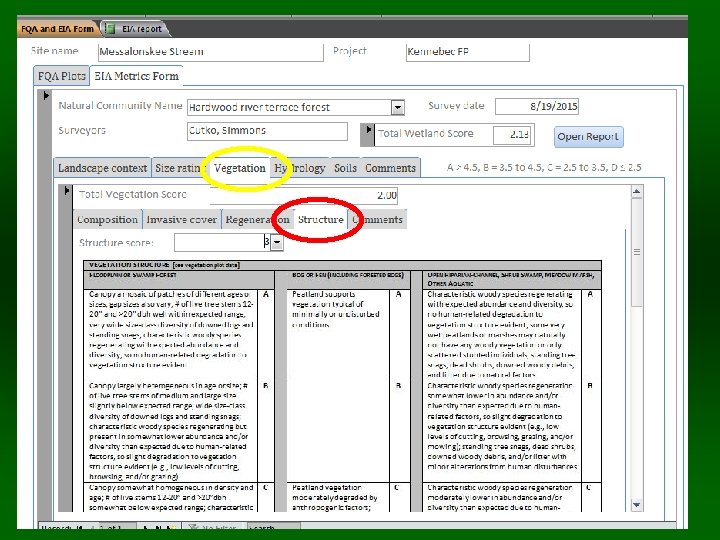
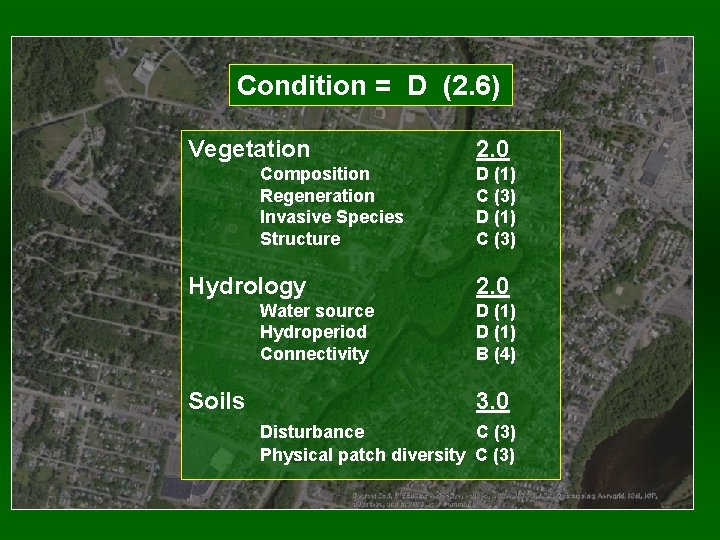
Condition = D (2. 6) Vegetation Composition Regeneration Invasive Species Structure Hydrology Water source Hydroperiod Connectivity Soils 2. 0 D (1) C (3) 2. 0 D (1) B (4) 3. 0 Disturbance C (3) Physical patch diversity C (3)
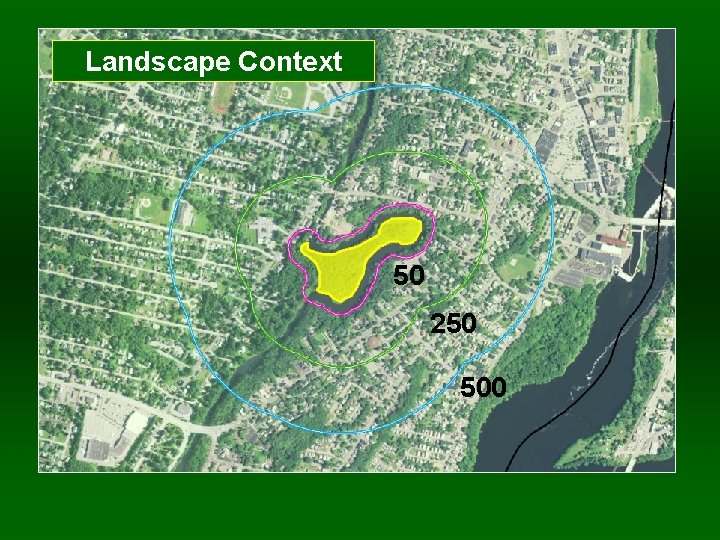
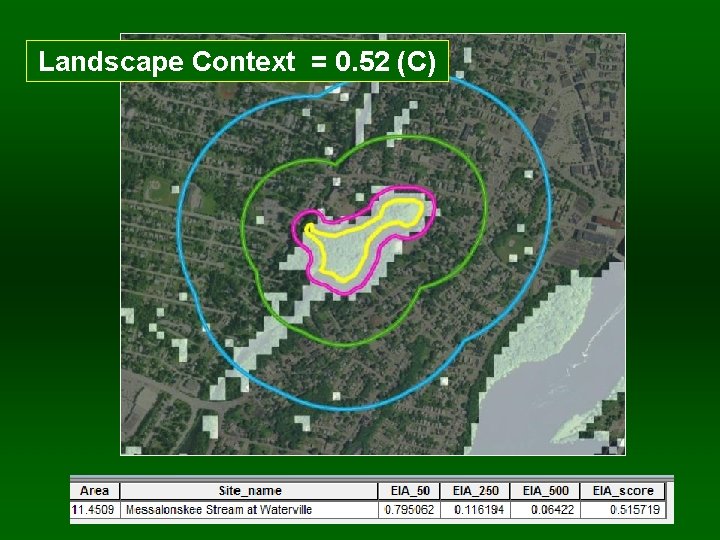
Landscape Context 50 250 500
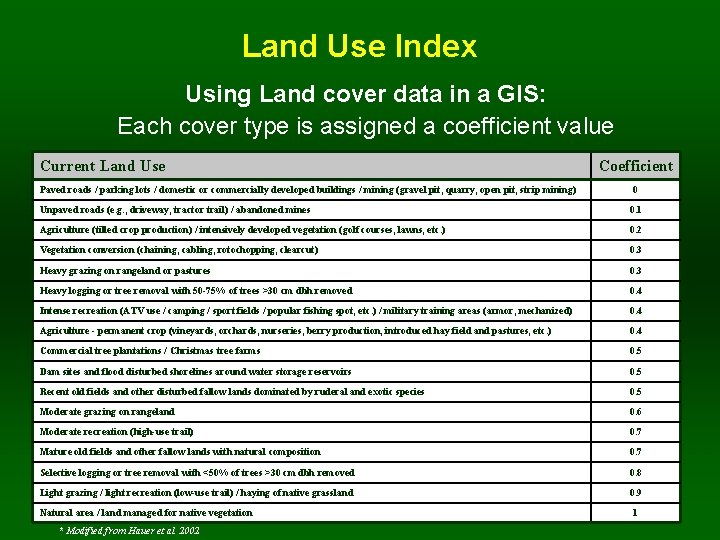
Land Use Index Using Land cover data in a GIS: Each cover type is assigned a coefficient value Current Land Use Paved roads / parking lots / domestic or commercially developed buildings / mining (gravel pit, quarry, open pit, strip mining) Coefficient 0 Unpaved roads (e. g. , driveway, tractor trail) / abandoned mines 0. 1 Agriculture (tilled crop production) / intensively developed vegetation (golf courses, lawns, etc. ) 0. 2 Vegetation conversion (chaining, cabling, rotochopping, clearcut) 0. 3 Heavy grazing on rangeland or pastures 0. 3 Heavy logging or tree removal with 50 -75% of trees >30 cm dbh removed 0. 4 Intense recreation (ATV use / camping / sport fields / popular fishing spot, etc. ) / military training areas (armor, mechanized) 0. 4 Agriculture - permanent crop (vineyards, orchards, nurseries, berry production, introduced hay field and pastures, etc. ) 0. 4 Commercial tree plantations / Christmas tree farms 0. 5 Dam sites and flood disturbed shorelines around water storage reservoirs 0. 5 Recent old fields and other disturbed fallow lands dominated by ruderal and exotic species 0. 5 Moderate grazing on rangeland 0. 6 Moderate recreation (high-use trail) 0. 7 Mature old fields and other fallow lands with natural composition 0. 7 Selective logging or tree removal with <50% of trees >30 cm dbh removed 0. 8 Light grazing / light recreation (low-use trail) / haying of native grassland 0. 9 Natural area / land managed for native vegetation * Modified from Hauer et al. 2002 1
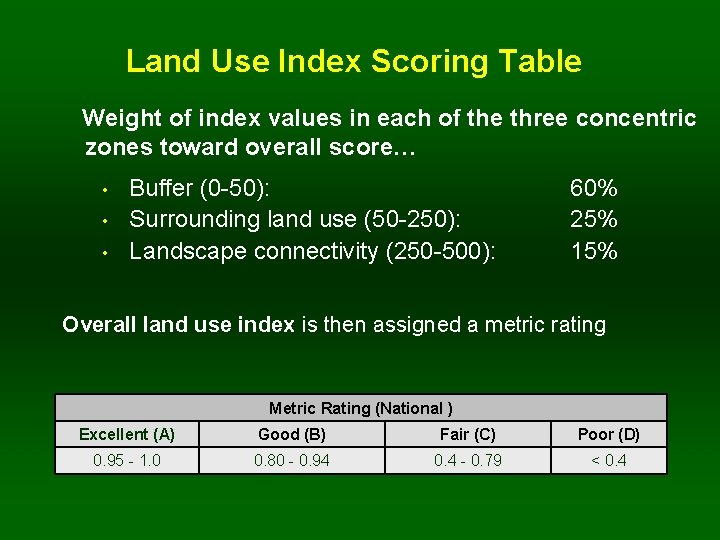
Land Use Index Scoring Table Weight of index values in each of the three concentric zones toward overall score… • • • Buffer (0 -50): Surrounding land use (50 -250): Landscape connectivity (250 -500): 60% 25% 15% Overall land use index is then assigned a metric rating Metric Rating (National ) Excellent (A) Good (B) Fair (C) Poor (D) 0. 95 - 1. 0 0. 80 - 0. 94 0. 4 - 0. 79 < 0. 4
Landscape Context = 0. 52 (C)
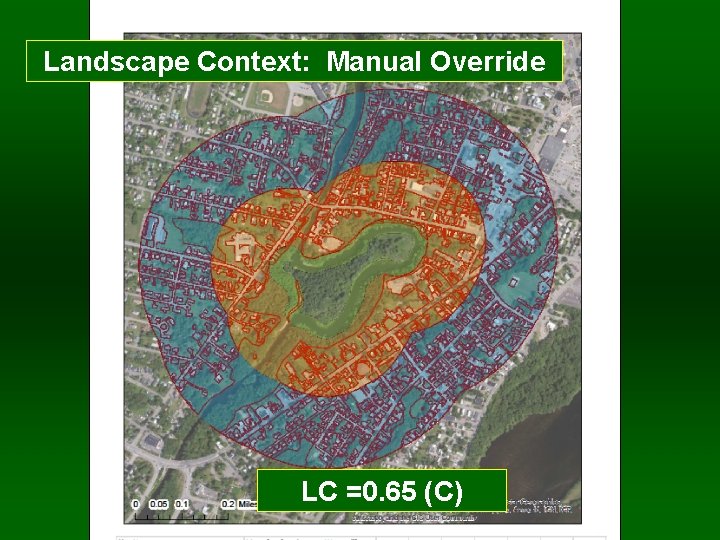
Landscape Context: Manual Override LC =0. 65 (C)
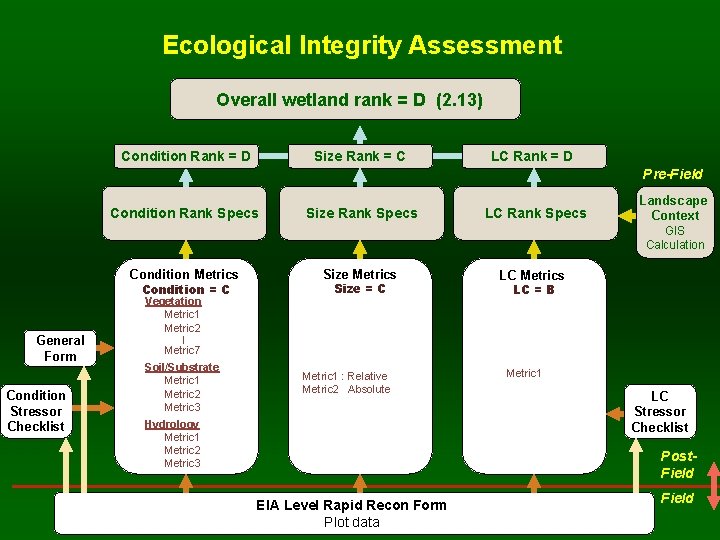
Ecological Integrity Assessment Overall wetland rank = D (2. 13) Condition Rank = D Size Rank = C LC Rank = D Pre-Field Condition Rank Specs Size Rank Specs LC Rank Specs Landscape Context GIS Calculation Condition Metrics Condition = C General Form Condition Stressor Checklist Vegetation Metric 1 Metric 2 Size Metrics Size = C LC Metrics LC = B | Metric 7 Soil/Substrate Metric 1 Metric 2 Metric 3 Metric 1 : Relative Metric 2 Absolute Hydrology Metric 1 Metric 2 Metric 3 Metric 1 LC Stressor Checklist Post. Field EIA Level Rapid Recon Form Plot data Field
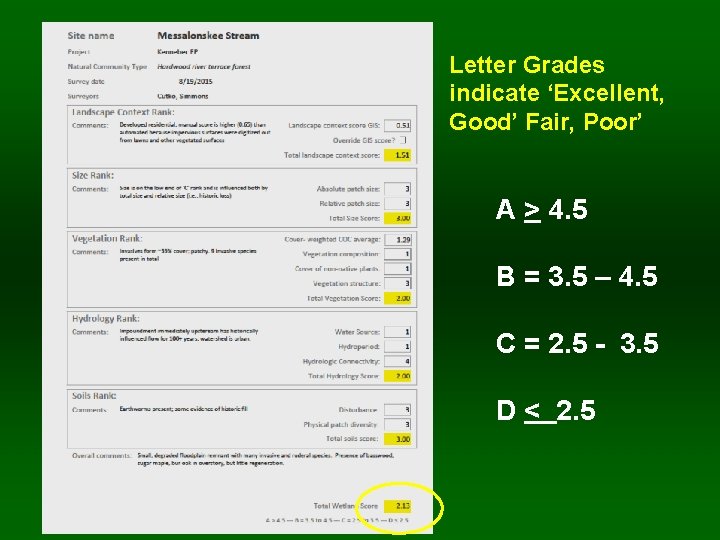
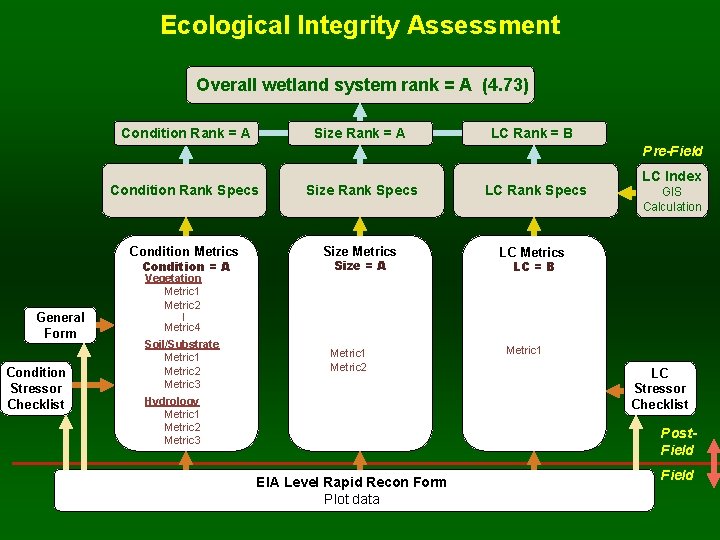
Letter Grades indicate ‘Excellent, Good’ Fair, Poor’ A > 4. 5 B = 3. 5 – 4. 5 C = 2. 5 - 3. 5 D < 2. 5
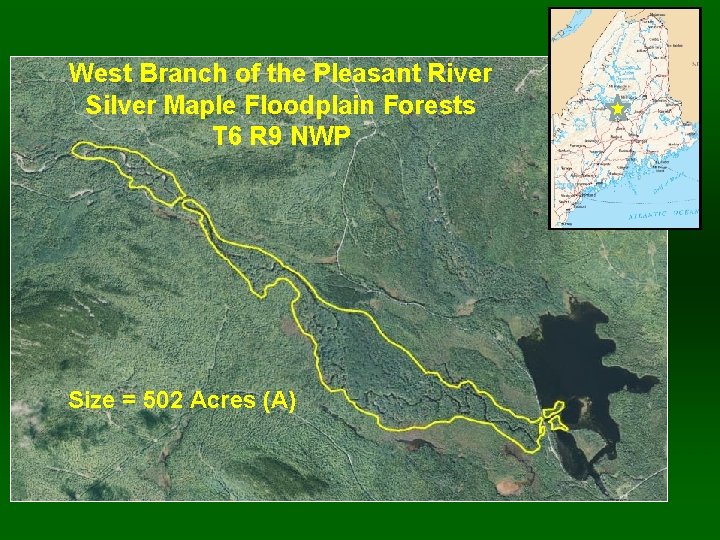
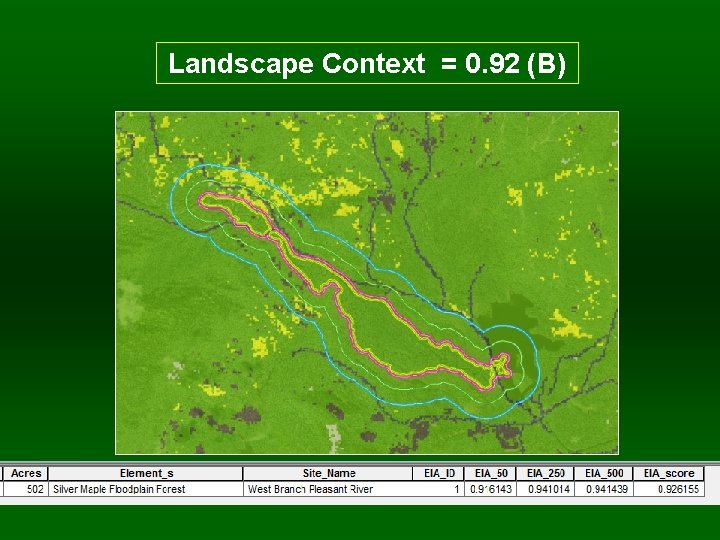
West Branch of the Pleasant River Silver Maple Floodplain Forests T 6 R 9 NWP Size = 502 Acres (A)
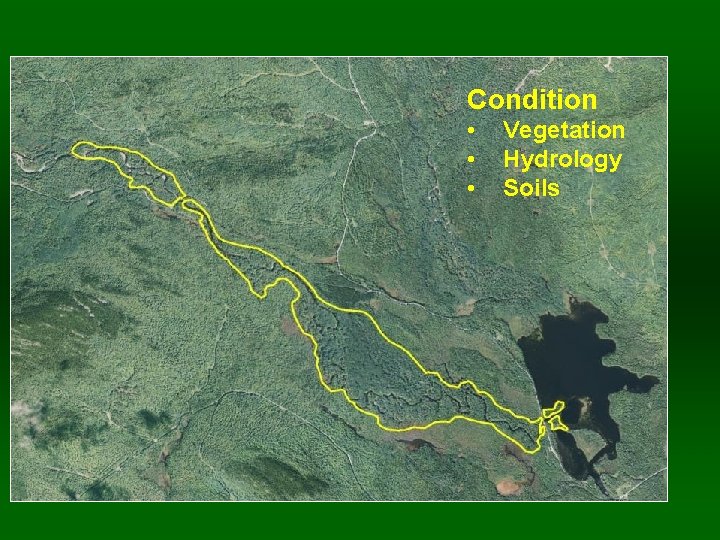
Condition • • • Vegetation Hydrology Soils
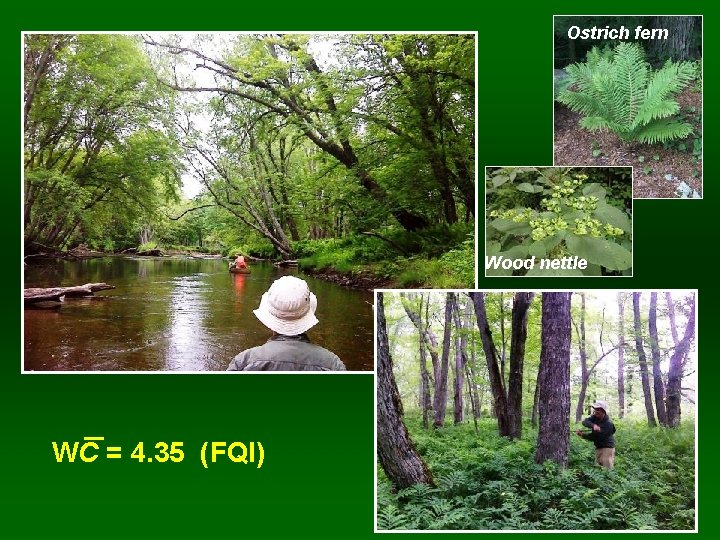
Ostrich fern Wood nettle WC = 4. 35 (FQI)
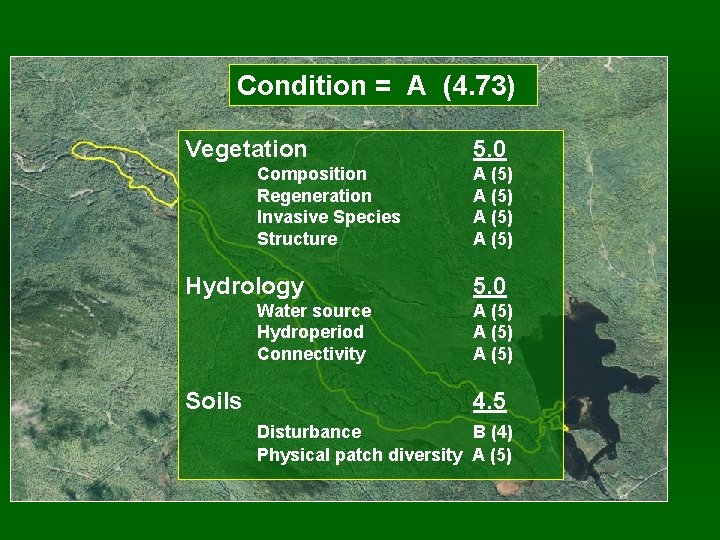
Condition = A (4. 73) Vegetation Composition Regeneration Invasive Species Structure Hydrology Water source Hydroperiod Connectivity Soils 5. 0 A (5) A (5) 4. 5 Disturbance B (4) Physical patch diversity A (5)
Landscape Context = 0. 92 (B)
Ecological Integrity Assessment Overall wetland system rank = A (4. 73) Condition Rank = A Size Rank = A LC Rank = B Pre-Field Condition Rank Specs Size Rank Specs LC Rank Specs Condition Metrics Size Metrics LC Metrics Condition = A General Form Condition Stressor Checklist Vegetation Metric 1 Metric 2 Size = A LC Index GIS Calculation LC = B | Metric 4 Soil/Substrate Metric 1 Metric 2 Metric 3 Metric 1 Metric 2 Hydrology Metric 1 Metric 2 Metric 3 Metric 1 LC Stressor Checklist Post. Field EIA Level Rapid Recon Form Plot data Field
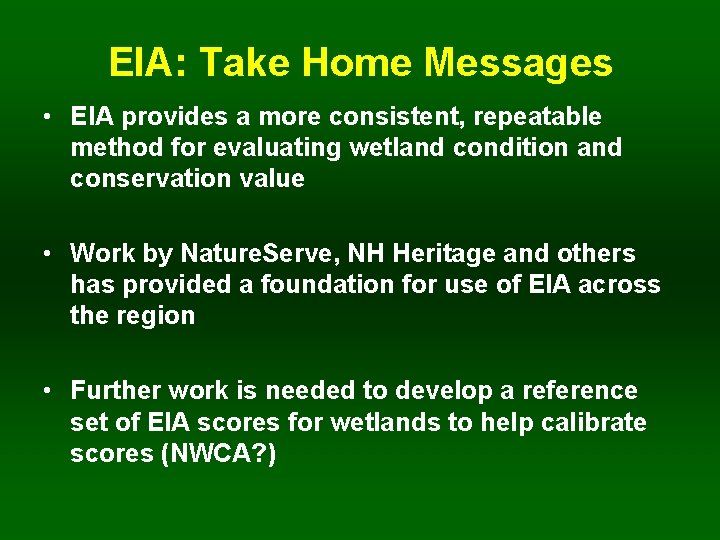
EIA: Take Home Messages • EIA provides a more consistent, repeatable method for evaluating wetland condition and conservation value • Work by Nature. Serve, NH Heritage and others has provided a foundation for use of EIA across the region • Further work is needed to develop a reference set of EIA scores for wetlands to help calibrate scores (NWCA? )
Questions? andrew. cutko@maine. gov