Eclipse IDE Tutorial For Java Author Loh Jianxiong










![public class Buggy. Sort { public static void print. Array(int[] arr, int start. Index, public class Buggy. Sort { public static void print. Array(int[] arr, int start. Index,](https://slidetodoc.com/presentation_image_h/977d99dbaa604bbdba8f22ceaf90a23f/image-46.jpg)



- Slides: 52

Eclipse IDE Tutorial For Java Author: Loh Jianxiong Christopher Contributions: Chua Jie Sheng, Li Mengran, Peh Shao Hong, Oo Theong Siang, Tong Chun Kit, Tania Chattopadhyay

Introduction to Eclipse A powerful IDE (Integrated Development Environment) Provides many features and tools to aid in software development Download the latest version of Eclipse from: http: //www. eclipse. org/downloads/ “Eclipse IDE for Java Developers” should be sufficient for this module This tutorial has two parts: Part A: Setting up a project Part B: Debugging 2

Part A: Setting up a project

Starting Eclipse When you first start Eclipse, you will be asked to set a workspace folder, which is the location where all your project related files will be stored 4

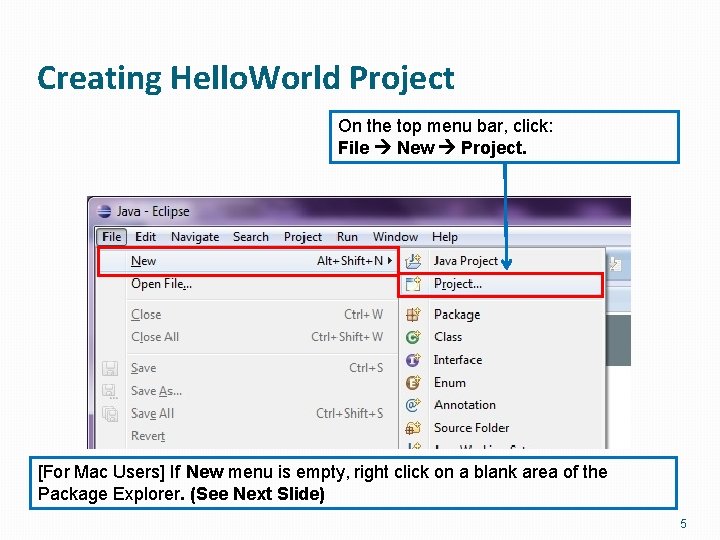
Creating Hello. World Project On the top menu bar, click: File New Project. [For Mac Users] If New menu is empty, right click on a blank area of the Package Explorer. (See Next Slide) 5

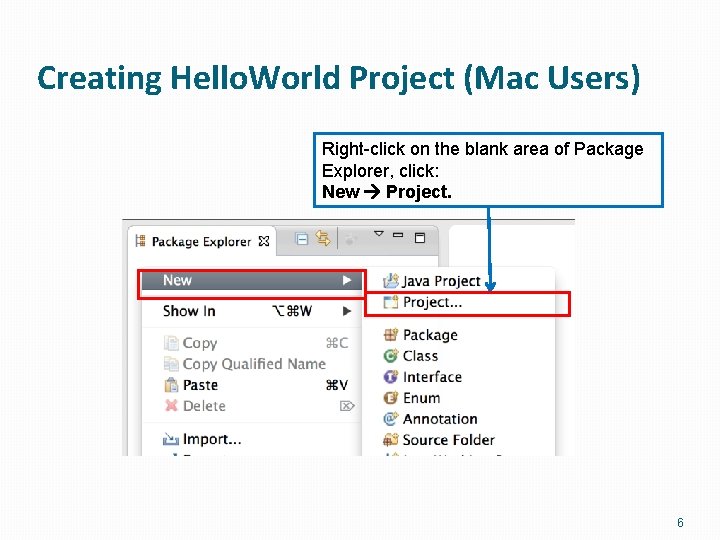
Creating Hello. World Project (Mac Users) Right-click on the blank area of Package Explorer, click: New Project. 6

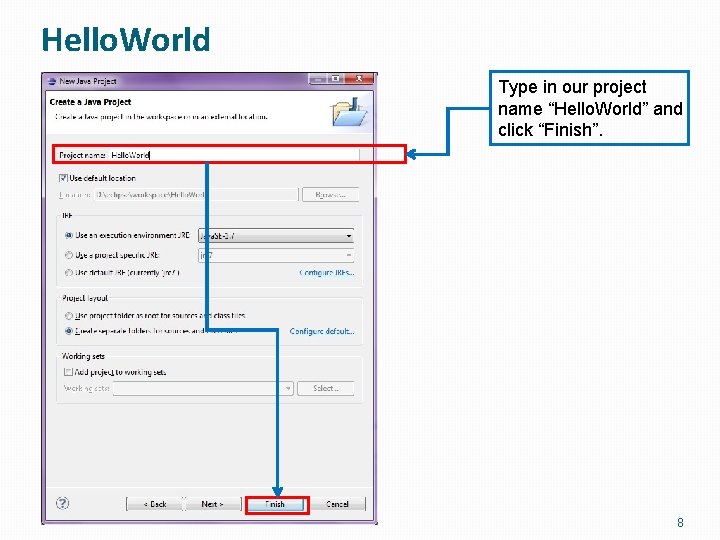
Hello World! Select “Java Project” from the wizard, and click “Next>” 7

Hello. World Type in our project name “Hello. World” and click “Finish”. 8

The Workbench That should bring you to the ‘Workbench’. It has following main components. The package explorer pane displays the various files (some source, some bytecode) included in your project in the form of a tree. Click the triangular buttons to the left of the individual folders to expand or collapse them. (If a folder is empty, the expand/collapse button is not displayed) This is where various output from the IDE are displayed. We are currently at the Problems pane. This is the editor area. Since no file is opened, it’s blank. Task list is the place where you can assign tasks within the project. The Outline pane displays an outline of a structured file that is currently open in the editor area, and lists structural elements. 9

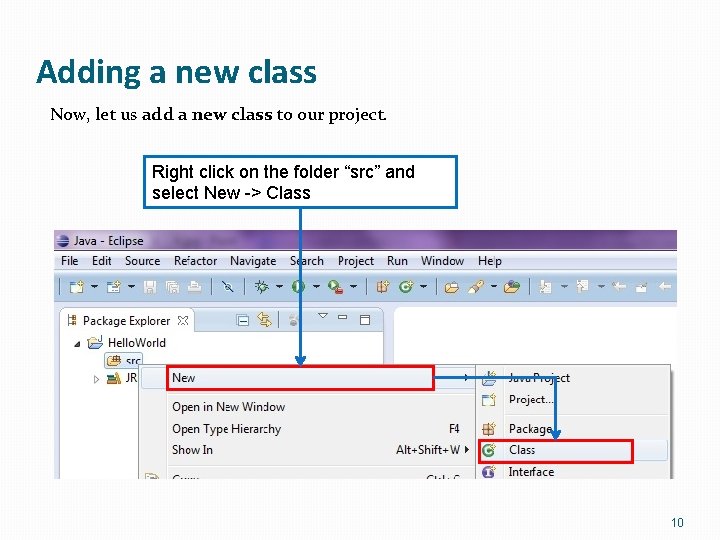
Adding a new class Now, let us add a new class to our project. Right click on the folder “src” and select New -> Class 10

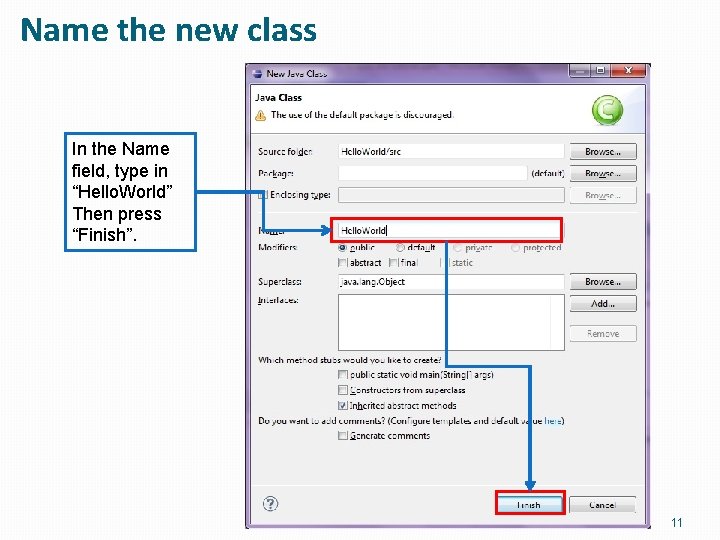
Name the new class In the Name field, type in “Hello. World” Then press “Finish”. 11

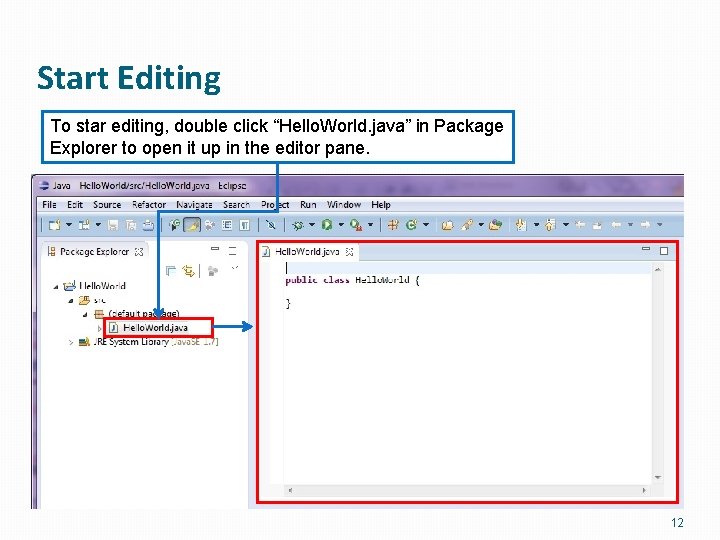
Start Editing To star editing, double click “Hello. World. java” in Package Explorer to open it up in the editor pane. 12

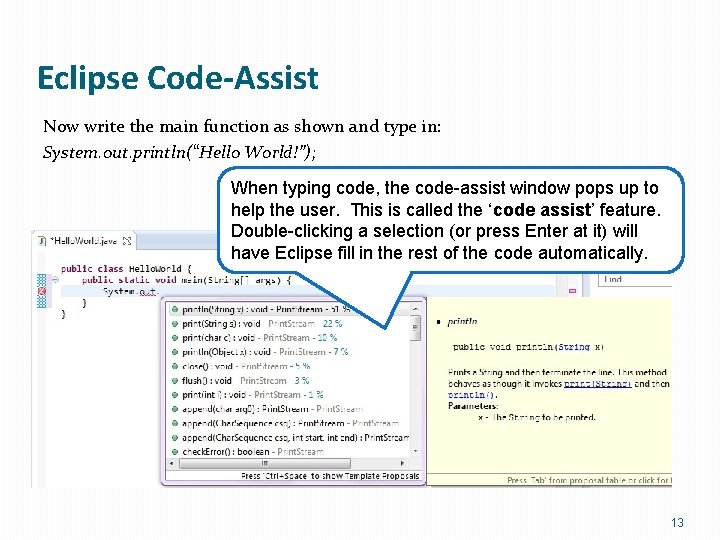
Eclipse Code-Assist Now write the main function as shown and type in: System. out. println(“Hello World!”); When typing code, the code-assist window pops up to help the user. This is called the ‘code assist’ feature. Double-clicking a selection (or press Enter at it) will have Eclipse fill in the rest of the code automatically. 13

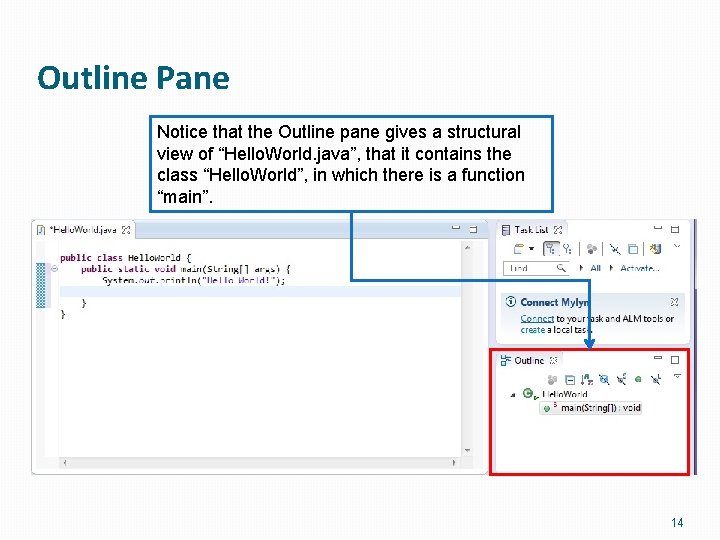
Outline Pane Notice that the Outline pane gives a structural view of “Hello. World. java”, that it contains the class “Hello. World”, in which there is a function “main”. 14

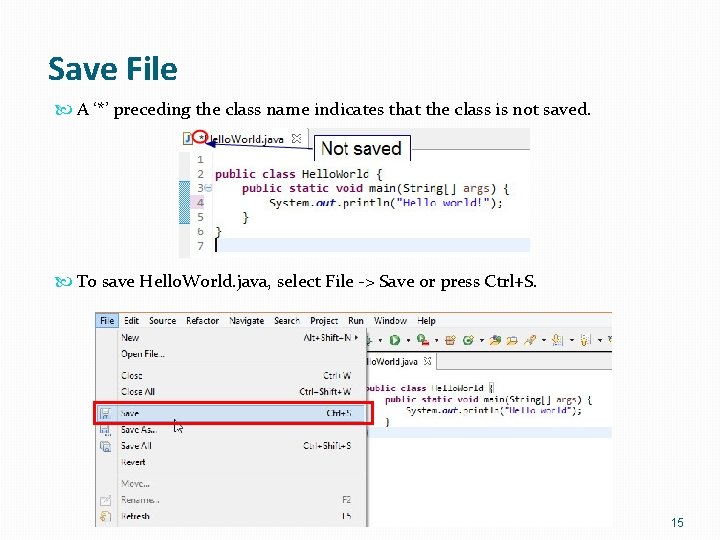
Save File A ‘*’ preceding the class name indicates that the class is not saved. To save Hello. World. java, select File -> Save or press Ctrl+S. 15

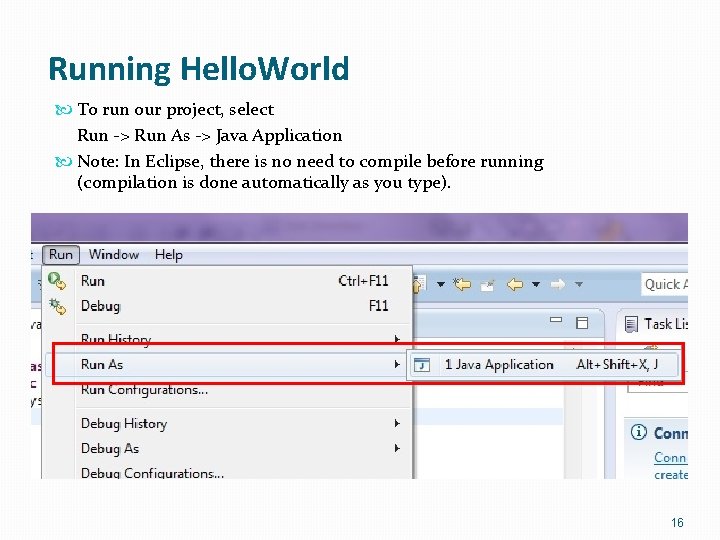
Running Hello. World To run our project, select Run -> Run As -> Java Application Note: In Eclipse, there is no need to compile before running (compilation is done automatically as you type). 16

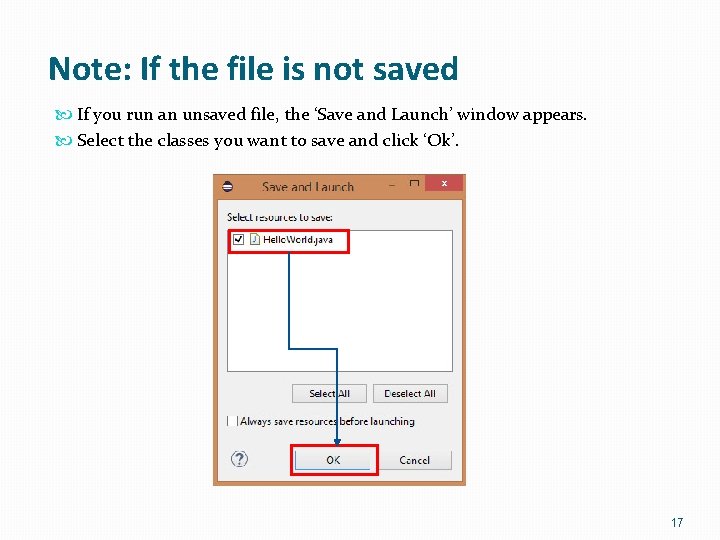
Note: If the file is not saved If you run an unsaved file, the ‘Save and Launch’ window appears. Select the classes you want to save and click ‘Ok’. 17

Output Program output is displayed below the editor window under the ‘Console’ tab 18

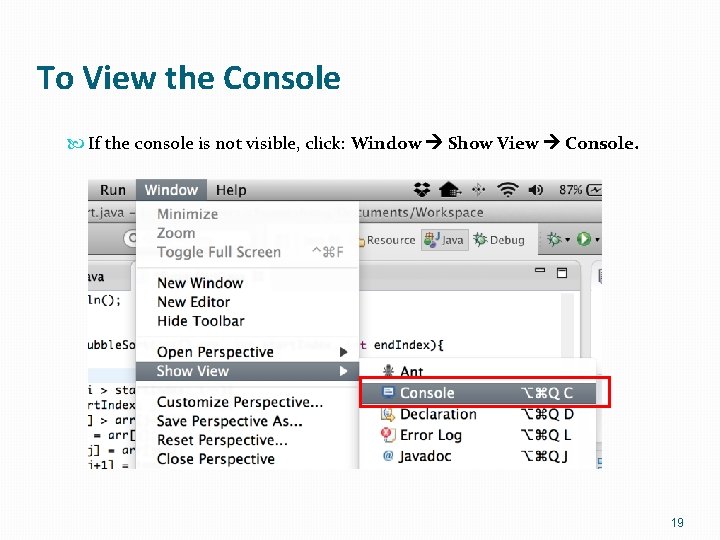
To View the Console If the console is not visible, click: Window Show View Console. 19

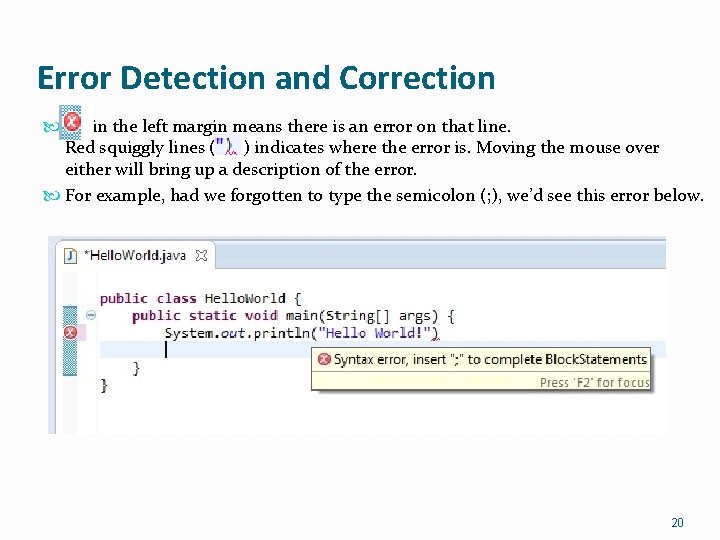
Error Detection and Correction in the left margin means there is an error on that line. Red squiggly lines ( ) indicates where the error is. Moving the mouse over either will bring up a description of the error. For example, had we forgotten to type the semicolon (; ), we’d see this error below. 20

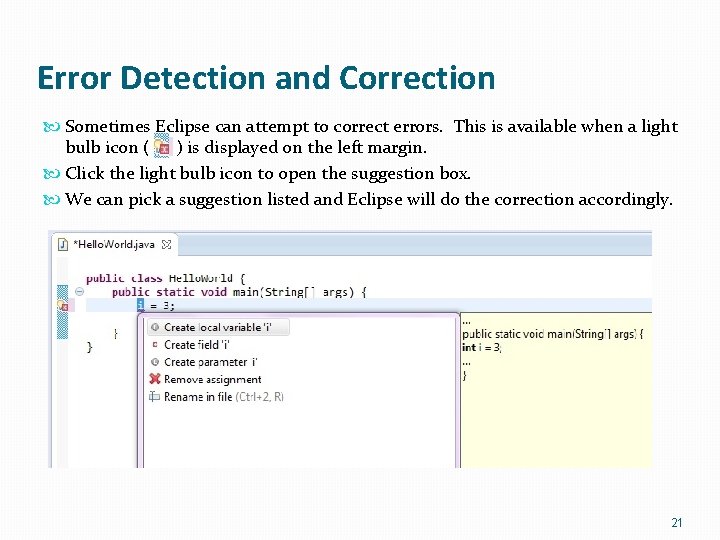
Error Detection and Correction Sometimes Eclipse can attempt to correct errors. This is available when a light bulb icon ( ) is displayed on the left margin. Click the light bulb icon to open the suggestion box. We can pick a suggestion listed and Eclipse will do the correction accordingly. 21

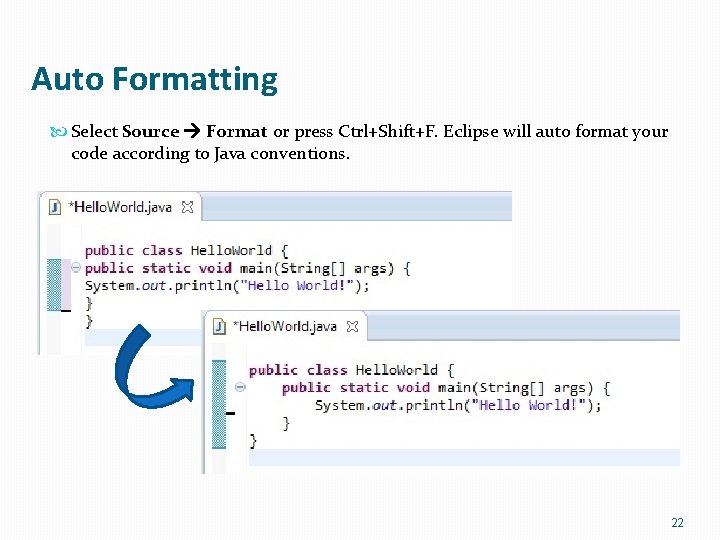
Auto Formatting Select Source Format or press Ctrl+Shift+F. Eclipse will auto format your code according to Java conventions. 22

Part B: Debugging

Eclipse Debugger Eclipse contains a powerful debugger that enables us to easily find and fix problems. It lets us suspend a program during execution, in order to allow the user to step through the code line by line. We will demonstrate the basic functionality of the debugger first and then debug a buggy program. 24

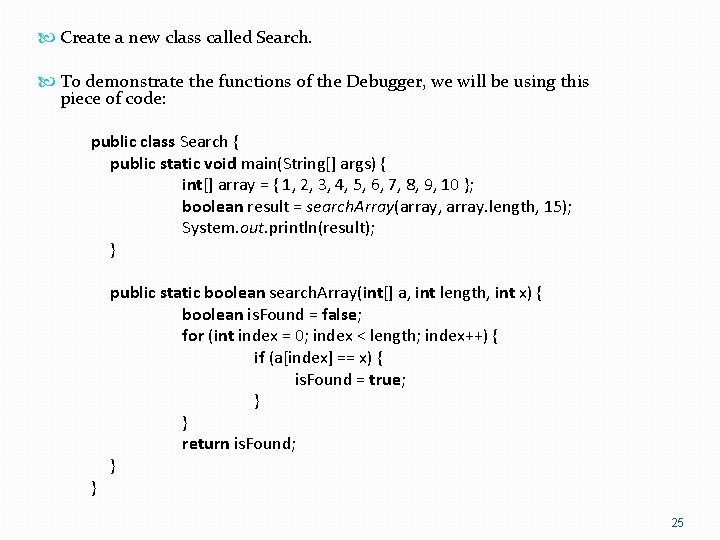
Create a new class called Search. To demonstrate the functions of the Debugger, we will be using this piece of code: public class Search { public static void main(String[] args) { int[] array = { 1, 2, 3, 4, 5, 6, 7, 8, 9, 10 }; boolean result = search. Array(array, array. length, 15); System. out. println(result); } } public static boolean search. Array(int[] a, int length, int x) { boolean is. Found = false; for (int index = 0; index < length; index++) { if (a[index] == x) { is. Found = true; } } return is. Found; } 25

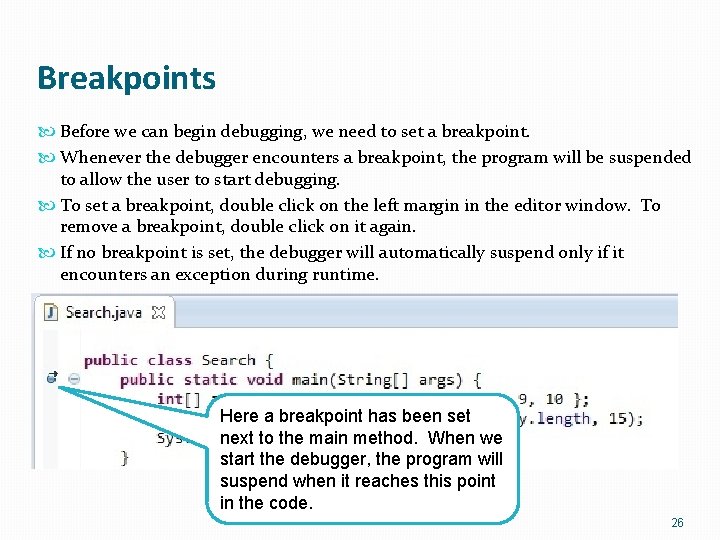
Breakpoints Before we can begin debugging, we need to set a breakpoint. Whenever the debugger encounters a breakpoint, the program will be suspended to allow the user to start debugging. To set a breakpoint, double click on the left margin in the editor window. To remove a breakpoint, double click on it again. If no breakpoint is set, the debugger will automatically suspend only if it encounters an exception during runtime. Here a breakpoint has been set next to the main method. When we start the debugger, the program will suspend when it reaches this point in the code. 26

Running The Debugger To run the Debugger, select Run -> Debug As -> Java Application This brings Eclipse to the Debug Perspective 27

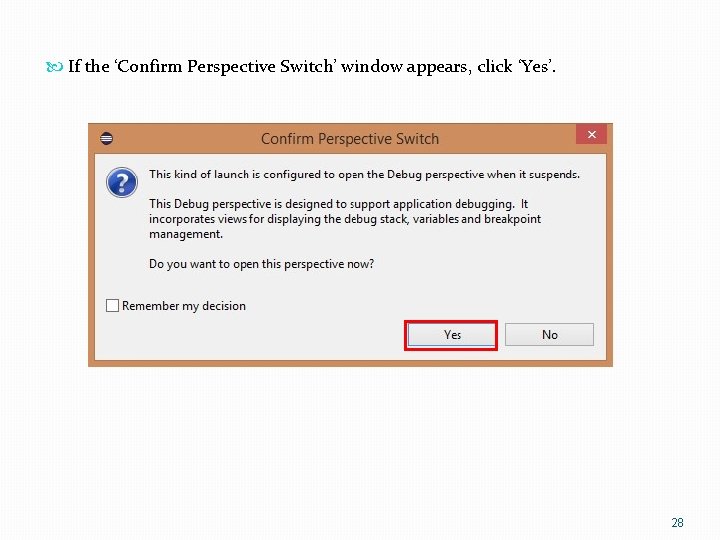
If the ‘Confirm Perspective Switch’ window appears, click ‘Yes’. 28

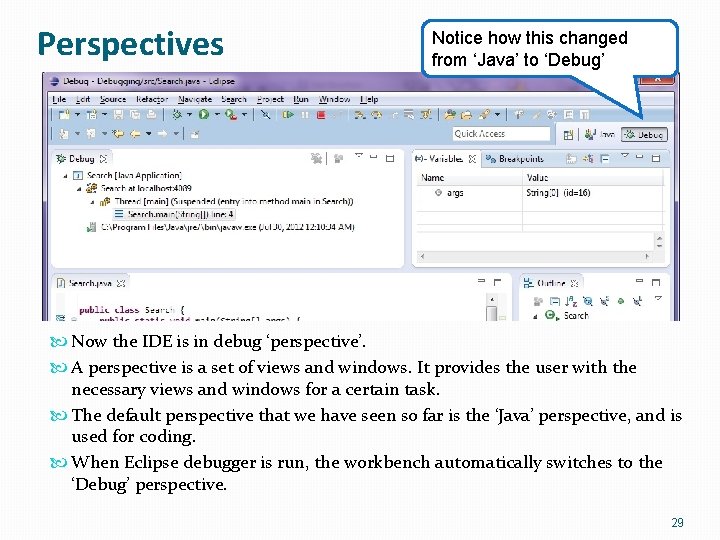
Perspectives Notice how this changed from ‘Java’ to ‘Debug’ Now the IDE is in debug ‘perspective’. A perspective is a set of views and windows. It provides the user with the necessary views and windows for a certain task. The default perspective that we have seen so far is the ‘Java’ perspective, and is used for coding. When Eclipse debugger is run, the workbench automatically switches to the ‘Debug’ perspective. 29

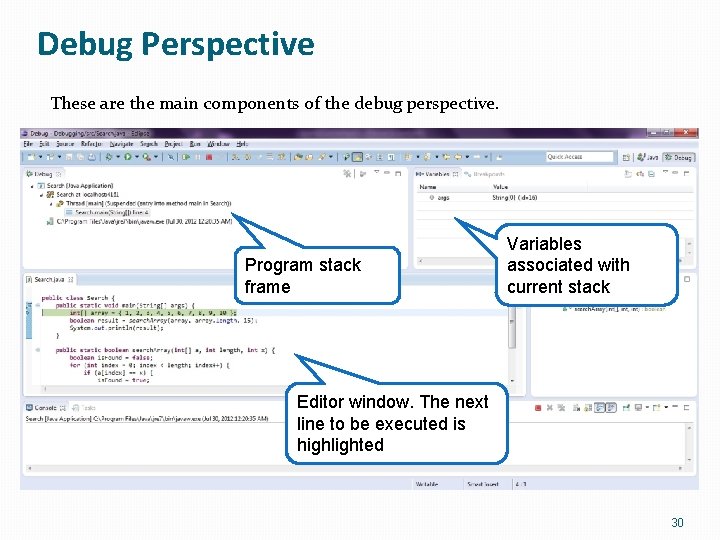
Debug Perspective These are the main components of the debug perspective. Program stack frame Variables associated with current stack Editor window. The next line to be executed is highlighted 30

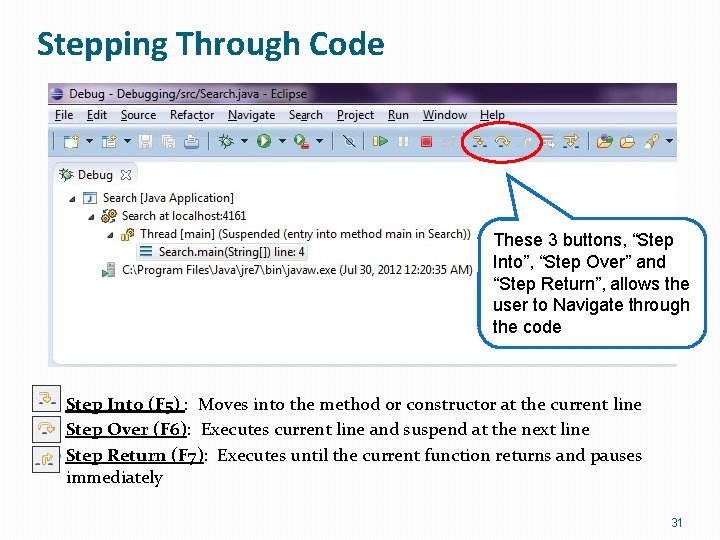
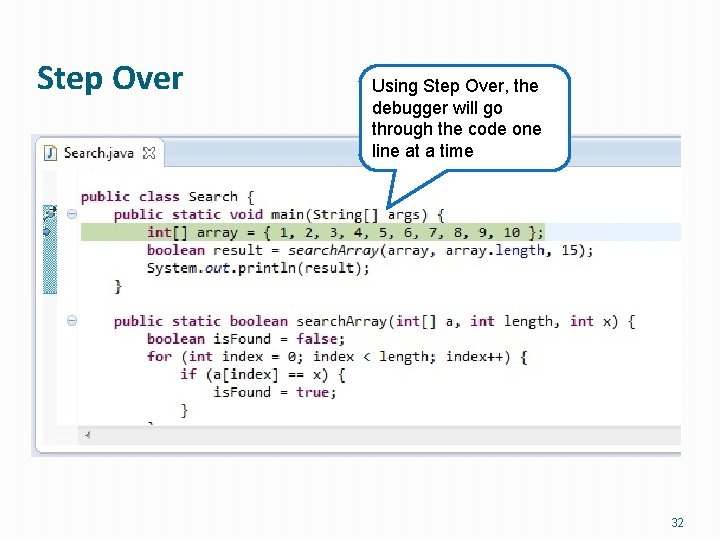
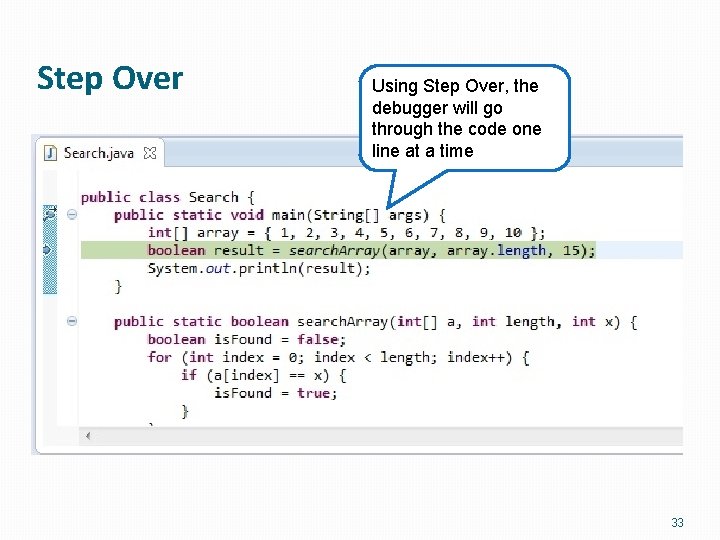
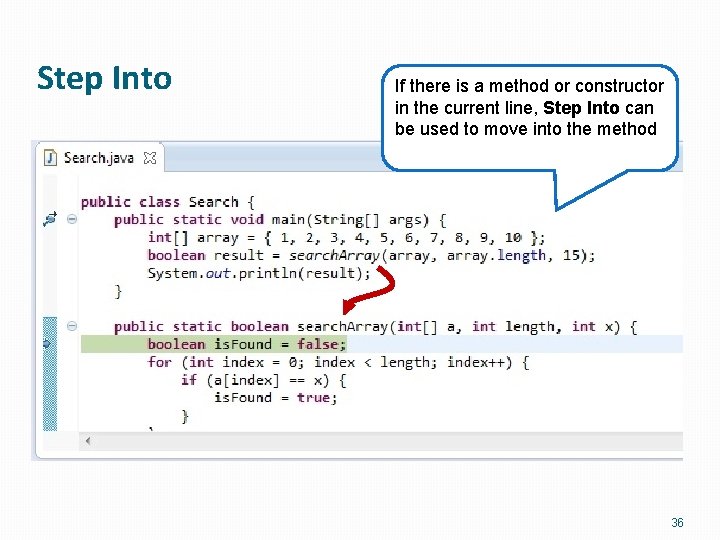
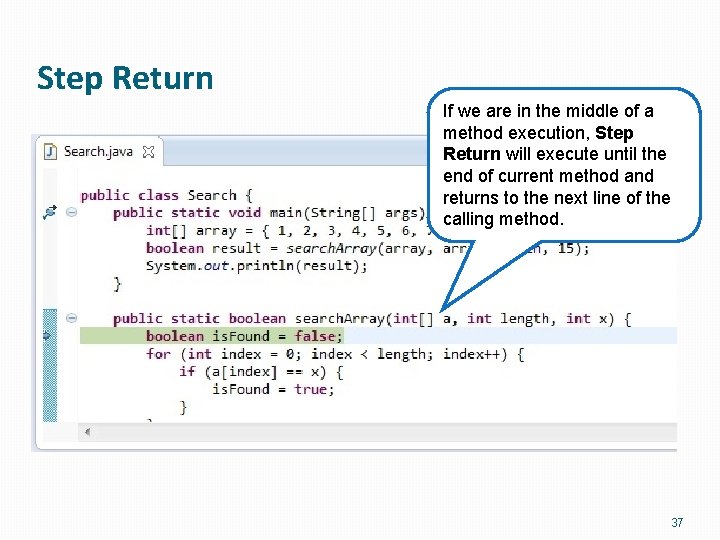
Stepping Through Code These 3 buttons, “Step Into”, “Step Over” and “Step Return”, allows the user to Navigate through the code Step Into (F 5) : Moves into the method or constructor at the current line Step Over (F 6): Executes current line and suspend at the next line Step Return (F 7): Executes until the current function returns and pauses immediately 31

Step Over Using Step Over, the debugger will go through the code one line at a time 32

Step Over Using Step Over, the debugger will go through the code one line at a time 33

Step Over Using Step Over, the debugger will go through the code one line at a time 34

Step Into If there is a method or constructor in the current line, Step Into can be used to move into the method 35

Step Into If there is a method or constructor in the current line, Step Into can be used to move into the method 36

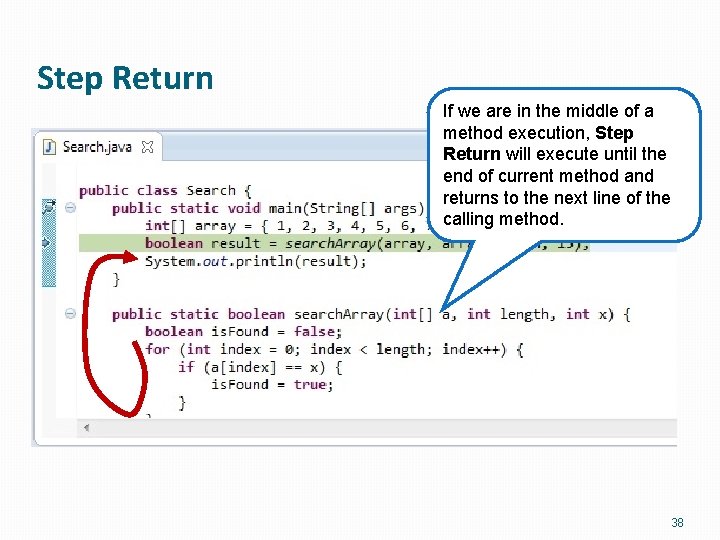
Step Return If we are in the middle of a method execution, Step Return will execute until the end of current method and returns to the next line of the calling method. 37

Step Return If we are in the middle of a method execution, Step Return will execute until the end of current method and returns to the next line of the calling method. 38

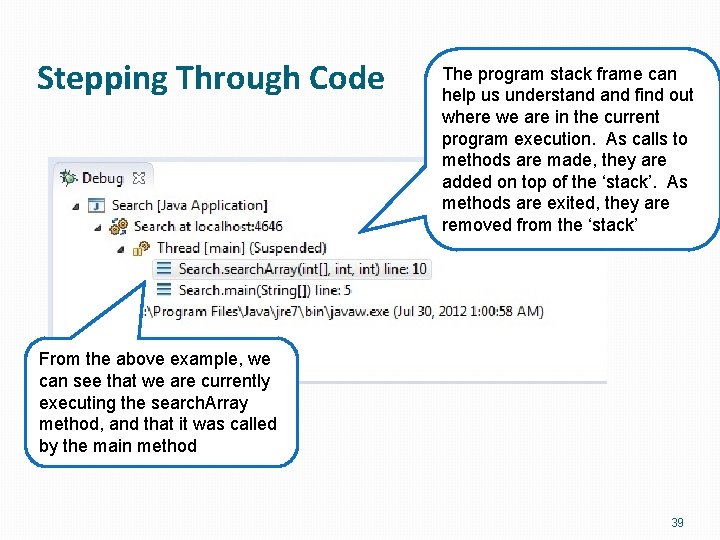
Stepping Through Code The program stack frame can help us understand find out where we are in the current program execution. As calls to methods are made, they are added on top of the ‘stack’. As methods are exited, they are removed from the ‘stack’ From the above example, we can see that we are currently executing the search. Array method, and that it was called by the main method 39

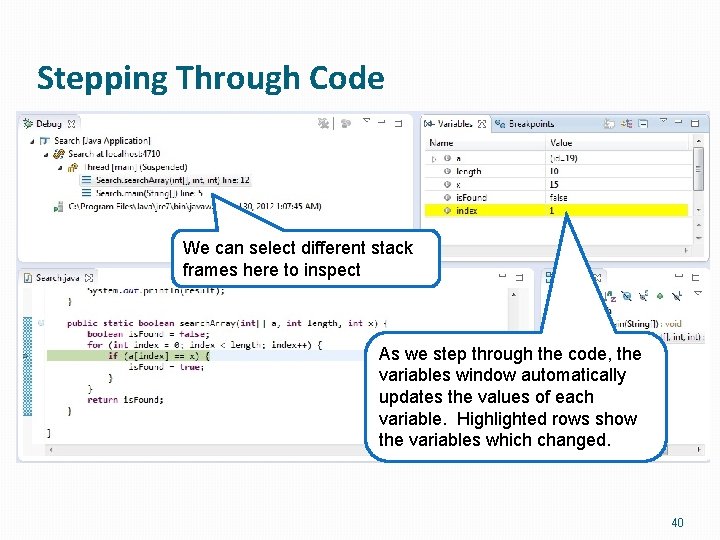
Stepping Through Code We can select different stack frames here to inspect As we step through the code, the variables window automatically updates the values of each variable. Highlighted rows show the variables which changed. 40

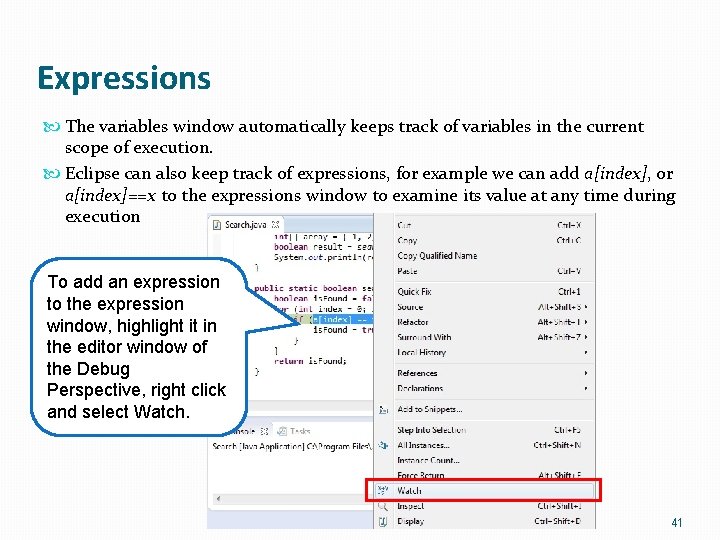
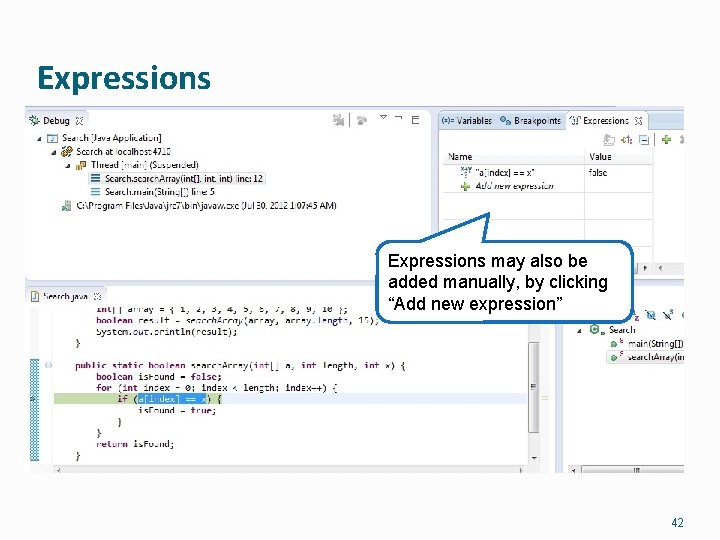
Expressions The variables window automatically keeps track of variables in the current scope of execution. Eclipse can also keep track of expressions, for example we can add a[index], or a[index]==x to the expressions window to examine its value at any time during execution To add an expression to the expression window, highlight it in the editor window of the Debug Perspective, right click and select Watch. 41

Expressions may also be added manually, by clicking “Add new expression” 42

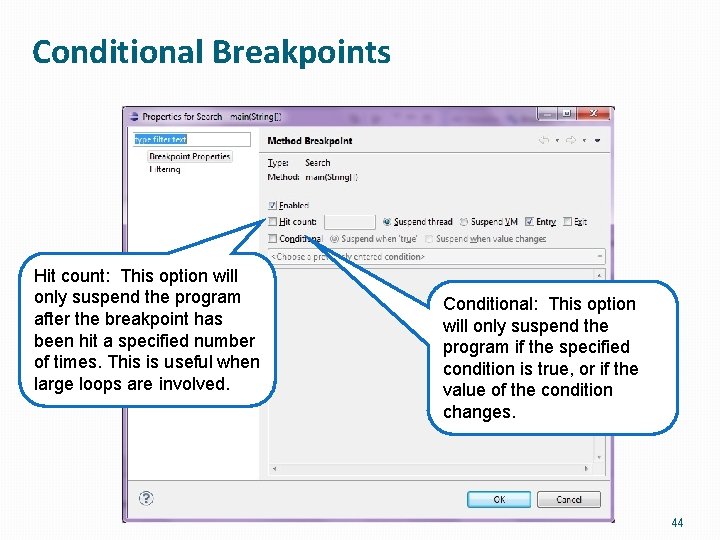
Conditional Breakpoints Conditional breakpoints may be used to give the user more flexibility when debugging To set conditions on a breakpoint, select the “Breakpoints” tab, right click on a breakpoint, and select “Breakpoint Properties…” 43

Conditional Breakpoints Hit count: This option will only suspend the program after the breakpoint has been hit a specified number of times. This is useful when large loops are involved. Conditional: This option will only suspend the program if the specified condition is true, or if the value of the condition changes. 44

Self-test Assignment: Buggy Sort Now time to get our hands dirty. Create a new Java project. Add a new class called “Buggy. Sort” Copy the contents of Buggy. Sort class in the next slide into the “Buggy. Sort” class your created. It is supposed to print an array, sort it then print the sorted array. Now run the program. 45
![public class Buggy Sort public static void print Arrayint arr int start Index public class Buggy. Sort { public static void print. Array(int[] arr, int start. Index,](https://slidetodoc.com/presentation_image_h/977d99dbaa604bbdba8f22ceaf90a23f/image-46.jpg)
public class Buggy. Sort { public static void print. Array(int[] arr, int start. Index, int end. Index) { int i; for (i = start. Index; i <= end. Index; i++) { System. out. print(arr[i] + " "); } System. out. println(); } public static void bubble. Sort(int[] arr, int start. Index, int end. Index) { int i, j, temp; for (i = end. Index; i > start. Index; i--) { for (j = start. Index; j < i; i++) { if (arr[j] > arr[j + 1]) { temp = arr[j]; arr[j] = arr[j + 1]; arr[j + 1] = temp; } } public static void main(String args[]) { int data[] = { 45, 2, 33, 11, 5, 9, 7, 21, 10, 67, 99, 123, 42, 81, 100, 54 }; System. out. println("our numbers: "); print. Array(data, 0, 15); System. out. println(); bubble. Sort(data, 0, 15); System. out. println("after sorting: "); print. Array(data, 0, 15); System. out. println(); } } 46

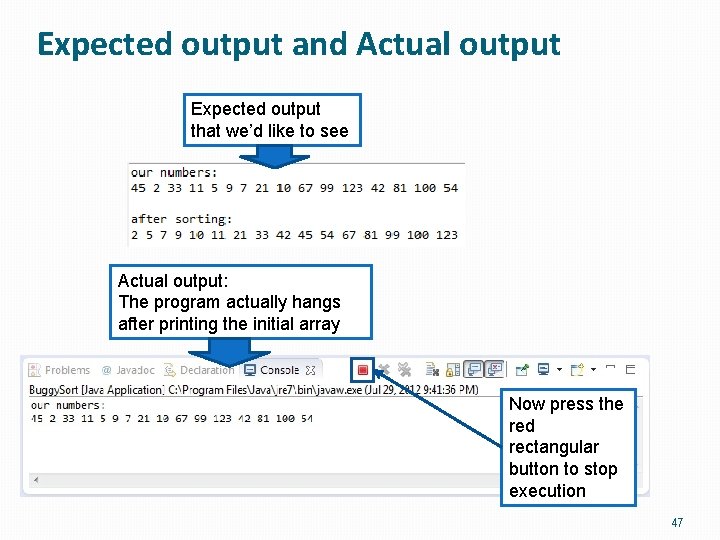
Expected output and Actual output Expected output that we’d like to see Actual output: The program actually hangs after printing the initial array Now press the red rectangular button to stop execution 47

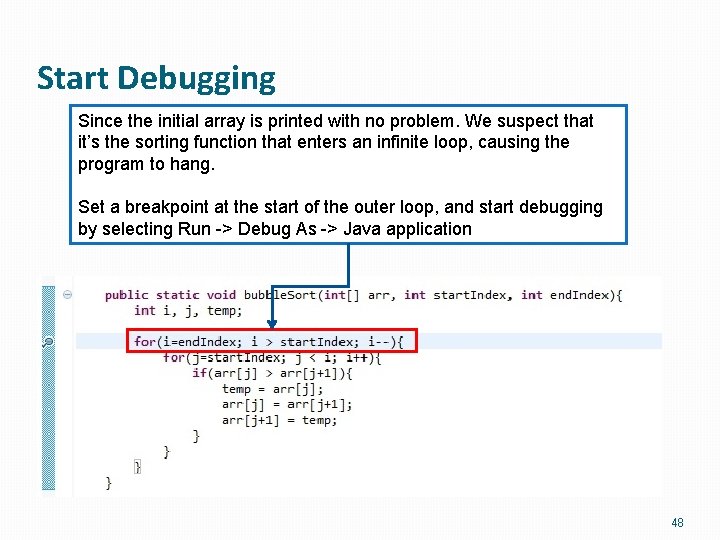
Start Debugging Since the initial array is printed with no problem. We suspect that it’s the sorting function that enters an infinite loop, causing the program to hang. Set a breakpoint at the start of the outer loop, and start debugging by selecting Run -> Debug As -> Java application 48

Step through the inner loop once Now the program pauses at the starting point of the outer loop. We want to check the loop indices as the loops step through iterations. So, step through the inner loop once and pause at the start of the inner loop. 49

Check loop indices Current loop indices i and j have values of 15 and 0 respectively, which are correct. As we step over the wrapping up of the loop, we notice the value of i has changed from 15 to 16, as highlighted by the IDE with the yellow color. This is wrong, we were expecting j to increment. 50

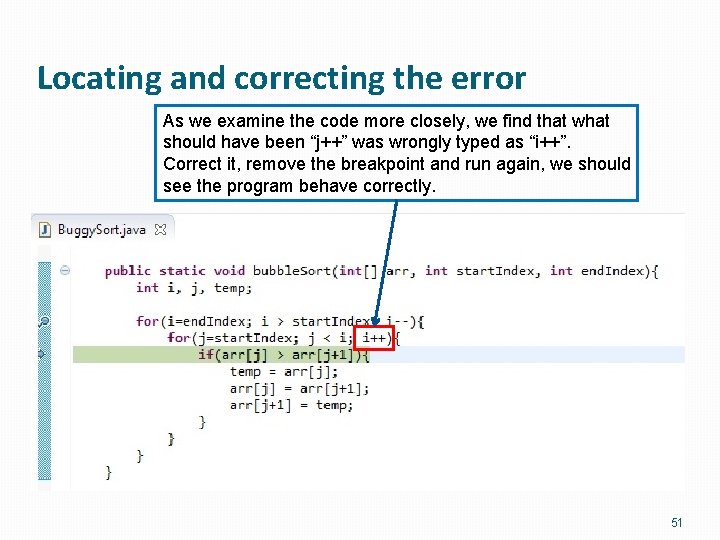
Locating and correcting the error As we examine the code more closely, we find that what should have been “j++” was wrongly typed as “i++”. Correct it, remove the breakpoint and run again, we should see the program behave correctly. 51

End