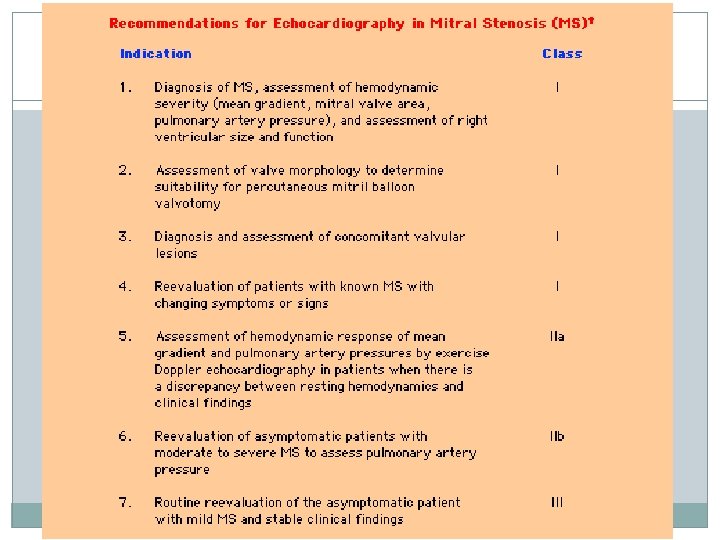
ECHOCARDIOGRAPHY IN MITRAL STENOSIS DR RAJESH K F


 index �Distance between the tips of the mitral leaflets in")


 �shorten PHT")


 �AR-")


- Slides: 92
ECHOCARDIOGRAPHY IN MITRAL STENOSIS DR RAJESH K F
CAUSES AND ANATOMIC PRESENTATION Rheumatic �Commissural fusion �Leaflet thickening �Chordal shortening and fusion �Superimposed calcification Degenerative MS �Annular calcification �Rarely leaflet thickening and calcification at base
Congenital MS �Subvalvular apparatus abnormalities Inflammatory-SLE Infiltrative Carcinoid heart disease Drug induced valve disease �Leaflet thickening and restriction �Rarely commissural fusion
2 D ECHO �Commissural fusion PSAX echo scanning of valve Important in distinguishing degenerative from rheumatic valve Complete fusion indicate severe MS Narrow diastolic opening of valve leaflets
�Restricted mobility - PLAX �Early diastolic doming motion of the AMLrestriction of tip motion
�Leaflet thickening -PLAX
�Chordal thickening, shortening and fusion – PLAX and A 4 C
�Superimposed calcification
�Dilated LA �LA and LA appendage thrombus �Paradoxical septal motion �Dilated RV and RA
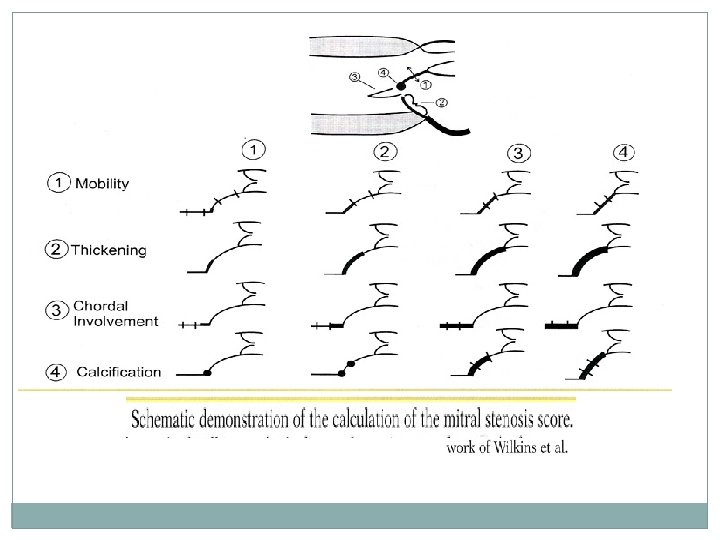
Wilkins score -Mitral valve score <8 are excellent candidates for BMV
Limitations of wilkin score � Assessment of commissural involvement is not included �Limited in ability to differentiate nodular fibrosis from calcification. �Doesn’t account for uneven distribution of pathologic abnormalities. �Frequent underestimation of subvalvular disease. �Doesn’t use results from TEE or 3 D echo
Cormier’s method
3 D ECHO �TEE and TTE �Higher accuracy than 2 D echo �Detailed information of commissural fusion and subvalvular involvement �MVA measurement in calcified and irregular valve �MVA measurement after BMV �Restenosis after commissurotomy commissural refusion valve rigidity with persistent commissural opening
From LA From LV
RT 3 DE score of MS severity
�Total RT 3 DE score ranging from 0 to 31 points �Total score of mild MV involvement was defined as <8 points �Moderate MV involvement 8– 13 �Severe MV involvement >14
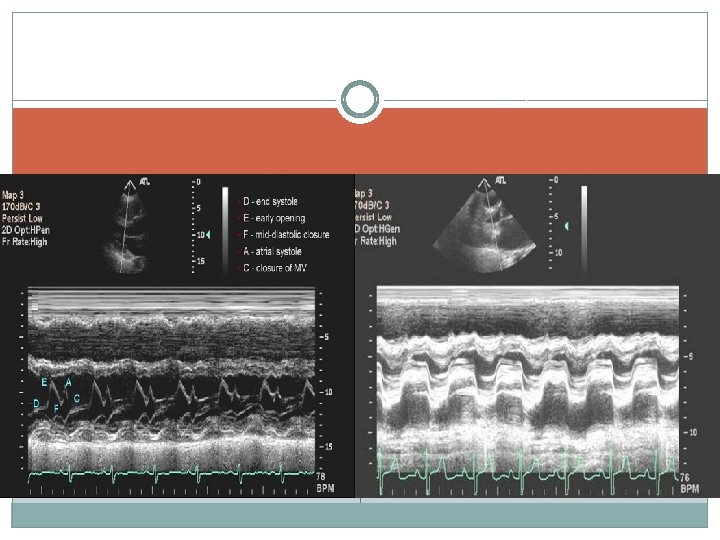
M MODE ECHO �Decreased E-F Slope �>80 mm/s MVA=4 -6 cm² <15 mm/s⇒ MVA <1. 3 cm² �Thickened Mitral Leaflets �Anterior Motion or Immobility of Posterior Mitral Leaflet-tethering at tips �Diastolic Posterior Motion of Ventricular Septum (severity of stenosis)
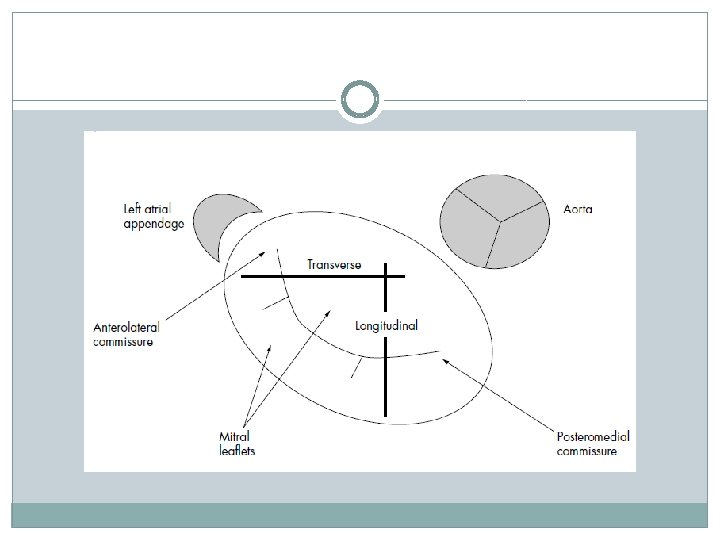
TEE � For diagnosis and quantification little yield � Spontaneous echo contrast � LA and LA appendage thrombus � Use of transgastric plane 90 -1200 for evaluation of chordal structures � Assessment of commissural calcification and fusion to predict procedural outcome after BMV
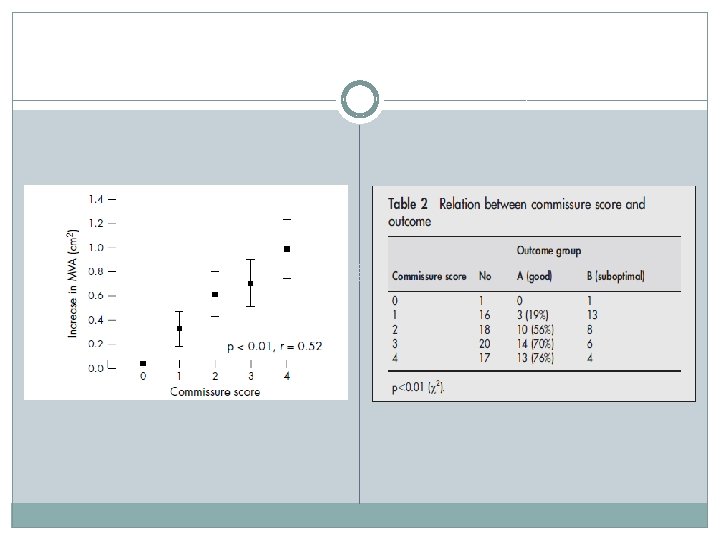
Commissure score NON CALCIFIED FUSION ANTEROLATERAL COMMISSURE POSTEROMEDIAL COMMISSURE ABSENT 0 0 PARTIAL 1 1 EXTENSIVE 2 2 TOTAL SCORE O TO 4
�Scores for anterolateral and posteromedial commissures were combined such that each valve had an overall commissure score ranging from 0– 4 �A high score indicated extensively fused, non‐calcified commissures that were therefore more likely to split �A low score indicated either minimal fusion or the presence of resistant commissural calcification
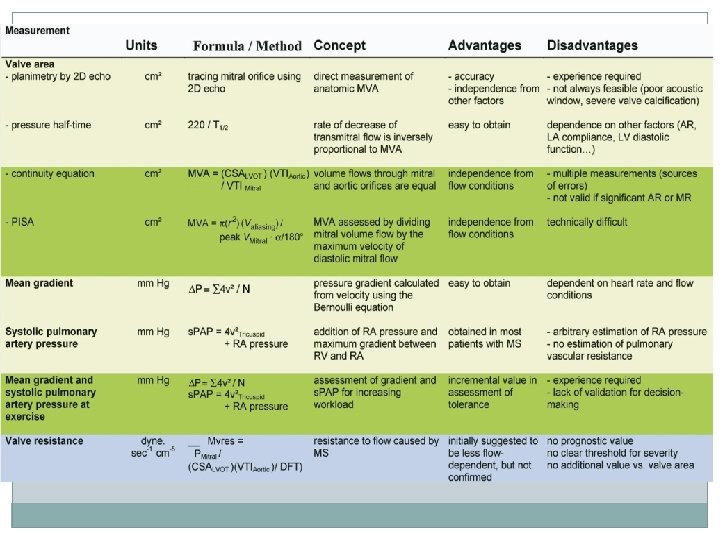
ASSESSMENT OF MS SEVERITY 2 D OR 3 D ECHO �MVA BY PLANIMETRY DOPPLER �PRESSURE GRADIENTS �MVA BY PHT �CONTINUITY EQATION �PISA �MITRAL VALVE RESISTANCE �PASP
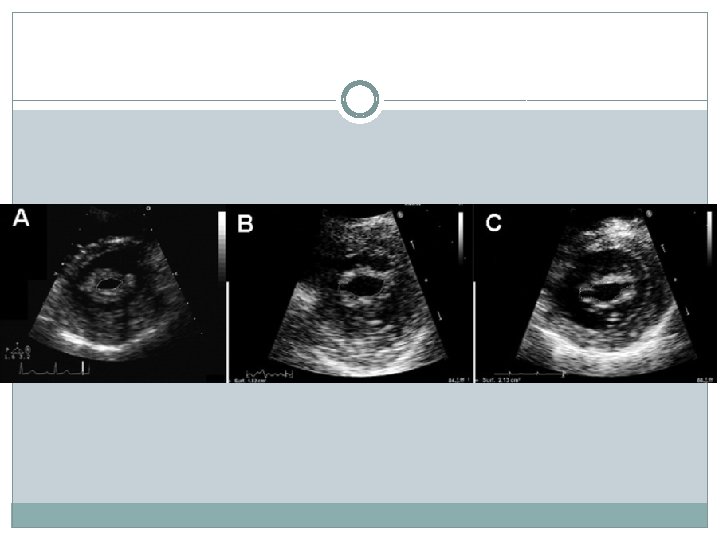
MVA BY PLANIMETRY 2 D Echo �Best correlation with anatomical area �Scanning method to avoid overestimation �measured at leaflet tips in a plane perpendicular to mitral orifice �Elliptical in shape �Direct measure of mitral orifice including opened commissures in PSAX
�Excessive gain setting may underestimate valve area �Zoom mode is better for delineation �Harmonic imaging can improve planimetry measurement �Optimal time is mid diastole obtained by cine loop mode on a frozen image �Multiple measurements in AF or incomplete commissural fusion �difficult in calcified valve, chest deformity and previous commissurotomy
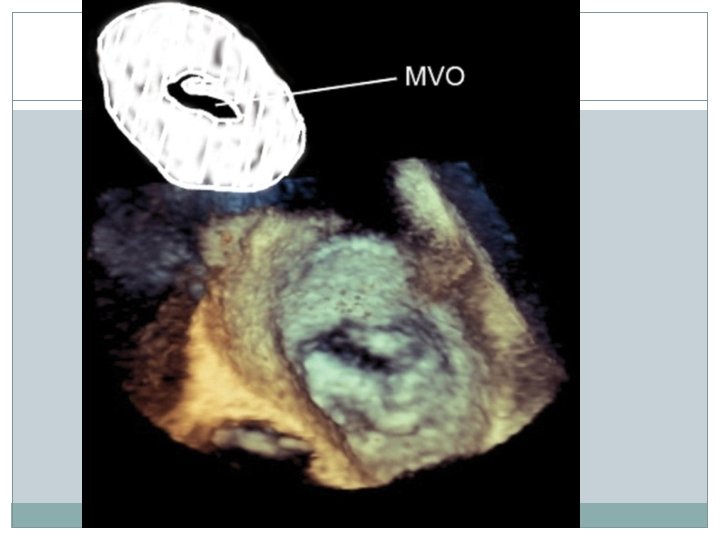
Real time 3 D echocardiography �identify true smallest orifice independent of its orientation �most accurate ultrasound technique for measuring MVA, with a superior pre- and postprocedural agreement with the Gorlin’s derived MVA �Less experience dependent and more reproducible
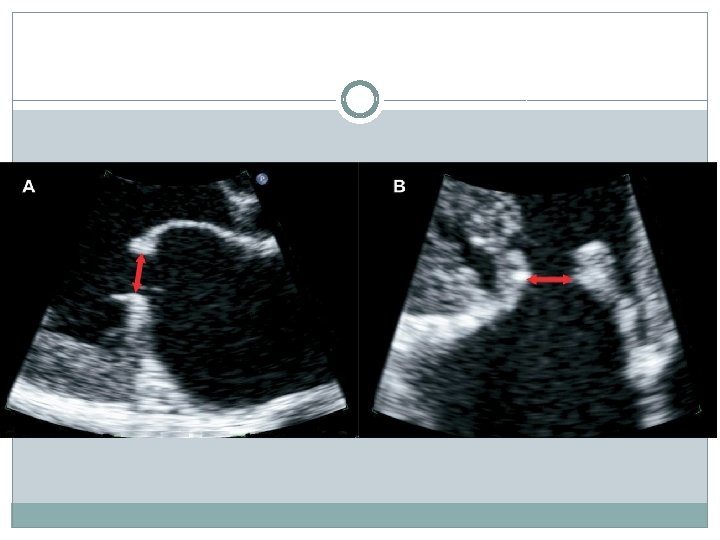
Mitral leaflet separation (MLS) index �Distance between the tips of the mitral leaflets in parasternal long-axis and four-chamber views �it can be used as a semiquantitative method for the assessment of MS severity �A value of 1. 2 cm or more provided a good specificity and PPV for the diagnosis of non severe MS �less than 0. 8 cm -severe MS. �It is not accurate in patients with heavy mitral valvular calcification and post BMV
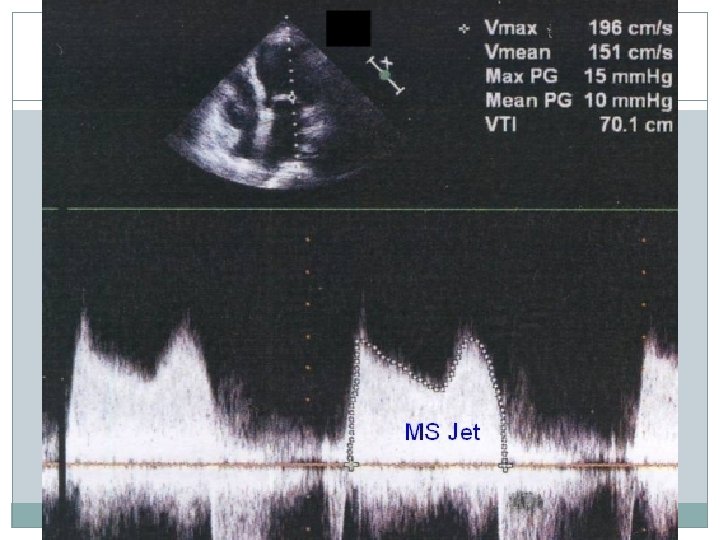
PRESSURE GRADIENT �Apical window �CWD /PWD at or after tip of mitral valve �Maximal and mean gradient �Bernoulli equation( P =4 V 2) �Derived from transmitral velocity flow curve �Heart rate to be mentioned �CD to identify eccentric mitral jet
�Maximal gradient influenced by LA compliance and LV diastolic function �In AF average of 5 cycles with least variation of R-R interval and as close possible to normal HR �MVG dependent on HR, COP and associated MR �Tachycardia, increased COP and associated MR overestimates gradient �Maximal gradient is markedly affected
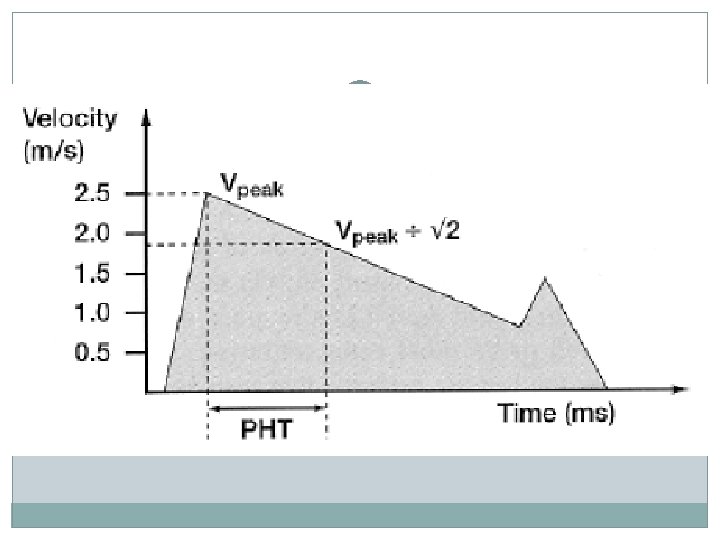
PRESSURE HALF TIME �T 1/2 is time interval in msecs between max mitral gradient in early diastole and time point where gradient is half max gradient �Or it is the time when velocity falls to 1/1. 414 peak �PHT related to decceleration time �PHT =. 29 x DT �MVA=220/PHT
�The empirically determined constant of 220 is proportional to the product of net compliance of left atrium and LV, and the square root of maximum transmitral gradient in a model that does not take into account active relaxation of LV
�Obtained by tracing deceleration slope of E wave on Doppler spectral display �Concave not feasible �If slope is bimodal deceleration slope in mid diastole rather than early diastole is traced
AF avoid short cycles and average different cardiac cycles
�Less dependent on COP or coexistent MR �Useful when mean transmitral gradient is misleading �MR -transmitral gradient overesimated �Low COP –mean transmitral gradient - underestimated
MS MS+MR MR
Factors that may affect PHT by influencing LA pressure decline More rapid LA pressure decline shorten PHT LA draining to second chamber –ASD �LA pressure drop rapidly �PHT shortened Stiff LA –low LA compliance �LA pressure drop rapidly �PHT shortened
Factors affect PHT by influencing LV pressure rise More rapid LV pressure rise shorten PHT If LV fills from a second source PHT –AR �LV pressure rise more rapidly �PHT will be shortened If LV is stiff-low ventricular compliance �LV pressure may rise more rapidly �PHT will be shortened
�All factors affect PHT (ASD, AR, low LA or LV compliance ) �shorten PHT �Leads to overestimation of MVA �Therefore PHT never under estimate MVA �Therefore if PHT >220 MS is severe �If PHT is < 220 consider other methods to assess severity
�Prosthetic MVA �Not been validated �Affected mainly by DD �More accurate method is continuity equation
Not reliable After BMV �Normally LA and LV compliance counteract each other �when gradient and compliance are subject to important and abrupt changes alter relation between PHT and MVA �Upto 48 hrs post BMV
CONTINUITY EQATION LVOT AREA
�MVA X VTI mitral= LVOT area X VTI aortic �MVA = �MVA= LVOT area X VTI aortic VTI mitral p D 2 X VTI aortic 4 VTI mitral �D is diameter of LVOT in CM and VTI in CM �SV can be estimated from PA �Method not useful in AF, AR or MR �Useful in degenerative calcific MS
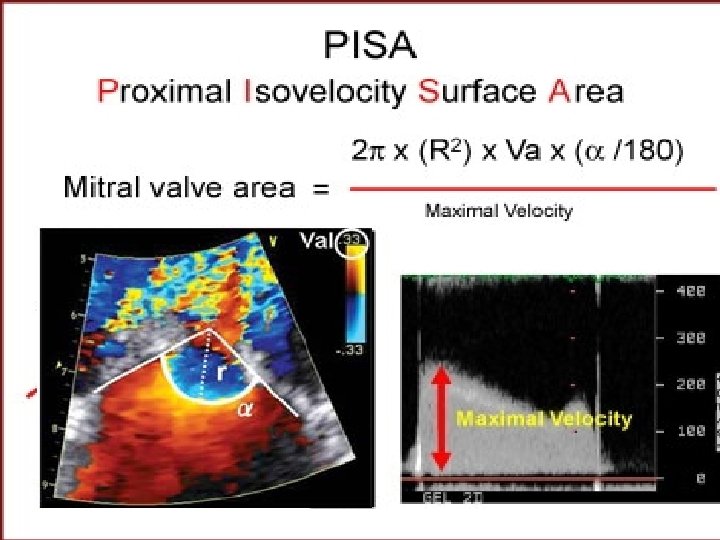
PISA �Based on hemispherical shape of convergence of diastolic mitral flow on atrial side of mitral valve and flow acceleration blood towards mitral valve
MVA x MV = PISA x AV MVA = PISA = MVA = PISA x AV MV 2 pr 2 x a 180 2 pr 2 x AV x a MV 180
�Zoom on the flow convergence �Upshift the baseline velocity and use an aliasing velocity of 20– 30 cm/s �Measure the radius of the flow convergence region and the transmitral velocity at the same time in early diastole �Measure the α angle formed by the mitral leaflets �Use of a fixed angle value of 100° can provide an accurate MVA estimation in patients with MS.
�Can be used in presence of significant MR, AR, differing heart rhythms �Not affected by LA, LV compliance �Multiple measurements required �M mode improves accuracy
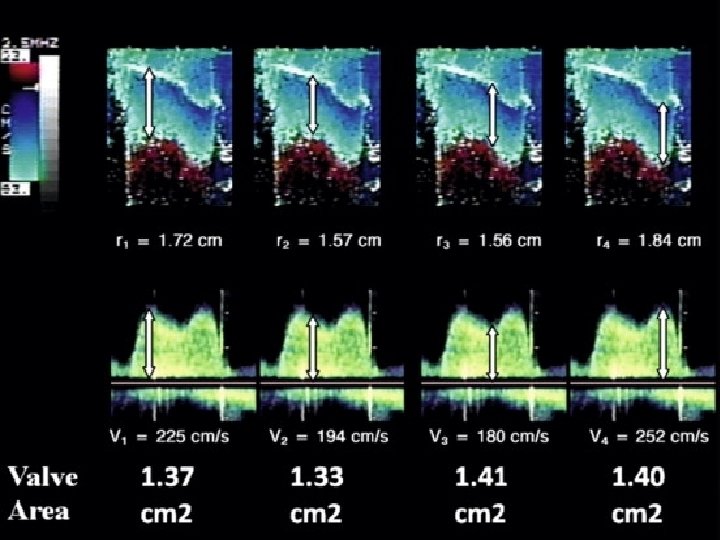
Colour M-mode PISA �Instantaneous measurement of MVA throughout diastole �Under guidance of magnified 2 D colour imaging, colour M-mode tracings were recorded by placing the M-mode cursor line through the centre of the flow convergence. � Diastole was divided into four phases of equal duration: early, mid-late, and late diastole. �Peak radius of flow convergence was measured during each phase to calculate mitral flow rate
�Each radius was measured from the red–blue aliasing level to the tip of the leaflet at the orifice �Colour M-mode analysis was then paired with continuous wave Doppler �Three to five measurements of each variable (on matched cycle for colour M-mode and Doppler methods) were averaged, depending on the patient's rhythm. �MVA was then calculated separately for each phase of diastole
MITRAL VALVE RESISTANCE �MVR=Mean mitral gradient/ transmitral diastolic flow rate �Transmitral diastolic flow rate= SV/DFP �It correlate well with pulmonary artery pressure
PASP �CWD �Estimation of the systolic gradient between RV and RA �Multiple acoustic windows to optimize intercept angle �Estimation of RAP according to IVC diameter
STRESS ECHOCARDIOGRAPHY �Useful to unmask symptoms in patients with MVA<1. 5 cm 2 and no or doubtful complaints �Discrepancy between resting doppler and clinical findings �Semi-supine echocardiography exercise (30 to 60 secs of leg lifts) is now preferred to post exercise echocardiography �Allows monitoring gradient and pulmonary pressure in each step of increasing workload
�Mean mitral gradient and PASP to be assessed during exercise �Mean gradient >15 mmhg with exercise is considered severe MS �A PASP > 60 mm. Hg on exercise has been proposed as an indication for BMV �Dobutamine stress echo mean gradient >18 mmhg with exercise is considered severe MS
Associated lesions �Quantitation of LAE �Associated MR and its mechanism �Severity AS (underestimated) �AR- t 1/2 method to assess MS is not valid �TR , tricuspid annulus �Secondary pulmonary HTN-TR
GRADING OF SEVERITY OF MS MILD MODERATE SEVERE 1 -1. 5 <1 5 -10 >10 30 -50 >50 SPECIFIC VALVE AREA(cm 2) >1. 5 NONSPECIFIC MEAN GRADIENT (mm. Hg) PASP <5 (mm. Hg) <30
THANK U
1 Pressure half time in MS affected by all except �A ASD �B MR �C AR �D HOCM
2 In case of a pure MS transmitral mean gradient is 14 mmhg and mitral area by planimetry is 1. 1 cm 2 it is graded as �A severe �B moderate �C mild �D indeterminate
3 Commissural fusion is not a feature of MS in �A RHD �B Calcific MS �C SLE �D Carcinoid disease
4 Not included in Wilkins score is �A commissural fusion �B restricted mobility �C leafllet thickening �D subvalvular fusion
5 harmonic imaging useful in �A 2 D MVA �B PHT �C PISA �D M mode
6 mitral leaflet separation index less than ----cms indicate severe MS �A 0. 4 �B 0. 6 �C 0. 8 �D 0. 2
7 continuity equation useful in MVA calculation in �A AF �B AR �C MR �D Calcific MS
8 Mean gradient greater than ---- mmhg with exercise echocardiography is considered severe MS �A 10 �B 12 �C 15 �D 18
9 In a case of severe AR with MS mitral. PHT obtained is 280 severity of MS is �A mild �B moderate �C severe �D none of the above
10 Method to assess severity of MS in diastolic dysfunction is �A PHT �B PISA �C continuity equation �D mitral valve resistance
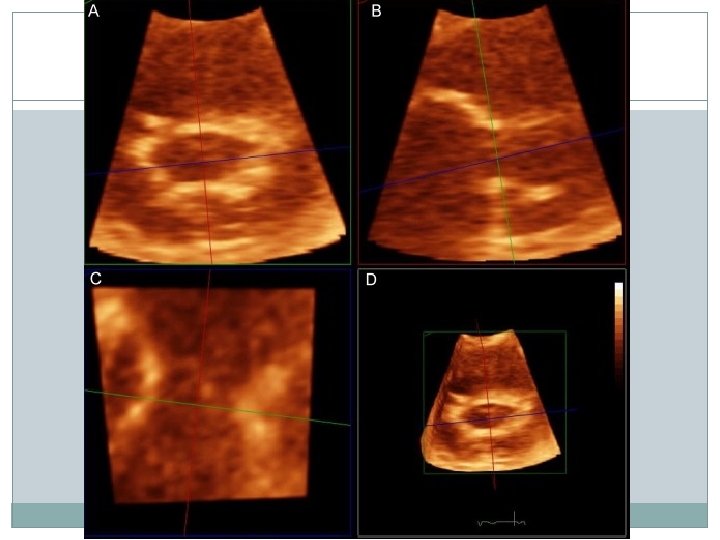
3 D echo planimetry �Mitral valve area measurement using anyplane echocardiography.
�allows on-line assessment of the mitral valve area. �Images are displayed as two simultaneous intersecting orthogonal long-axis scans (B-mode scans) and two perpendicular short-axis scans (Cmode scans) �These C-mode scans allow the display of short-axis views of the mitral valve from an apical transducer position
9 Usual mitral valve angle in PISA method to assess severity of MS is ----degree �A 80 �B 100 � C 150 �D 180