ECHOCARDIOGRAPHIC EVALUATION OF PULMONARY ARTERY PRESSURE INTRODUCTION Definition


 and the septolateral dimension(D")


 parasternal short axis apical 4 chamber view Co-axial")


 Sample volume in RVOT AT was")


 • TDI deployed at lateral tricuspid annulus")


")


 ≤ 0. 30 PH (PAEDP>20 mm")

2 + RAP 2. m. PAP")


- Slides: 76
ECHOCARDIOGRAPHIC EVALUATION OF PULMONARY ARTERY PRESSURE
INTRODUCTION Definition: Pulmonary hypertension - hemodynamic and pathophysiological condition defined as increase in mean PAP ≥ 25 mm Hg at rest assessed by right heart catheterisation. GRADE MPAP MILD 25 -40 MODERATE 41 -55 SEVERE >55 2015 ESC/ERS Guidelines for the diagnosis and treatment of pulmonary hypertension
Definition characteristics Clinical group Pulmonary hypertension PAPm ≥ 25 mm. Hg All Pre-capillary PH PAPm ≥ 25 mm Hg PAWP ≤ 15 mm Hg 1. Pulmonary arterial hypertension 3. PH due to lung diseases 4. Chronic thromboembolic PH 5. PH with unclear and/or multifactorial mechanism Post-capillary PH PAPm ≥ 25 mm Hg PAWP >15 mm Hg 2. PH due to left heart disease 5. PH with unclear and/or multifactorial etiology Isolated postcapillary PH DPG <7 mm Hg and/or PVR ≤ 3 WU Combined pre and postcapillary PH DPG ≥ 7 mm Hg and /or PVR > 3 WU
Clinical classification of pulmonary hypertension Group 1. 3. PULMONARY ARTERIAL HYPERTENSION GROUP PULMONARY HYPERTENSION DUE TO LUNG 2: LEFT HEART 1. Pulmonary arterial hypertension DISEASES AND/OR HYPOXIA DISEASE GROUP 4. CTPH AND OTHER PULMONARY ARTERIAL Idiopathic GROUP 5. PH WITH UNCLEAR AND/OR MULTIFACTORIAL OBSTRUCTION 1. Left ventricular systolic dysfunction Heritable MECHANISM 2. Pulmonary artery due to left heart disease 1. COPD CTPH 1. 2. Left ventricular diastolic dysfunction Drugs and toxins induced 1. Hematological disorders- hemolytic anemia, MPD, 2. 1 – angiosarcoma 2. ILD 3. Valvular disease Associated with : CTD, HIV, portal hypertension, CHD, 3. Pulmonary hypertension due to lung diseases and/or hypoxia splenectomy 2. 2 – other intravascular tumors schistosomiasis 3. Other pulmonary disease with mixed restrictive and 4. congenital/ acquired left heart inflow/outflow tract 2. Systemic disorders: sarcoidosis, pulmonary histiocytosis, obstructive pattern obstruction and congenital cardiomyopathies 2. 3 – arteritis I’ : pulmonary veno-occlusive disease and/or pulmonary lymphangioleiomyomatosis, neurofibromatosis 4. Chronic thromboembolic pulmonary hypertension and other pulmonary artery capillary hemnagiomatosis 4. sleep- disordered breathing 5. congenital/acquired pulmonary vein stensois 2. 4 – congenital pulmonary artery stenosis obstructions 3. Metabolic disorders: GSD, Gaucher disease, thyroid disorders I” : persistent pulmonary hypertension of the newborn 5. Aleveolar hypoventillation disorder 2. 5 – parasite (hydatiodsis) 4. other: pulmonary tumoral thrombotic microangiopathy, 6. Chronic exposure to high altitude fibrosing mediastinitis, chronic renal failure, segmental pulmonary hypertension 7. Developmental lung disease 5. Pulmonary hypertension with unclear and /or multifactorial mechanisms
EVALUATION • Clinical features and examination • ECG, CXR, ABG, PFT • Non- invasive imaging – Most important screening tool - TTE
TTE in estimation of pulmonary artery pressure • Non-invasive widely available tool for diagnosis of PH • Comparing with gold standard – RHC- echo has sensitivity of ≈ 90% and specificity of 70% in diagnosis of PH • Can assess contribution of LV systolic and diastolic dysfunction, valve function and congenital lesions • Quantitate PA pressures • prognosis
RV ANATOMY AND PATHOPHYSIOLOGY • Anteriorly situated cardiac structure- retrosternal • More triangular in shape and curves over the LV • In cross-section – crescentic • curvature of the ventricular septum places the RV outflow tract antero-cephalad to that of the LV - "cross-over" relationship between right and LV outflows
• Irregular shape and heavy trabeculation • Retrosternal position of the RV Echo assessment difficult
• Pulmonary vascular bed is a low-resistance system in healthy individuals • RV is more compliant than the LV and adapts better to volume loading than pressure loading • ventricular interdependence (mediated by the interventricular septum)
• ventricular remodelling- a result of chronic progressive pressure loading
• RV dilatation leads to tricuspid annular dilatation – significant tricuspid regurgitation • Additional volume overloading – impair diastolic function – increase RVEDP – displace IVS
2 D ECHOCARDIOGRAPHIC SIGNS IN PH
Right heart imaging Parasternal long axis view: - triangular echo- free structure - mass of RV is less than one sixth and its diameter less than one third of the LV - In PH, RV free wall is hypertrophied and cavity may be dilated
• Parasternal long axis view of the RV inflow: - In PH, RV apex is hypertrophied and the cavity is dilated - Basal diameter of RV – 3. 7 -5. 4 cm - tricuspid annulus diameter - Assess tricuspid valve apparatus
• Parasternal long axis view of the RV outflow: - normal RV outflow tract dimension: 1. 7 -2. 3 cm in diastole - Pulmonary artery will be dilated Normal measurements: MPA : 1. 5 -2. 1 1. 7 RPA : 0. 7 -
• Parasternal short axis view: • D-shaped LV cavity • In volume overload situations: Septal bulge occurs in diastole • In pressure overload conditions: occurs in systole ± diastole
PSAX at RV basal level • RVOT dimension in diastole • TR jet parameters can be assessed if TR jet parallel to the US beam PSAX at PA bifurcation • Assess pulmonary valve, PA and branches • Measuring pulmonary annulus diameter, PA size, Doppler measurement of infundibulum, PV and PA • Distal RVOT measurement
• Crescent shape of RV • Septal flattening during systole & diastole
• Apical 4 chamber view: - RV hypertrophy, dilatation - RV free wall is the first to become hypertrophied : systolic dysfunction and lower tissue myocardial velocities - apex is frequently hypertrophied and
Indirect 2 D echo signs in PH 1. RV wall thickness • > 5 mm • Measure of RVH, usually secondary to increased RVSP • Measured at end-diastole • M-mode/ 2 D echo • Subcostal window- at the level of tip of anterior tricuspid leaflet • Left parasternal window • Exclude trabeculation, papillary muscle and epicardial fat
2. RV dilation : level Diameter Base >42 mm Mid level >35 mm Longitudinal >86 mm RV focused apical 4 chamber view
3. RVOT dilation • Best viewed from the left parasternal and subcostal view. • RVOT distal diameter, just below pulmonary valve- most reproducible • PSAX- distal RVOT diameter >27 mm is RVOT dilation • Pitfalls: -oblique imaging – under/overestimate the size
4. RA dilation - Estimated from A 4 C - upper limit for: Major axis dimension 53 mm Minor axis dimension- 44 mm - RA area (end- ventricular systole) 18 cm 2
5. LV eccentricity index: the degree of distortion of the LV and IVS arising due to increased pressure in the RV during diastole and systole ; can be quantified using a short-axis view at the level of left ventricular papillary muscles. PRESSURE OVERLOAD VOLUME OVERLOAD
LV eccentricity index üRatio between the LV anteroposterior dimension(D 2) and the septolateral dimension(D 1) üRatio >1. 0 suggest RV overload
II. Pressure measurements in PH
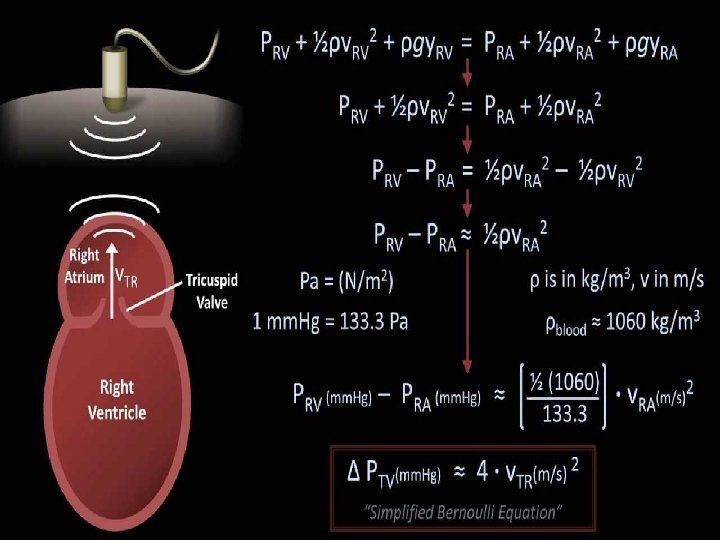
1. PASP by TR peak velocity • Continuous wave doppler of TR trace • Principle: Bernoulli’s principle: conservation of energy
Views: parasternal long axis (RV inflow) parasternal short axis apical 4 chamber view Co-axial TR jet to be identified
• RVSP = 4 V 2 + RAP • Assessing RA pressure: Parameters 0 -5 mm Hg (3 mm. Hg) 5 -10 mm Hg (8 mm Hg) >15 mm Hg IVC diameter ≤ 2. 1 cm ≤ 2. 1 >2. 1 cm Respiratory collapse >50% <50% • Secondary measures of RA pressure: 1. Restrictive filling – tricuspid E/A >2. 1, with deceleration time <120 ms 2. Tricuspid E/E’>6 3. Diastolic flow predominance in hepatic vein (systolic filling fraction <55%)
• The subcostal view • IVC viewed in its long axis. • The measurement is made at endexpiration • - just proximal to the junction of the hepatic veins that lie approximately 0. 5 to 3. 0 cm proximal to the ostium of the right In patients ventillated using positive pressure, IVC collapse cannot be used to reliably atrium estimate RA pressure. – CVP must be used In the same group if IVC<12 mm, is suggestive of RAP <10 mm Hg
• PASP = RVSP , in the absence of pulmonary valve or RVOT gradient • m. PAP = 0. 61* PASP + 2 mm Hg* * Chemla D et al. New formula for predicting mean pulmonary artery pressure using systolic pulmonary artery pressure*. Chest. 2004
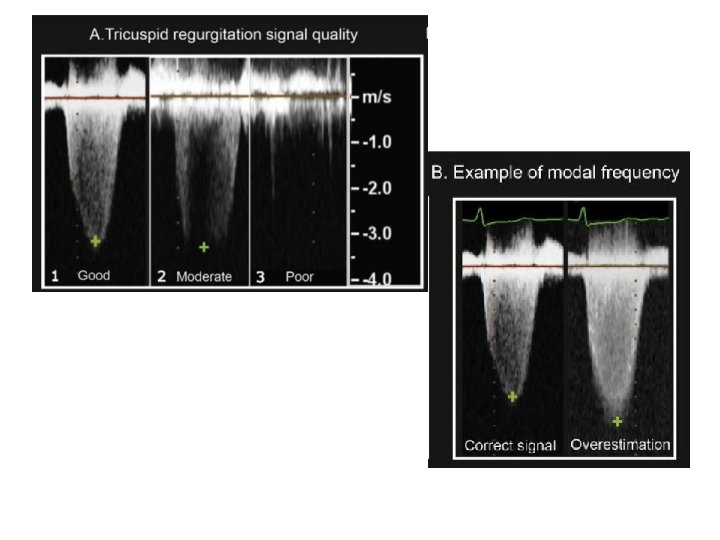
• Pitfalls: 1. Lesser degree of TR in compensated right ventricle – underestimation of PASP 2. Severe TR may equalise the RA, RV pressure, cutting short the TR envelope- underestimation 3. In the presence of PS or RVOT obstruction 4. Poor TR signal
• If TR signal is poor, agitated saline may be used • In case of AF, average of peak velocity of 8 cycles may be used • Resting physiological range of PASP – a. Age b. BMI • PASP is a flow dependent variable as the TR velocity increases.
2. Evaluation of the PR signal • PR velocity reflects the pressure gradient between pulmonary artery and right ventricle during diastole.
Estimation of pulmonary artery diastolic pressure from peak end-diastolic velocity • PADP = 4 (VPR-ED )2 + RVEDP • In the absence of tricuspid stenosis, RVEDP = RAP • PADP = 4 (VPR-ED )2 + RAP
Estimation of m. PAP from peak PR velocity • Peak velocity of PR Doppler signal in early diastole correlates with mean PAP • m. PAP = 4 (V early PR ) 2 + RAP • Method has been validated against gold standard catherisation measurements
• m. PAP can also be measured from systolic and diastolic pulmonary artery pressure • m. PAP = 2/3 (PADP) + 1/3 (PASP) Measured from end diastolic PR velocity From TR peak velocity
• Pitfalls : - Severe PR – rapid decelaration slope – PR end velocity may underestimate the PADP - PR may be unreliable in the presence of constrictive or restrictive physiology. - In constrictive physiology – dissociation of intracardiac and intrathoracic pressure – early equilisation of RV and PA pressure- shorter and steeper PR signal
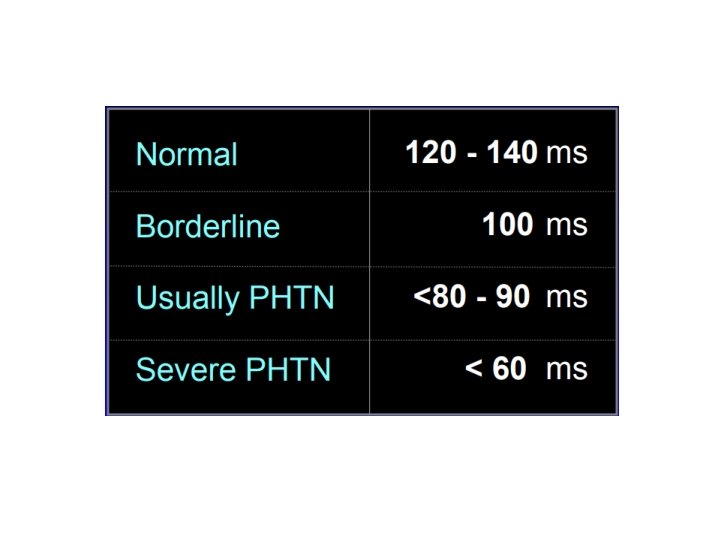
3. Mean PAP from RVOT acceleration time • RVOT acceleration time is the time interval between the onset of flow to the peak systolic flow. • As the PA pressure increase, resistance to blood flow from RV into PA increase, resulting in shortening of the RVOT acceleration time.
RVOT acceleration time measurement; rapid rise and mid-systolic notching s/o elevated PAP Normal PW of RVOT – dome shaped Pulmonary hypertension- rapid rise to peak shorter acceleration time; mid-systolic notching
• Method: - PW doppler obtained at end expiration - Just proximal to pulmonary valve - Parasternal short axis view - Maximum sweep speed to increase accuracy
Three regression equation has been described to calculate m. PAP Method described by Mahan et al Sample volume placed in RVOT AT was found to have a linear relation with m. PAP = 79 -(0. 45* RVOT AT )
• Method by Kitabatake et al (1983) Sample volume in RVOT AT was found to have curvilinear relation with MPAP= 90 - (0. 62* RVOT AT )
• Method by Debastani et al • Sample volume placed in the proximal MPA • This regression equation is used when the RVOT AT was ≤ 120 ms Log 10 MPAP = 0. 0068(RVOT AT )+2. 1
Interpretation: RVOT AT : Value >130 ms - normal value < 100 ms – PH MPAP = 90 -(0. 62 * RVOT AT ), when RVOT AT < 120 ms MPAP = 79 - (0. 45* RVOT AT ), when RVOT AT >120 ms
• Pitfall: 1. heart rate <60, >100 may affect the accuracy 2. Measurement of acceleration time might be wrong, with the slope of PW doppler being measured than the acceleration time * Start from the peak of the envelope and measure time to onset
4. m. PAP from TR-VTi • CW doppler of TR jet is traced • Mean pressure gradient is measured from TR VTI • m. PAP = Mean∆P + RAP
Right ventricular isovolumic relaxation time (r. IVRT) • TDI deployed at lateral tricuspid annulus • PW doppler with a 6 mm sample window obtained • r. IVRT – measured from the offset of S’ wave to onset of E’ wave
• r. IVRT > 75 ms – reliably predicts pulmonary • hypertension r. IVRT <40 ms – high negative predictive value for PH • Pitfalls: co-axial TDI may not be possible; incident angle should be less than 15˚ –unreliable in HCM, RBBB and RV dysfunction –When heart rate is too high, corrected r. IVRT is used
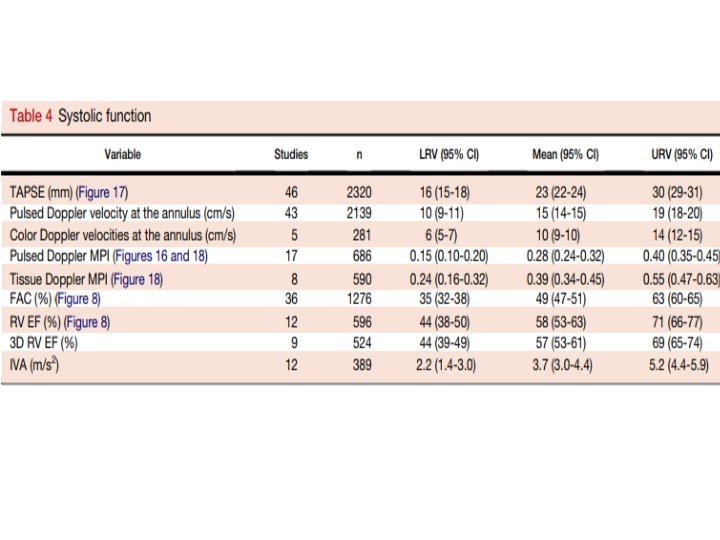
IV. RV FUNCTION assessment
• RV fractional area change: ( end-diastolic area - end-systolic area/ end-diastolic area) *100 - Measure of RV systolic function - Correlate with RV EF by MRI - Limited by endocardial definition of RV - Lower reference value- 35%
TEI INDEX and TR measured PASP • Tei index / RIMP/MPI– doppler derived marker of both systolic and diastolic ventricular function • Method: A 4 C , TDI is deployed on RV free wall and pulse wave doppler is obtained approx 1 cm from tricuspid annulus • Tei index = IVRT + IVCT/ET = TCO-ET/ET
Tei index • >0. 4 by PWD • >0. 55 by DTI
• Advantage: 1. Prognostic indicator 2. Approach feasible, in the presence or absence of TR 3. MPI is reproducible • Disadvantage : 1. Unreliable with differing RR interval as AF 2. Unreliable with elevated RA pressure (load dependent)
TAPSE • TRICUSPID ANNULAR PLANE SYSTOLC EXCURSION/ TAM – tricuspid annular motion • reflection of the movement of base to apex shortening of the RV in systole • derived from the four-chamber view –M-mode
• TAPSE -prognostic indicator in PAH for the assessment of disease severity and response to therapy • <16 – higher mortality • highly load dependent-become pseudonormalised in the presence of significant volume loading -e. g. left-to-right shunting or severe functional tricuspid regurgitation
S’ Wave: TDI-Derived Tricuspid Lateral Annular Systolic Velocity • average of three TDI signals from different cardiac cycles • <10 cm/s – impaired RV function • load dependent and may be pseudonormal under conditions of increased volume loading • S' wave velocity requires correction when heart rate is >100 bpm or falls to <70 bpm.
Myocardial accelaration during isovolumic contraction IVA- isovolumic accelaration - Defined as the peak isovolumic myocardial velocity/ time to peak velocity - Measured by Doppler tissue imaging at the lateral tricuspid annulus - Less load dependent, correlate with severity - Disadvantage: angle dependent, less normative data, affected by age and heart rate.
• Not recommended as a screening parameter for RV systolic function • lower reference limit by pulsed-wave Doppler tissue imaging - 2. 2 m/s 2 , with a broad 95% confidence interval of 1. 4 to 3. 0
Strain imaging • Strain : Percentage change in myocardial deformation • Strain rate: rate of deformation of myocardium over time • RV strain and strain rate is significantly reduced as a consequence of increased afterload with or without RV contractile dysfunction • LPSS- longitudinal peak systolic strain – >19% indicates RV dysfunction
M-mode echocardiography Three abnormalities of the pulmonary valve : i. Absent or diminished ‘a’ wave ii. Midsystolic notching or closure of the pulmonary valve iii. Increased right ventricular pre-ejection period to ejection time (RVPEP/RVET) ratio
‘a’ – depth of the posterior deflection of pulmonary valve immediately following atrial contraction; correlates with the peak pressure gradient across pulmonary valve; normally measures 2 -7 mm Limitation: 1. atrial fibrillation 2. no correlation between a wave amplitude and actual PAP 3. normalisation of ‘a’ wave in those with coexistant RV failure
Mid-systolic notching – produce characteristic ‘W’ shaped pattern
Increased RVPEP/RVET - RVPEP: Q wave of ECG to the onset of valve opening - RVET: interval in which the valve remain open (b – e points) - Both the intervals are affected by heart - RVET- increases with advancing age - The ratio – not significantly affected by age/heart rate - In PH, RVET decreases, RVPEP lengthens, with increase in ratio
PAEDP RVPEP/RVET Normal (PAEDP- 10 -15 mm Hg) ≤ 0. 30 PH (PAEDP>20 mm Hg) >0. 35 ‘gray area’ 0. 3 -0. 35 Limitation: 1. Difficulty In recording opening and closing of PV 2. Small error may lead to large error in calculation 3. Conduction defect like RBBB, increases RVPEP
ECHO DIFFERENTIATION OF PAH vs PVH
PULMONARY HYPERTENSION FORMULAE 1. PASP = 4 (TV max)2 + RAP 2. m. PAP = 4 (PR early vel)2 + RAP = 79 -(0. 45* RVOT AT ) (AT>120 ms) = 90 - (0. 62* RVOT AT ) (AT<120 ms) = 2/3 (PADP) + 1/3 (PASP) 3. PVR = (PASP/RVOT VTI) + 3 if notch present, 0 if no notch
MCQ Not a measure of RV dysfunction: 1. S’ velocity >10 2. Tei index >0. 4 by DPI 3. TAPSE <16 4. RV FAC >0. 4
• Mpap can be calculated from all except: 1. Tr peak velocity 2. Pr end diastolic velocity 3. TR VTI 4. RVOT -AT
Identify the segments
Assuming the RAP is 8 mm Hg, calculate the PASP, m. PAP