ECHO BASICS3 Doppler echo colour doppler fazil bishara

ECHO BASICS-3 Doppler echo & colour doppler -fazil bishara

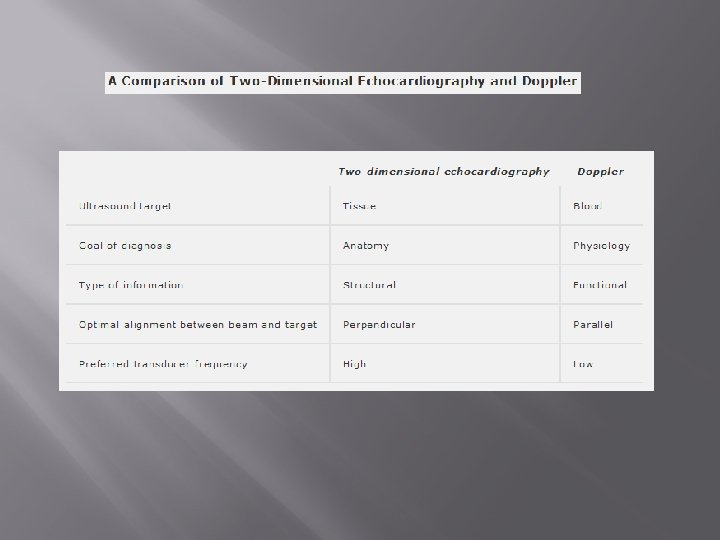
Properties of blood � � Hemodynamics- physical principles of blood flow & circulation Density – mass per unit volume( g/ml) Viscosity – ability of molecules to move past one another by overcoming frictional forces ( 0. 035 poise at 37◦c) Flow occurs from high pressure to low pressure end

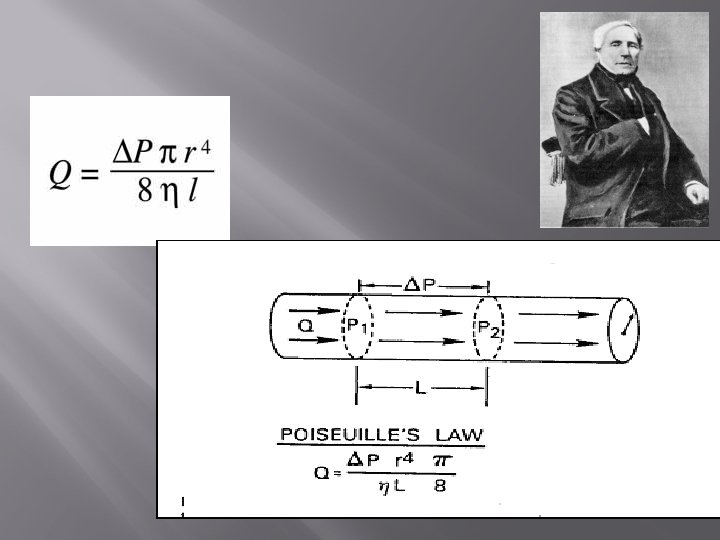
Factors determining flow � Flow rate is determined by �Pressure gradient �Resistance Viscosity of blood Radius of lumen Length of vessel

� R= 8 Lv/ ∏r 4 V viscosity of blood R radius of lumen L length of the vessel � Q= ∆P/R � � �

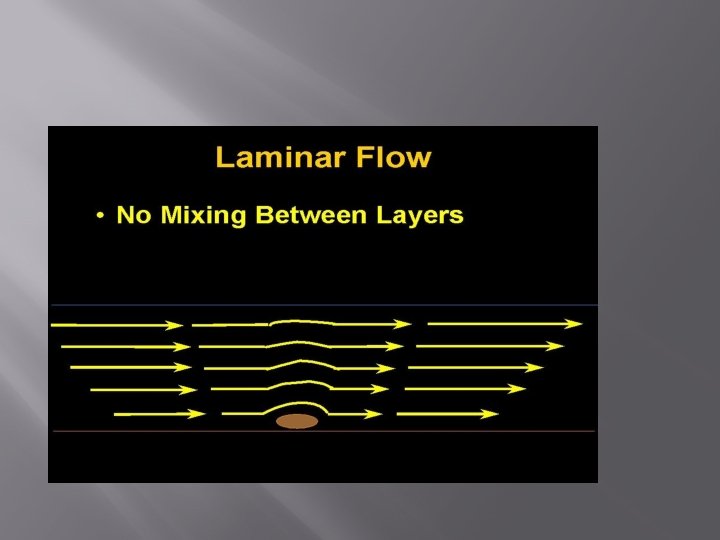
Types of flow Laminar flow Shape of parabola Concentric layers , each parallel to vessel wall Velocity of each layer differs Maximal velocity is at centre of vessel Decreasing profile towards peripheries

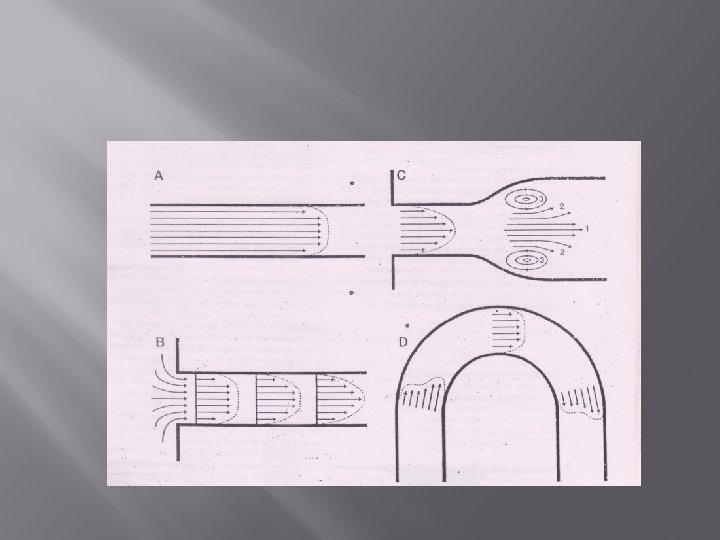
Laminar flow � � Acceleration of flow- flat flow profile / plug flow Converging flow- flat profile parabolic profile Diverging flow - multiple flow patterns(uniform high velocity flow, stagnant flow, eddy flow) Vessel curvature – high velocity in the inner part of curve in the ascending limb, outer part of the curve in descending limb

Types of flow

Turbulent flow � � Obstruction produce increased velocities, flow vortices Whirlpools shed off in different directions producing variable velocities- chaos Predicted by Reynolds number depends on Re=( ρ x c x D)/v ρ-Density of blood D-Vessel diameter c-Velocity of flow V-viscosity

The Reynolds number is dimensionless If Re is less than 1200 the flow will be -laminar 1200 -2000 flow is described as -transitional Greater than 2000 -turbulent

Doppler Principle

First described by Johann Christian Doppler, an Austrian mathematician and scientist who lived in the first half of the 19 th century. Doppler’s initial descriptions referred to changes in the wavelength of light as applied to astronomical events. In 1842, he presented a paper entitled "On the Coloured Light of Double Stars and Some Other Heavenly Bodies" where he postulated that certain properties of light emitted from stars depend upon the relative motion of the observer and the wave source.

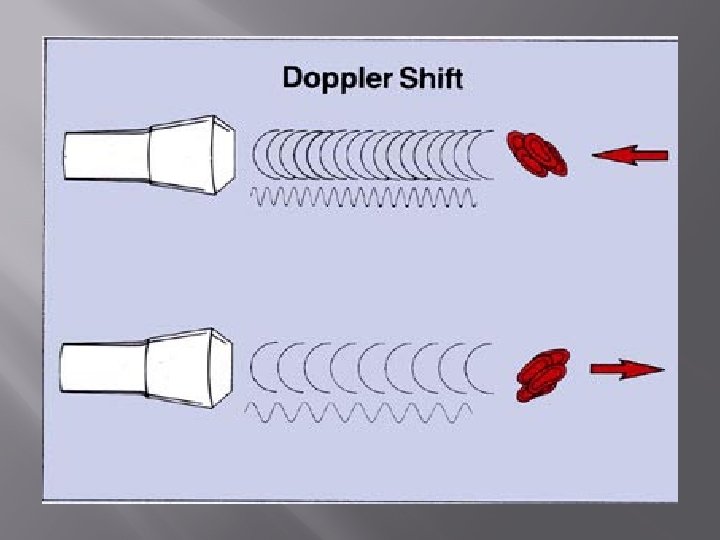
� � BASIC PRINCIPLES A moving target will backscatter an ultrasound beam to the transducer the frequency observed when the target is moving toward the transducer is higher the frequency observed when the target is moving away from the transducer is lower than the original transmitter frequency

Doppler effect

The phenomenon called doppler effect! When a whistle blowing train passes a stationary listener, the sound pitch is higher as the train approaches and lower as the train passes…

� Doppler shift represents difference between received and transmitted frequencies , which occur due to motion of RBC’s relative to the ultrasound beam � Fd = (2 f V cos Ø)/C
![� � Doppler shift (F[d]) = F[r] - F[t] F[d] = (2 f[t] V](http://slidetodoc.com/presentation_image_h2/5c03f5f65a00cbe2a7c3c6ff0ac6d20d/image-20.jpg "� � Doppler shift (F[d]) = F[r] - F[t] F[d] = (2 f[t] V")
� � Doppler shift (F[d]) = F[r] - F[t] F[d] = (2 f[t] V cos Ø)/C Blood flow velocity (V) speed of sound in blood (C) ø, the intercept angle between the ultrasound beam A factor of 2 is used to correct for the "round-trip" transit time to and from the transducer.

Why the factor 2? � Double doppler shift 1 st shift-transducer stationary source, RBC the moving receiver 2 nd shift is when, RBCs are moving source and transducer is the stationary receiver.
![� � � � This equation can be solved for V, by substituting (F[r]](http://slidetodoc.com/presentation_image_h2/5c03f5f65a00cbe2a7c3c6ff0ac6d20d/image-22.jpg "� � � � This equation can be solved for V, by substituting (F[r]")
� � � � This equation can be solved for V, by substituting (F[r] - F[t]) for F[d]: V = [(F[r] -F[t]) x C] ÷ (2 x F[t] x cos ø) the angle of the ultrasound beam and the direction of blood flow are critically important in the calculation ø of 0º and 180º (parallel with blood flow), cosine ø = 1 ø of 90º (perpendicular to blood flow), cosine ø = 0 , the Doppler shift is 0 ø up to 20º, cos ø results in a <10 percent change in the Doppler shift ø of 60º, cosine ø = 0. 50

Angle of doppler beam in relationship to direction of blood flow

The Effect of Angle

Angle 0 10 20 30 60 90 Cosine Percentage error 1 0 0. 98 2 0. 94 7 0. 87 13 0. 5 50 0 100

Angle correction � It is possible to correct for angle, in clinical practice. � However, Not recommended as in most cases it is possible to align ultrasound beam parallel by using multiple echo views. � It is assumed that angle between ultrasound beam and direction of blood flow is parallel

Effect of frequency � Lower the frequency, higher the velocity detected � A 2 MHz transducer detects higher velocity compared to a 5 MHz transducer

The spectral doppler display � � Is a graphic display of blood flow velocities plotted over time. Spectral analysis — the difference between the transmitted and backscattered signal is determined by comparing the two waveforms with the frequency content analyzed by fast Fourier transform (FFT). The display generated by this frequency analysis is termed spectral analysis

2 methods used to calculate the frequency content of a doppler signal 1. 2. Zero-crossing method Fourier analysis

� Sine wave crosses the zero line twice, frequency calculated as no of zero crossings divided by 2 unfortunately the returning signal is not a pure sine wave but is a complex wave, hence the technique not used

� � Fourier analysis done using a computer algorithm called FFT that uses a mathematical tool to extract frequency information from signals Many sequential FFTs are performed to generate and display a doppler.

Information displayed include 1. flow velocity 2. flow direction 3. signal timing 4. signal intensity

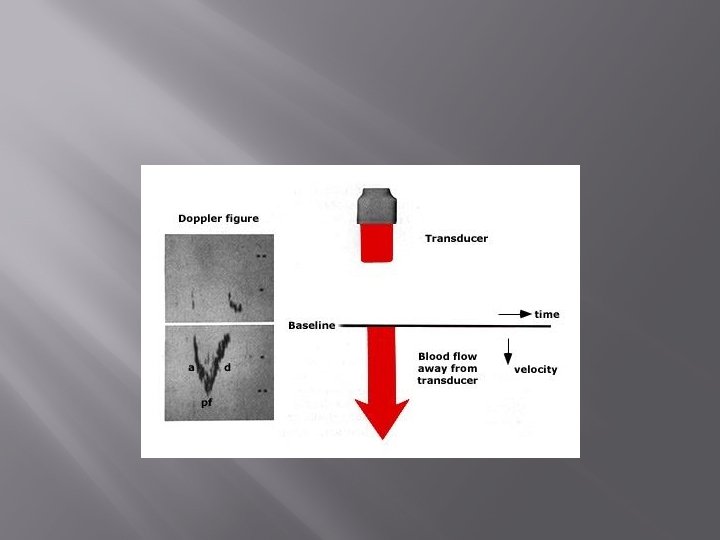
Flow velocity � Displayed on y axis � Velocity of RBCs within sampled volume is calculated � Absence of velocity-zero baseline

Direction of flow � Flow direction also displayed on Y axis � Positive doppler shift-flow towards transducer Traditionally displayed above baseline � Negative doppler shift-flow away from transducer Displayed below zero baseline

Timing � Time is displayed along x axis � Displayed along with ECG. � Change in blood velocity , flow direction can be accurately timed in relation to cardiac cycle.

Intensity or amplitude � � � Blood cells do not move at equal velocities Produce different frequency shifts Amplitude or intensity of doppler signal reflects the number of blood cells moving within a range of velocities at a particular point of time Bright signal-strong doppler shift frequency at a particular point of time. Darker regions-weak doppler shift

Spectral velocity recordings

Doppler Audio signals � Doppler shift frequencies are in audible range � Guide for localising blood flow and for proper aligning ultrasound beam parallel to flow � Laminar flow-smooth tone � Turbulent flow-harsh sound.

Pulsed and Continuous Wave Doppler

Continuous Wave Doppler � � � older and electronically more simple continuous generation of ultrasound waves continuous ultrasound reception two crystal transducer Blood flow along entire beam is observed
lack of selectivity")
� ADVANTAGE ability to measure high blood velocities accurately � DISADVANTAGE 1)lack of selectivity or depth discrimination 2)no provision for range gating to allow selective placing of a given Doppler sample volume in space

Pulsed Wave Doppler � � � Ultrasound impulses are sent out in short bursts or pulses transducer that alternates transmission and reception of ultrasound ability to provide Doppler shift data selectively from a small segment along the ultrasound beamsample volume can be selected.

The transducer does not emit ultrasound continuously, but rather, emits pulses rapidly (approximately 1, 000 pulses per second) & quickly (approximately 1 microsecond for every pulse). Therefore, the transducer is operating as a transmitter for an extremely short time (0. 1% of the time).
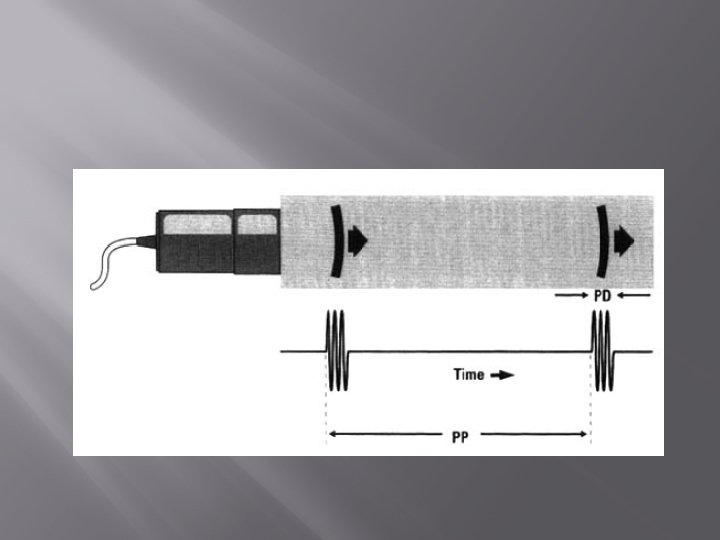

� � � The transducer functions as receiver for a limited time period Time corresponds to the interval required for sound to return from specified area. Another burst of sound waves are not transmitted until previous impulses are received. Pulse repetition frequency (PRF)–frequency at which transducer transmits pulses. PRF determines sampling rate.

Sample volume � � � three-dimensional, teardrop shaped portion of the ultrasound beam width is determined by the width of the ultrasound beam at the selected depth. length determines the length of time that the transducer is activated to receive information from sv location

� � Sampling rate/frequency- the number of digital points sampled per sec. Nyquist frequency- the highest frequency in a signal Nyquist rate- the minimum sampling rate at which the signal could theoretically be recovered, which is twice the nyquist frequency. Nyquist limit- the max. detectable frequency shift, which is one half the PRF.

Aliasing � The aliasing phenomenon occurs when the velocity exceeds the rate at which the pulsed wave system can record it properly Fig. 1. 24 Inability to accurately measure high blood flow velocities- aliasing

Aliasing is represented on the spectral trace as a cutoff of a given velocity with placement of the cut section in the opposite channel or reverse flow direction

Nyquist Limit � � The Nyquist limit defines when aliasing will occur using PW Doppler. The Nyquist limit specifies that measurements of frequency shifts (and thus the velocity) will be appropriately displayed only if the pulse repetition frequency (PRF) is at least twice the maximum velocity (or Doppler shift frequency) encountered in the sample volume.
 Also known as")
� Shannon's sampling theorem (Claude E. Shannon, born 1916, American mathematician) Also known as the Nyquist criterion, a general "rule" for measurement of frequencies, stating that the measurement (sampling) frequency must be at least twice the maximum frequency to be measured. Whenever Shannon's sampling theorem is not fulfilled, aliasing occurs

� Nyquist limit specifies the maximum velocity that can be recorded without aliasing.
altering variables in Doppler equation 2)high PRF mode")
Avoiding aliasing Increase the Nyquist limit 1)altering variables in Doppler equation 2)high PRF mode 3 )Change from PW to CW

� V = C × PRF 4 f COS Ø Max velocity can be increased by 1)Increasing PRF 2)Decreasing transmitted frequency 3)Increasing speed of sound in tissue 4)Decreasing cosØ

� Increasing the PRF D = c t /2 ; D =distance to the structure/region of interest c = propagation speed through tissue t = time taken for US signal to return to the transducer 2 because pulse must travel to the structure & then back again

� Decreasing the transmitted frequency Selection of a lower frequency transducer , increases the max. velocity detected at any depth.

Introducing an offset Electronic cut and paste Moves the aliased doppler signal upward or downward(unwrapping) Repositioning baseline effectively increases the maximum velocity at the expense of other direction.
 Repositioning of zero baseline effectively increases")
� Baseline shift ("zero shift" or "zero off-set") Repositioning of zero baseline effectively increases the maximum velocity in one direction, at the expense of other direction

Utilizing high PRF mode � A higher than normal PRF used here using multiple sample gates at various locations. � Transmission of any given pulse occurs before the reception of all the echoes from the previous pulse. � Drawback- exact location of the doppler shift is not known!

Changing from PW to CW � Aliasing not a problem here as sampling limitations does not occur with CW. � Limitation- NO range resolution!

Comparison between CW & PW cw pw Depth resolution no yes Sample volume large small Detection of high velocities yes no Aliasing no yes Spectral content Wide narrow Use in duplex instruments yes sensitivity more less Transducer power Lower Higher Control Of Sample Volume Placement Poor Good

� When a specific area of abnormal flow is to be located - PW Doppler is indicated. � When accurate measurement of elevated flow velocity is required- CW Doppler should be used

Optimization of doppler signals 1. 2. 3. 4. 5. 6. 7. Angle dependency Sample volume position Velocity scale & baseline Wall filters Gain Sample volume length Electrical versus mechanical events

Basic principles of colour doppler imaging � � Doppler images produced by using multiple sample gaits along multiple scan lines The device that detects doppler shift frequency is the AUTOCORRELATOR Where doppler signals are detected, pixels representing that areas are designated a colour, which is determined by the mean doppler shift detected at that site. Colour coding relative to the transducer is direction sensitive

The colour doppler display � � Blood flow direction – BART system Blood flow velocity- low velocity flow indicated by colours closest to colour baseline - Appear in deeper colour hues - High velocity flow – towards the end of colour bar, appears brighter - No angle correction -Peak velocity estimations are not possibe -Only mean doppler velocities are depicted

� � � Frequency aliasing -appears as colour reversal. normal blood flow velocities rarely cause aliasing in PW doppler, but frequently in CFI. Laminar vs turbulant flow – smooth homogenous pattern; RBCs move at about the same velocity & in the same general direction Turbulant flow- disorganised mosaic pattern containing all colours on the colour bar

Optimisation of colour flow doppler images � � Frame rate- no of frames produced per second Depends upon -depth colour sector width line density Velocity scale- adjusts the maximum mean velocity that can be displayed Wall filters Gain

references � � � Figenbaum, H : echocardiography Bonita anderson- ECHO Hand book of echo doppler- kerut Moss and adams Otto clinical echocardiography
- Slides: 70