ECG Rhythm Interpretation Module I ECG Basics For

ECG Rhythm Interpretation Module I ECG Basics For more presentations www. medicalppt. blogspot. com

Course Objectives • To recognize the normal rhythm of the heart - “Normal Sinus Rhythm. ” • To recognize the most common rhythm disturbances. • To recognize an acute myocardial infarction on a 12 -lead ECG. For more presentations www. medicalppt. blogspot. com

Learning Modules • • • ECG Basics How to Analyze a Rhythm Normal Sinus Rhythm Heart Arrhythmias Diagnosing a Myocardial Infarction Advanced 12 -Lead Interpretation For more presentations www. medicalppt. blogspot. com

Normal Impulse Conduction Sinoatrial node AV node Bundle of His Bundle Branches Purkinje fibers For more presentations www. medicalppt. blogspot. com

Impulse Conduction & the ECG Sinoatrial node AV node Bundle of His Bundle Branches Purkinje fibers For more presentations www. medicalppt. blogspot. com

The “PQRST” • P wave - Atrial depolarization • QRS - Ventricular depolarization • T wave - Ventricular repolarization For more presentations www. medicalppt. blogspot. com
")
The PR Interval Atrial depolarization + delay in AV junction (AV node/Bundle of His) (delay allows time for the atria to contract before the ventricles contract) For more presentations www. medicalppt. blogspot. com

Pacemakers of the Heart • SA Node - Dominant pacemaker with an intrinsic rate of 60 - 100 beats/minute. • AV Node - Back-up pacemaker with an intrinsic rate of 40 - 60 beats/minute. • Ventricular cells - Back-up pacemaker with an intrinsic rate of 20 - 45 bpm. For more presentations www. medicalppt. blogspot. com

The ECG Paper • Horizontally – One small box - 0. 04 s – One large box - 0. 20 s • Vertically – One large box - 0. 5 m. V For more presentations www. medicalppt. blogspot. com
 3 sec • Every 3 seconds (15 large boxes) is")
The ECG Paper (cont) 3 sec • Every 3 seconds (15 large boxes) is marked by a vertical line. • This helps when calculating the heart rate. NOTE: the following strips are not marked but all are 6 seconds long. For more presentations www. medicalppt. blogspot. com

ECG Rhythm Interpretation Module II How to Analyze a Rhythm For more presentations www. medicalppt. blogspot. com

Rhythm Analysis • • • Step 1: Step 2: Step 3: Step 4: Step 5: Calculate rate. Determine regularity. Assess the P waves. Determine PR interval. Determine QRS duration. For more presentations www. medicalppt. blogspot. com

Step 1: Calculate Rate 3 sec • Option 1 – Count the # of R waves in a 6 second rhythm strip, then multiply by 10. – Reminder: all rhythm strips in the Modules are 6 seconds in length. Interpretation? 9 x 10 = 90 bpm For more presentations www. medicalppt. blogspot. com

Step 1: Calculate R wave • Option 2 – Find a R wave that lands on a bold line. – Count the # of large boxes to the next R wave. If the second R wave is 1 large box away the rate is 300, 2 boxes - 150, 3 boxes - 100, 4 boxes - 75, etc. (cont) For more presentations www. medicalppt. blogspot. com

Step 1: Calculate Rate 3 1 1 0 5 0 7 6 5 0 0 0 5 0 0 • Option 2 (cont) – Memorize the sequence: 300 - 150 - 100 - 75 - 60 - 50 Interpretation? Approx. 1 box less than 100 = 95 bpm For more presentations www. medicalppt. blogspot. com

Step 2: Determine regularity R R • Look at the R-R distances (using a caliper or markings on a pen or paper). • Regular (are they equidistant apart)? Occasionally irregular? Regularly irregular? Irregularly irregular? Interpretation? Regular For more presentations www. medicalppt. blogspot. com

Step 3: Assess the P waves • Are there P waves? • Do the P waves all look alike? • Do the P waves occur at a regular rate? • Is there one P wave before each QRS? Interpretation? Normal P waves with 1 P wave for every QRS For more presentations www. medicalppt. blogspot. com

Step 4: Determine PR interval • Normal: 0. 12 - 0. 20 seconds. (3 - 5 boxes) Interpretation? 0. 12 seconds For more presentations www. medicalppt. blogspot. com

Step 5: QRS duration • Normal: 0. 04 - 0. 12 seconds. (1 - 3 boxes) Interpretation? 0. 08 seconds For more presentations www. medicalppt. blogspot. com

Rhythm Summary • Rate • Regularity • P waves • PR interval • QRS duration Interpretation? 90 -95 bpm regular normal 0. 12 s 0. 08 s Normal Sinus Rhythm For more presentations www. medicalppt. blogspot. com

End of Module II How to Analyze a Rhythm For more presentations www. medicalppt. blogspot. com

ECG Rhythm Interpretation Module IV a Sinus Rhythms and Premature Beats For more presentations www. medicalppt. blogspot. com

Arrhythmias • • • Sinus Rhythms Premature Beats Supraventricular Arrhythmias Ventricular Arrhythmias AV Junctional Blocks For more presentations www. medicalppt. blogspot. com

Sinus Rhythms • Sinus Bradycardia • Sinus Tachycardia For more presentations www. medicalppt. blogspot. com

Rhythm #1 • • • Rate? Regularity? P waves? PR interval? QRS duration? 30 bpm regular normal 0. 12 s 0. 10 s Interpretation? Sinus Bradycardia For more presentations www. medicalppt. blogspot. com

Sinus Bradycardia • Deviation from NSR - Rate < 60 bpm For more presentations www. medicalppt. blogspot. com

Sinus Bradycardia • Etiology: SA node is depolarizing slower than normal, impulse is conducted normally (i. e. normal PR and QRS interval). For more presentations www. medicalppt. blogspot. com

Rhythm #2 • • • Rate? Regularity? P waves? PR interval? QRS duration? 130 bpm regular normal 0. 16 s 0. 08 s Interpretation? Sinus Tachycardia For more presentations www. medicalppt. blogspot. com

Sinus Tachycardia • Deviation from NSR - Rate > 100 bpm For more presentations www. medicalppt. blogspot. com

Sinus Tachycardia • Etiology: SA node is depolarizing faster than normal, impulse is conducted normally. • Remember: sinus tachycardia is a response to physical or psychological stress, not a primary arrhythmia. For more presentations www. medicalppt. blogspot. com
 • Premature Ventricular Contractions (PVCs) For more")
Premature Beats • Premature Atrial Contractions (PACs) • Premature Ventricular Contractions (PVCs) For more presentations www. medicalppt. blogspot. com

Rhythm #3 • • • Rate? Regularity? P waves? PR interval? QRS duration? 70 bpm occasionally irreg. 2/7 different contour 0. 14 s (except 2/7) 0. 08 s Interpretation? NSR with Premature Atrial For more presentations www. medicalppt. blogspot. com Contractions

Premature Atrial Contractions • Deviation from NSR – These ectopic beats originate in the atria (but not in the SA node), therefore the contour of the P wave, the PR interval, and the timing are different than a normally generated pulse from the SA node. For more presentations www. medicalppt. blogspot. com

Premature Atrial Contractions • Etiology: Excitation of an atrial cell forms an impulse that is then conducted normally through the AV node and ventricles. For more presentations www. medicalppt. blogspot. com

Teaching Moment • When an impulse originates anywhere in the atria (SA node, atrial cells, AV node, Bundle of His) and then is conducted normally through the ventricles, the QRS will be narrow (0. 04 - 0. 12 s). For more presentations www. medicalppt. blogspot. com

Rhythm #4 • • • Rate? Regularity? P waves? PR interval? QRS duration? 60 bpm occasionally irreg. none for 7 th QRS 0. 14 s 0. 08 s (7 th wide) Interpretation? Sinus Rhythm with 1 PVC For more presentations www. medicalppt. blogspot. com

PVCs • Deviation from NSR – Ectopic beats originate in the ventricles resulting in wide and bizarre QRS complexes. – When there are more than 1 premature beats and look alike, they are called “uniform”. When they look different, they are called “multiform”. For more presentations www. medicalppt. blogspot. com

PVCs • Etiology: One or more ventricular cells are depolarizing and the impulses are abnormally conducting through the ventricles. For more presentations www. medicalppt. blogspot. com

Teaching Moment • When an impulse originates in a ventricle, conduction through the ventricles will be inefficient and the QRS will be wide and bizarre. For more presentations www. medicalppt. blogspot. com

Ventricular Conduction Normal Abnormal Signal moves rapidly through the ventricles Signal moves slowly through the ventricles For more presentations www. medicalppt. blogspot. com

End of Module IV a Sinus Rhythms and Premature Beats For more presentations www. medicalppt. blogspot. com

ECG Rhythm Interpretation Module IV b Supraventricular and Ventricular Arrhythmias For more presentations www. medicalppt. blogspot. com

Arrhythmias • • • Sinus Rhythms Premature Beats Supraventricular Arrhythmias Ventricular Arrhythmias AV Junctional Blocks For more presentations www. medicalppt. blogspot. com

Supraventricular Arrhythmias • Atrial Fibrillation • Atrial Flutter • Paroxysmal Supraventricular Tachycardia For more presentations www. medicalppt. blogspot. com

Rhythm #5 • • • Rate? Regularity? P waves? PR interval? QRS duration? 100 bpm irregularly irregular none 0. 06 s Interpretation? Atrial Fibrillation For more presentations www. medicalppt. blogspot. com

Atrial Fibrillation • Deviation from NSR – No organized atrial depolarization, so no normal P waves (impulses are not originating from the sinus node). – Atrial activity is chaotic (resulting in an irregularly irregular rate). – Common, affects 2 -4%, up to 5 -10% if > 80 years old For more presentations www. medicalppt. blogspot. com

Atrial Fibrillation • Etiology: Recent theories suggest that it is due to multiple re-entrant wavelets conducted between the R & L atria. Either way, impulses are formed in a totally unpredictable fashion. The AV node allows some of the impulses to pass through at variable intervals (so rhythm is irregularly irregular). For more presentations www. medicalppt. blogspot. com

Rhythm #6 • • • Rate? Regularity? P waves? PR interval? QRS duration? 70 bpm regular flutter waves none 0. 06 s Interpretation? Atrial Flutter For more presentations www. medicalppt. blogspot. com

Atrial Flutter • Deviation from NSR – No P waves. Instead flutter waves (note “sawtooth” pattern) are formed at a rate of 250 - 350 bpm. – Only some impulses conduct through the AV node (usually every other impulse). For more presentations www. medicalppt. blogspot. com

Atrial Flutter • Etiology: Reentrant pathway in the right atrium with every 2 nd, 3 rd or 4 th impulse generating a QRS (others are blocked in the AV node as the node repolarizes). For more presentations www. medicalppt. blogspot. com

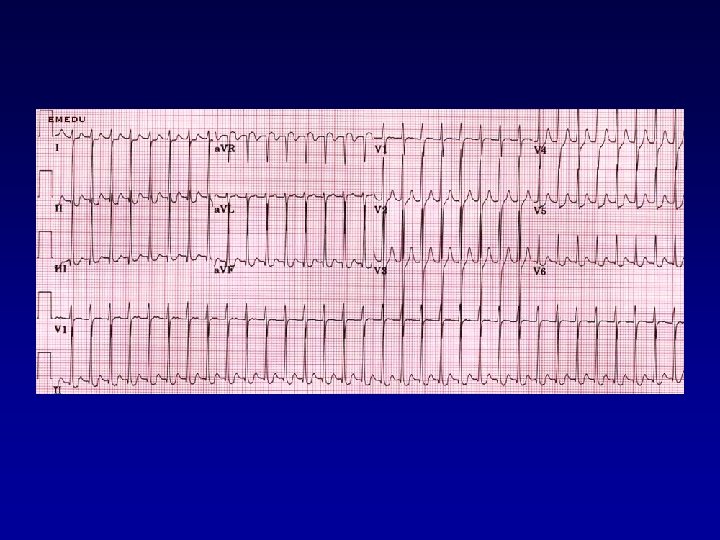
Rhythm #7 • • • Rate? Regularity? P waves? PR interval? QRS duration? 74 148 bpm Regular regular Normal none 0. 16 s none 0. 08 s Interpretation? Paroxysmal Supraventricular For more presentations www. medicalppt. blogspot. com Tachycardia (PSVT)

PSVT • Deviation from NSR – The heart rate suddenly speeds up, often triggered by a PAC (not seen here) and the P waves are lost. For more presentations www. medicalppt. blogspot. com

PSVT • Etiology: There are several types of PSVT but all originate above the ventricles (therefore the QRS is narrow). • Most common: abnormal conduction in the AV node (reentrant circuit looping in the AV node). For more presentations www. medicalppt. blogspot. com

Ventricular Arrhythmias • Ventricular Tachycardia • Ventricular Fibrillation For more presentations www. medicalppt. blogspot. com

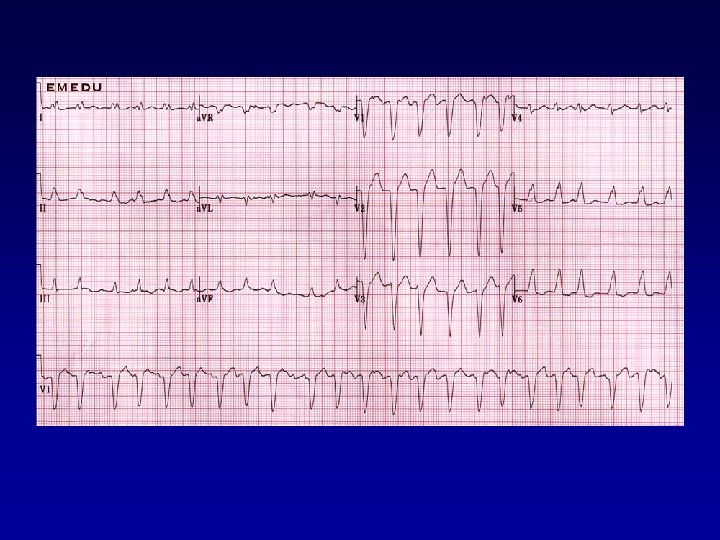
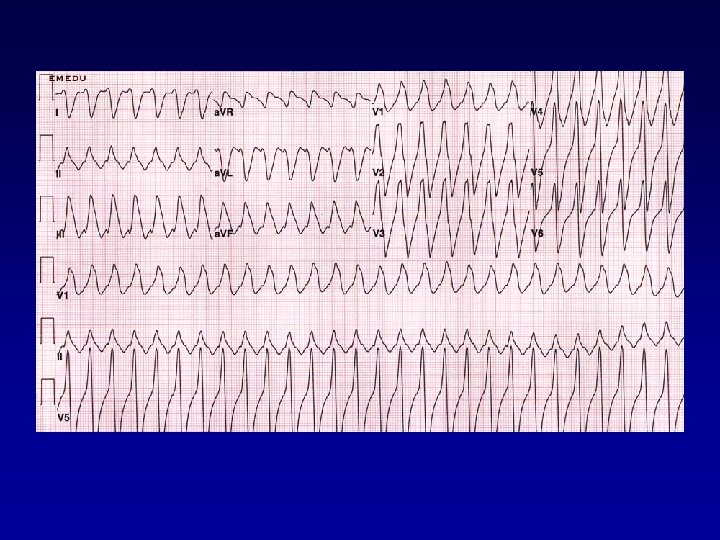
Rhythm #8 • • • Rate? Regularity? P waves? PR interval? QRS duration? 160 bpm regular none wide (> 0. 12 sec) Interpretation? Ventricular Tachycardia For more presentations www. medicalppt. blogspot. com

Ventricular Tachycardia • Deviation from NSR – Impulse is originating in the ventricles (no P waves, wide QRS). For more presentations www. medicalppt. blogspot. com

Ventricular Tachycardia • Etiology: There is a re-entrant pathway looping in a ventricle (most common cause). • Ventricular tachycardia can sometimes generate enough cardiac output to produce a pulse; at other times no pulse For more presentations www. medicalppt. blogspot. com can be felt.

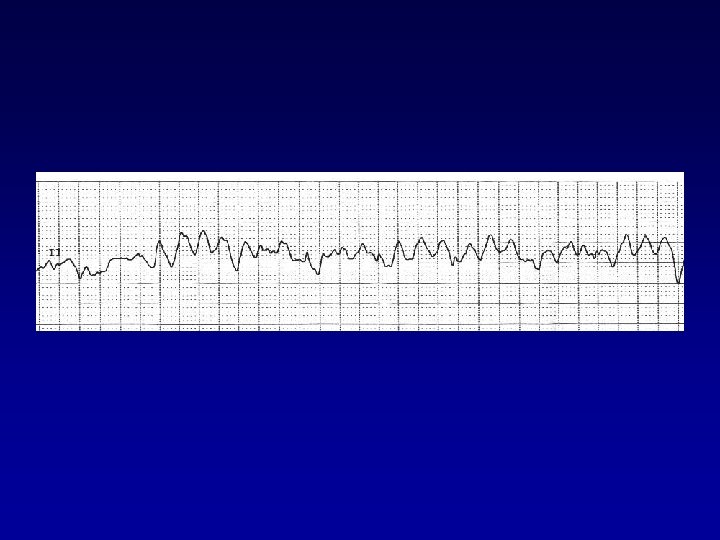
Rhythm #9 • • • Rate? Regularity? P waves? PR interval? QRS duration? none irregularly irreg. none wide, if recognizable Interpretation? Ventricular Fibrillation For more presentations www. medicalppt. blogspot. com

Ventricular Fibrillation • Deviation from NSR – Completely abnormal. For more presentations www. medicalppt. blogspot. com

Ventricular Fibrillation • Etiology: The ventricular cells are excitable and depolarizing randomly. • Rapid drop in cardiac output and death occurs if not quickly reversed For more presentations www. medicalppt. blogspot. com

End of Module IV b Supraventricular and Ventricular Arrhythmias For more presentations www. medicalppt. blogspot. com

ECG Rhythm Interpretation Module V Acute Myocardial Infarction For more presentations www. medicalppt. blogspot. com

Diagnosing a MI To diagnose a myocardial infarction you need to go beyond looking at a rhythm strip and obtain a 12 -Lead ECG Rhythm Strip For more presentations www. medicalppt. blogspot. com

The 12 -Lead ECG • The 12 -Lead ECG sees the heart from 12 different views. • Therefore, the 12 -Lead ECG helps you see what is happening in different portions of the heart. • The rhythm strip is only 1 of these 12 views. For more presentations www. medicalppt. blogspot. com
 –")
The 12 -Leads The 12 -leads include: – 3 Limb leads (I, III) – 3 Augmented leads (a. VR, a. VL, a. VF) – 6 Precordial leads (V 1 - V 6) For more presentations www. medicalppt. blogspot. com

Views of the Heart Some leads get a good view of the: Lateral portion of the heart Anterior portion of the heart Inferior portion of the heart For more presentations www. medicalppt. blogspot. com

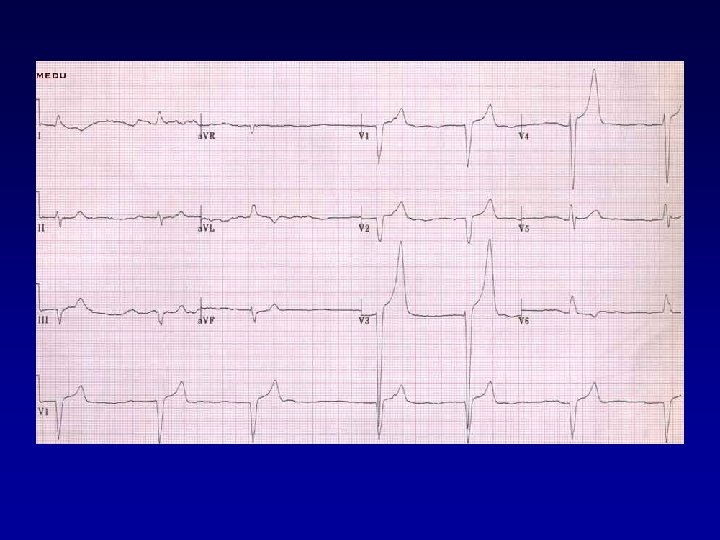
ST Elevation One way to diagnose an acute MI is to look for elevation of the ST segment. For more presentations www. medicalppt. blogspot. com
 Elevation of the ST segment (greater than 1 small box) in")
ST Elevation (cont) Elevation of the ST segment (greater than 1 small box) in 2 leads is consistent with a myocardial infarction. For more presentations www. medicalppt. blogspot. com

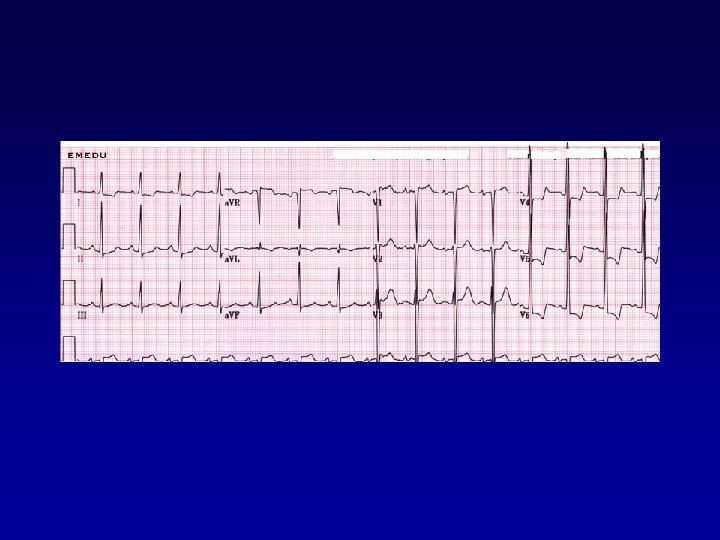
Anterior View of the Heart The anterior portion of the heart is best viewed using leads V 1 - V 4. For more presentations www. medicalppt. blogspot. com

Anterior Myocardial Infarction If you see changes in leads V 1 - V 4 that are consistent with a myocardial infarction, you can conclude that it is an anterior wall myocardial infarction. For more presentations www. medicalppt. blogspot. com

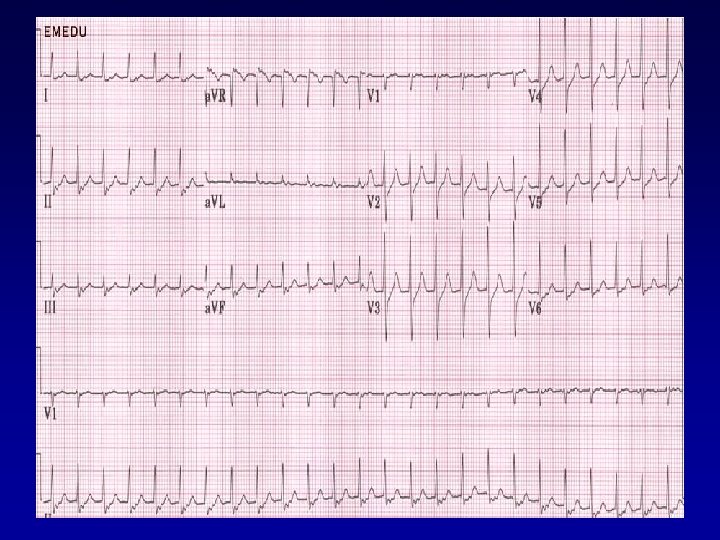
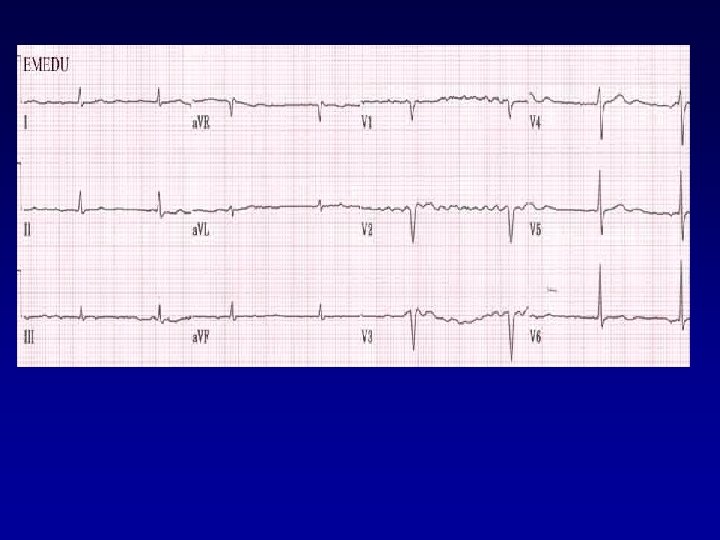
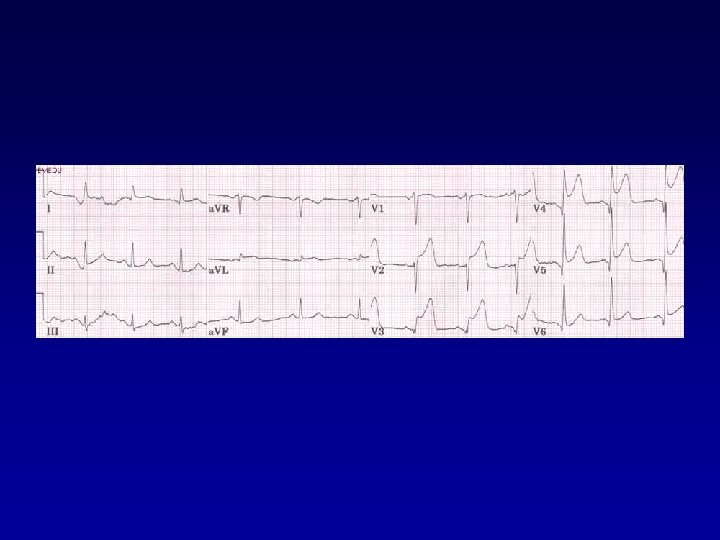
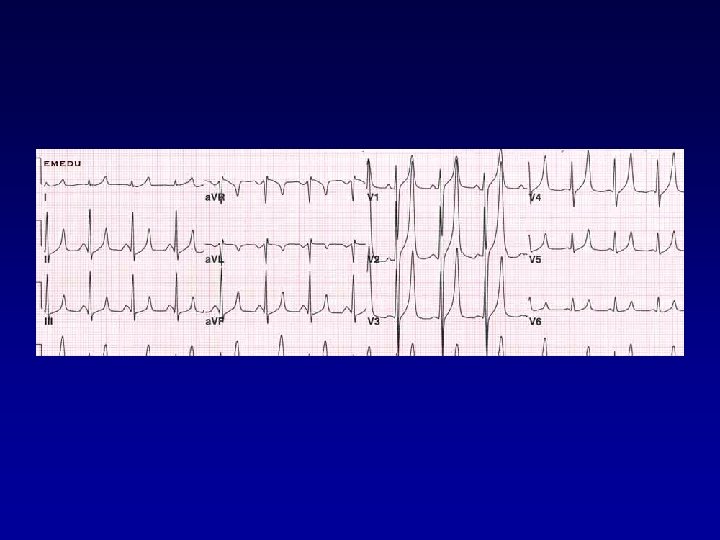
Putting it all Together Do you think this person is having a myocardial infarction. If so, where? For more presentations www. medicalppt. blogspot. com

Interpretation Yes, this person is having an acute anterior wall myocardial infarction. For more presentations www. medicalppt. blogspot. com

Other MI Locations Now that you know where to look for an anterior wall myocardial infarction let’s look at how you would determine if the MI involves the lateral wall or the inferior wall of the heart. For more presentations www. medicalppt. blogspot. com

Other MI Locations First, take a look again at this picture of the heart. Lateral portion of the heart Anterior portion of the heart Inferior portion of the heart For more presentations www. medicalppt. blogspot. com

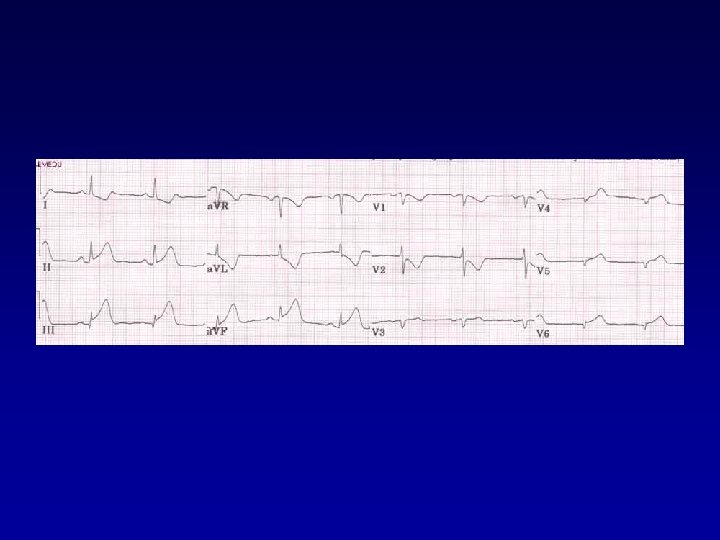
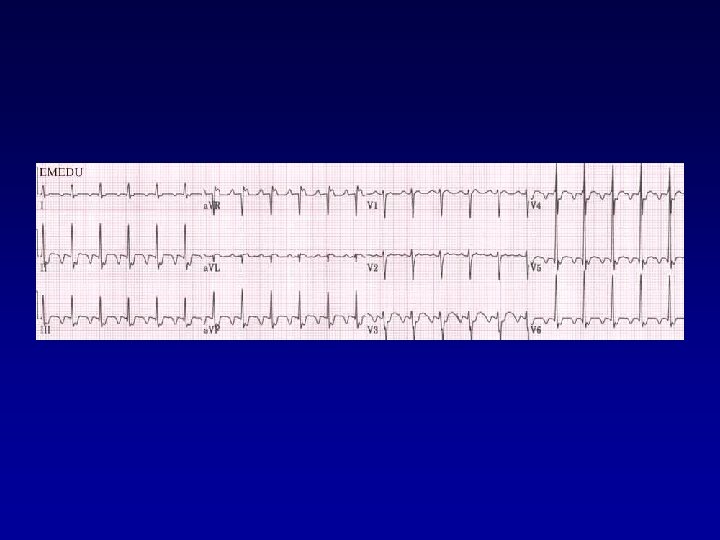
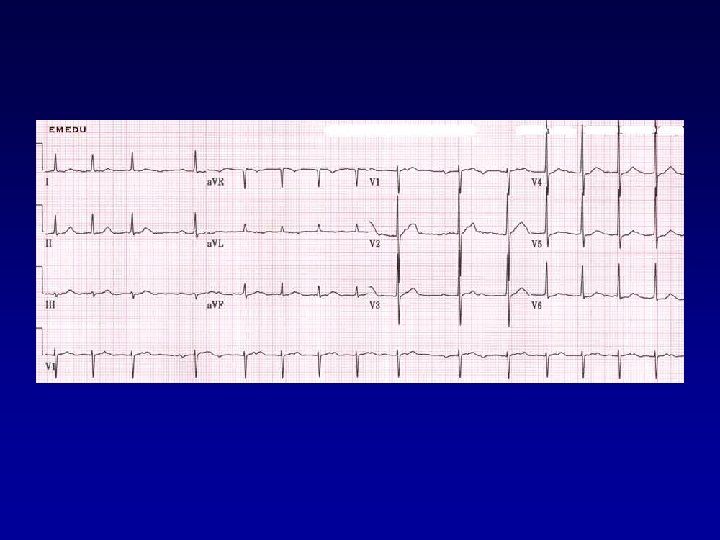
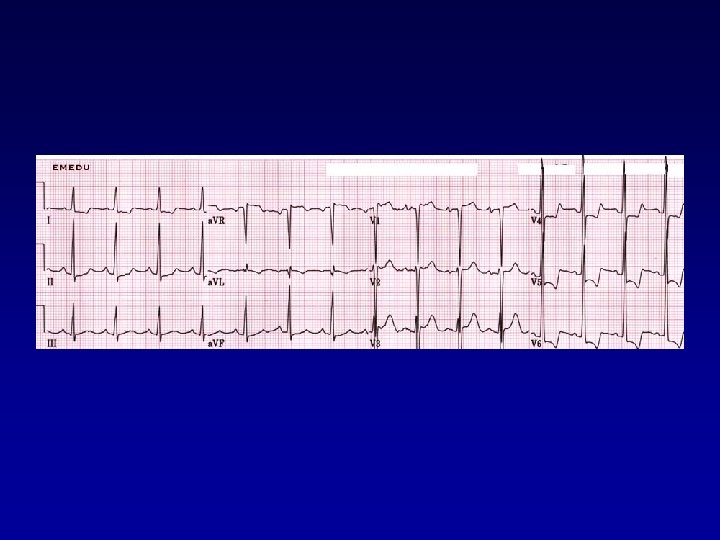
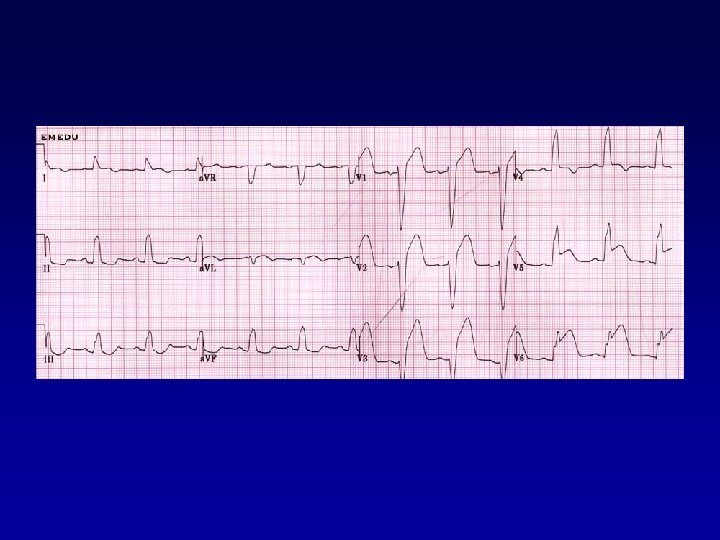
Putting it all Together Now, where do you think this person is having a myocardial infarction? For more presentations www. medicalppt. blogspot. com

Inferior Wall MI This is an inferior MI. Note the ST elevation in leads II, III and a. VF. For more presentations www. medicalppt. blogspot. com

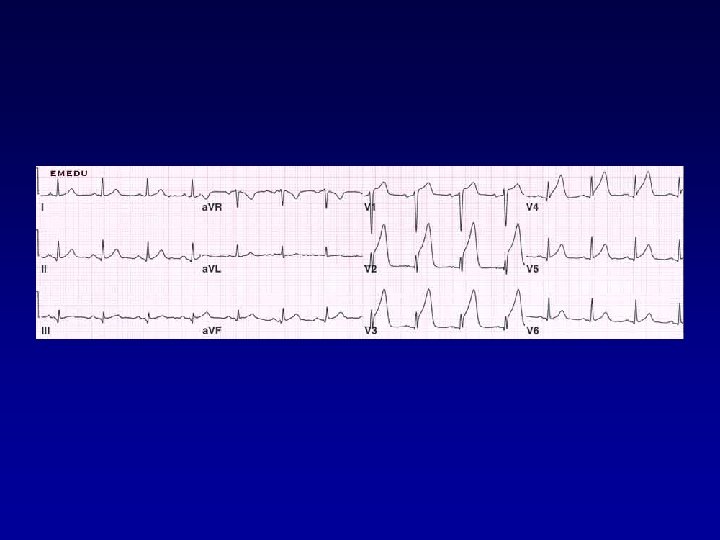
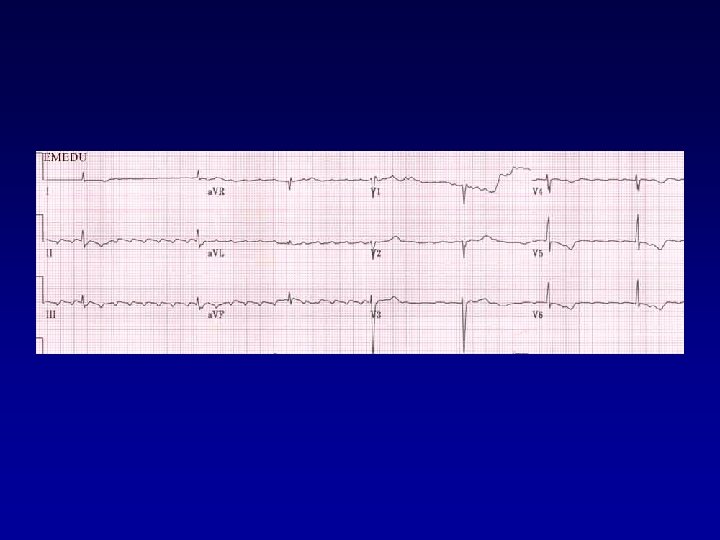
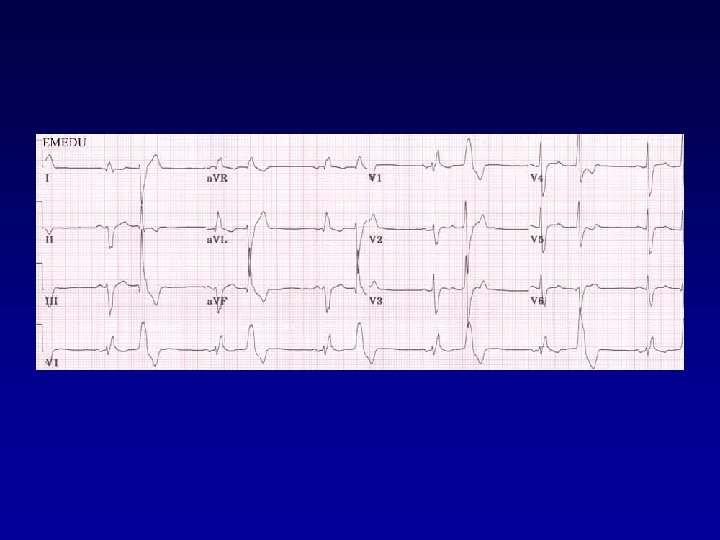
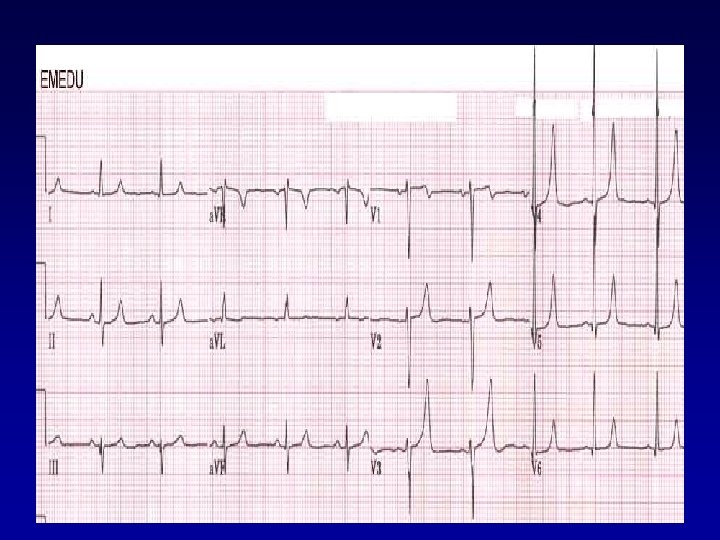
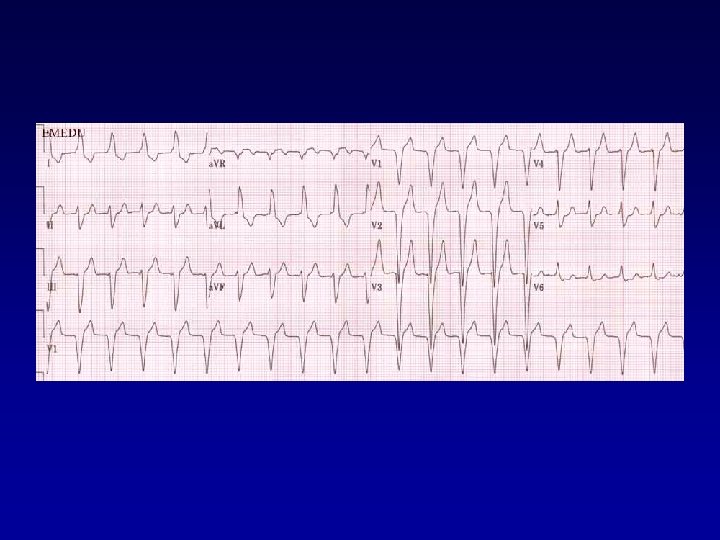
Putting it all Together How about now? For more presentations www. medicalppt. blogspot. com
")
Anterolateral MI This person’s MI involves both the anterior wall (V 2 -V 4) and the lateral wall (V 5 -V 6, I, and a. VL)! For more presentations www. medicalppt. blogspot. com


• Thank you
- Slides: 103