
ECG in myocardial ischemia and other pathologic processes

- Slides: 26
ECG in myocardial ischemia and other pathologic processes Prof. Hanáček http: //lifeinthefastlane. com/ecg-library/myocardial-ischaemia/
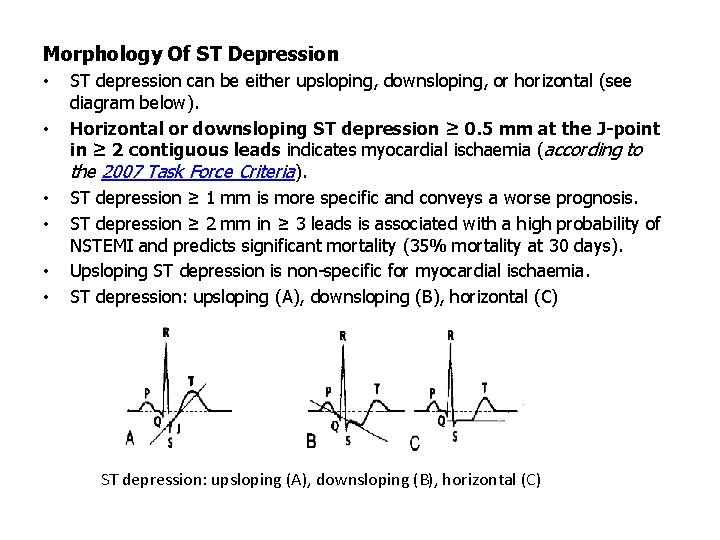
Morphology Of ST Depression • • • ST depression can be either upsloping, downsloping, or horizontal (see diagram below). Horizontal or downsloping ST depression ≥ 0. 5 mm at the J-point in ≥ 2 contiguous leads indicates myocardial ischaemia (according to the 2007 Task Force Criteria). ST depression ≥ 1 mm is more specific and conveys a worse prognosis. ST depression ≥ 2 mm in ≥ 3 leads is associated with a high probability of NSTEMI and predicts significant mortality (35% mortality at 30 days). Upsloping ST depression is non-specific for myocardial ischaemia. ST depression: upsloping (A), downsloping (B), horizontal (C)
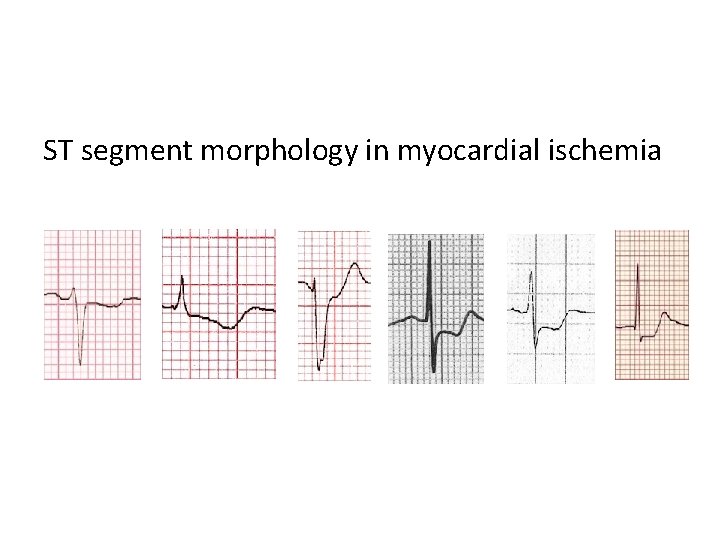
ST segment morphology in myocardial ischemia
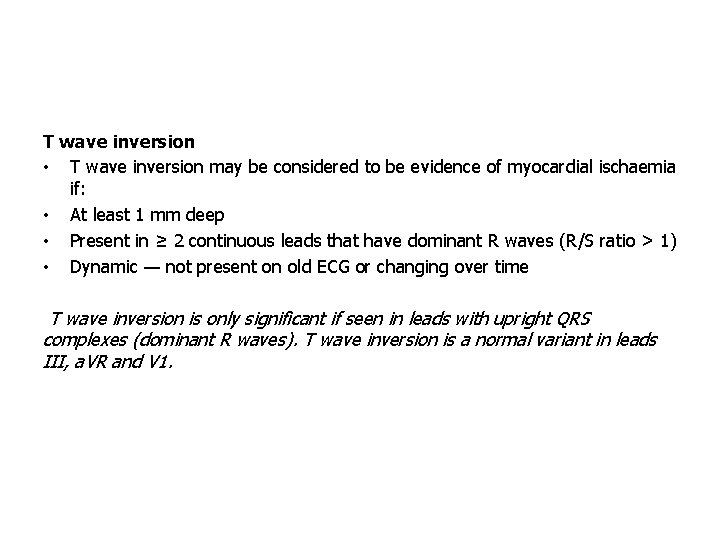
T wave inversion • T wave inversion may be considered to be evidence of myocardial ischaemia if: • At least 1 mm deep • Present in ≥ 2 continuous leads that have dominant R waves (R/S ratio > 1) • Dynamic — not present on old ECG or changing over time T wave inversion is only significant if seen in leads with upright QRS complexes (dominant R waves). T wave inversion is a normal variant in leads III, a. VR and V 1.
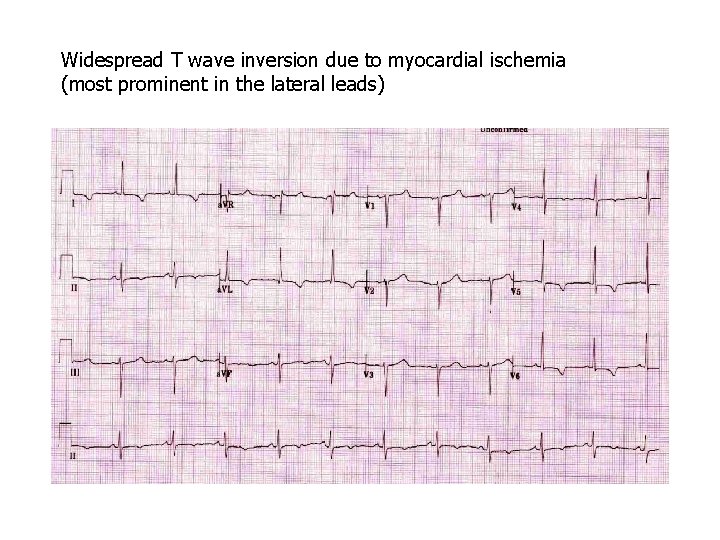
Widespread T wave inversion due to myocardial ischemia (most prominent in the lateral leads)
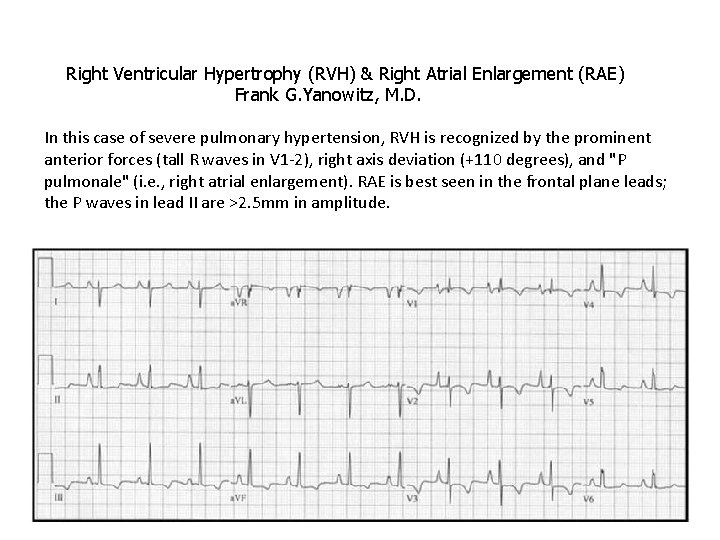
Right Ventricular Hypertrophy (RVH) & Right Atrial Enlargement (RAE) Frank G. Yanowitz, M. D. In this case of severe pulmonary hypertension, RVH is recognized by the prominent anterior forces (tall R waves in V 1 -2), right axis deviation (+110 degrees), and "P pulmonale" (i. e. , right atrial enlargement). RAE is best seen in the frontal plane leads; the P waves in lead II are >2. 5 mm in amplitude.
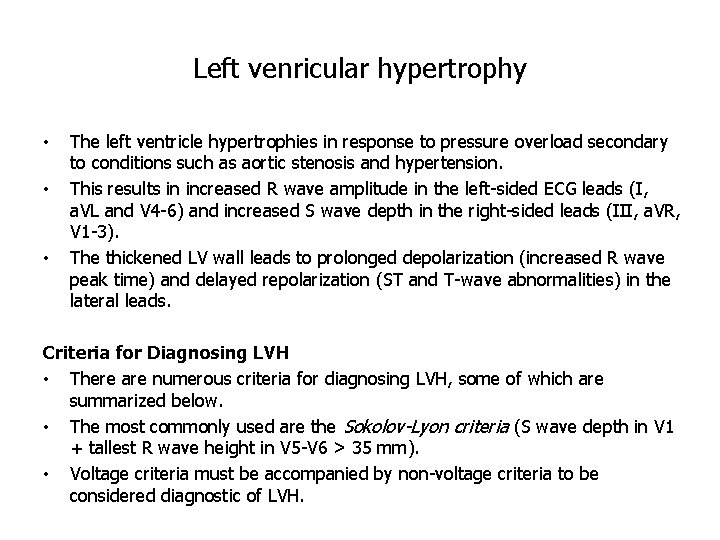
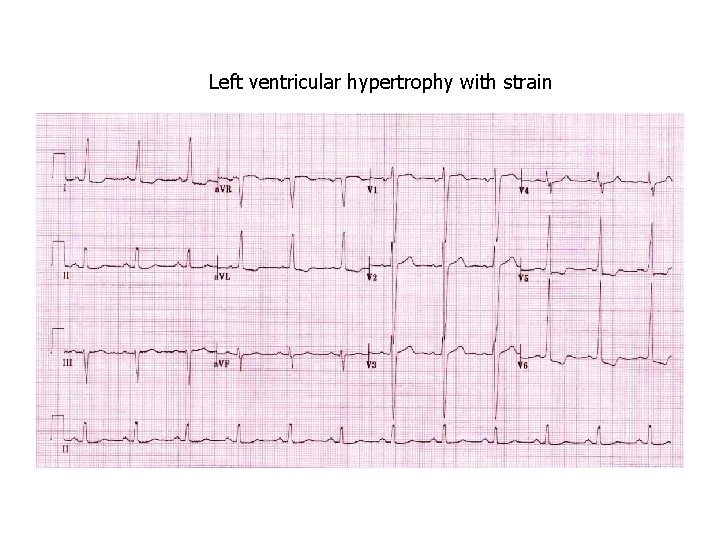
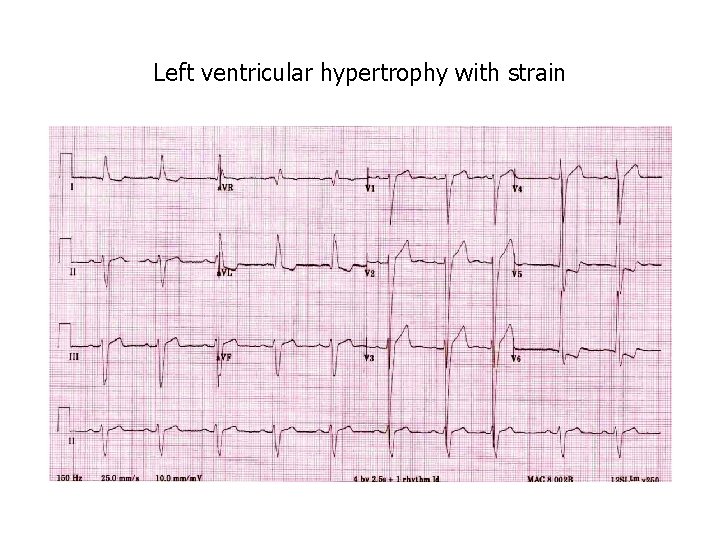
Left venricular hypertrophy • • • The left ventricle hypertrophies in response to pressure overload secondary to conditions such as aortic stenosis and hypertension. This results in increased R wave amplitude in the left-sided ECG leads (I, a. VL and V 4 -6) and increased S wave depth in the right-sided leads (III, a. VR, V 1 -3). The thickened LV wall leads to prolonged depolarization (increased R wave peak time) and delayed repolarization (ST and T-wave abnormalities) in the lateral leads. Criteria for Diagnosing LVH • There are numerous criteria for diagnosing LVH, some of which are summarized below. • The most commonly used are the Sokolov-Lyon criteria (S wave depth in V 1 + tallest R wave height in V 5 -V 6 > 35 mm). • Voltage criteria must be accompanied by non-voltage criteria to be considered diagnostic of LVH.
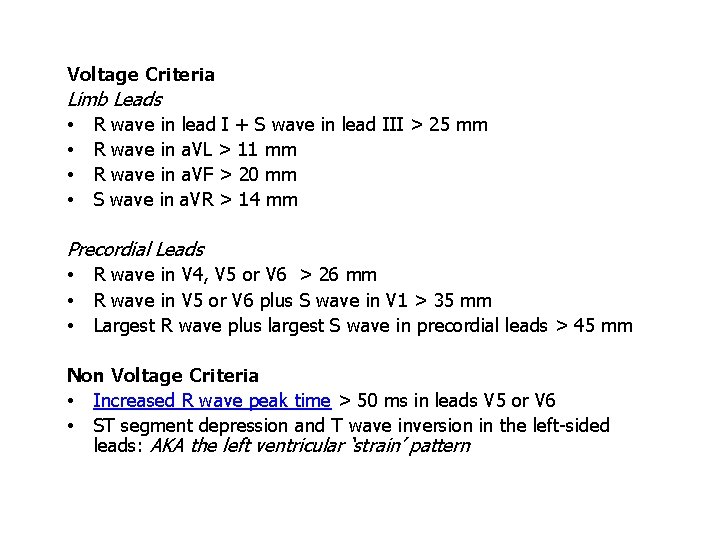
Voltage Criteria Limb Leads • R wave in lead I + S wave in lead III > 25 mm • R wave in a. VL > 11 mm • R wave in a. VF > 20 mm • S wave in a. VR > 14 mm Precordial Leads • R wave in V 4, V 5 or V 6 > 26 mm • R wave in V 5 or V 6 plus S wave in V 1 > 35 mm • Largest R wave plus largest S wave in precordial leads > 45 mm Non Voltage Criteria • Increased R wave peak time > 50 ms in leads V 5 or V 6 • ST segment depression and T wave inversion in the left-sided leads: AKA the left ventricular ‘strain’ pattern
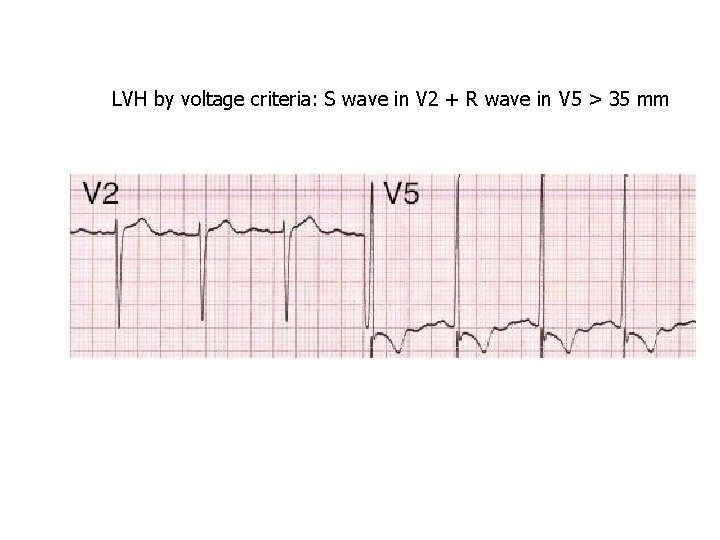
LVH by voltage criteria: S wave in V 2 + R wave in V 5 > 35 mm
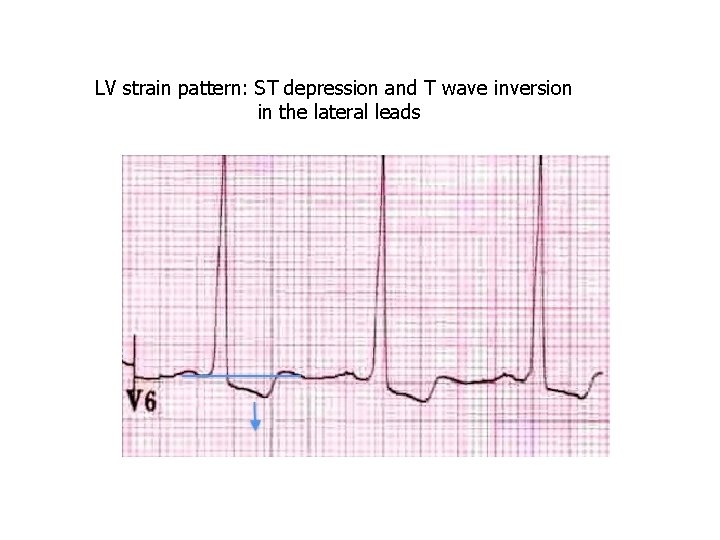
LV strain pattern: ST depression and T wave inversion in the lateral leads
Left ventricular hypertrophy with strain
Left ventricular hypertrophy with strain
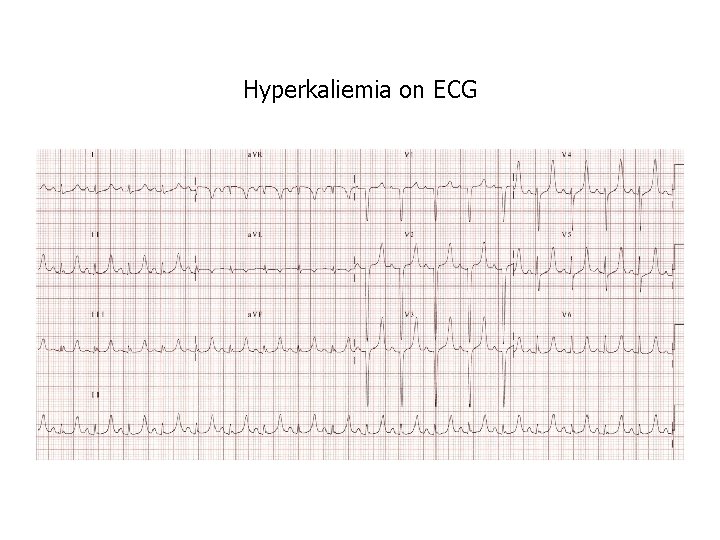
Hyperkaliemia on ECG
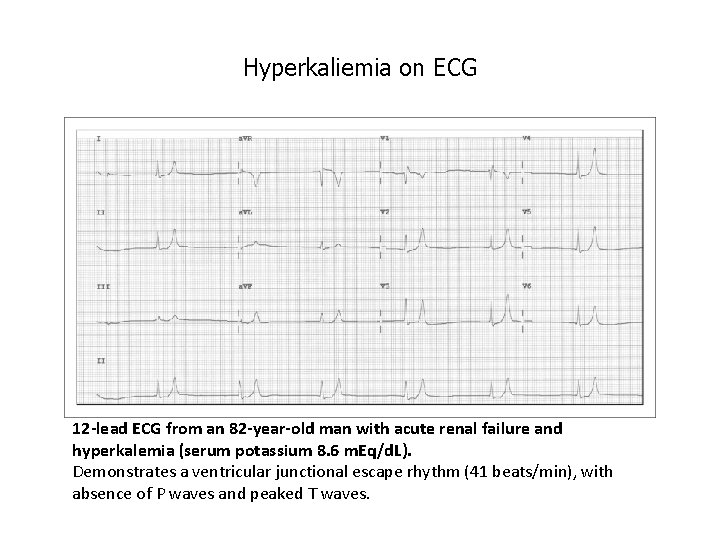
Hyperkaliemia on ECG 12 -lead ECG from an 82 -year-old man with acute renal failure and hyperkalemia (serum potassium 8. 6 m. Eq/d. L). Demonstrates a ventricular junctional escape rhythm (41 beats/min), with absence of P waves and peaked T waves.
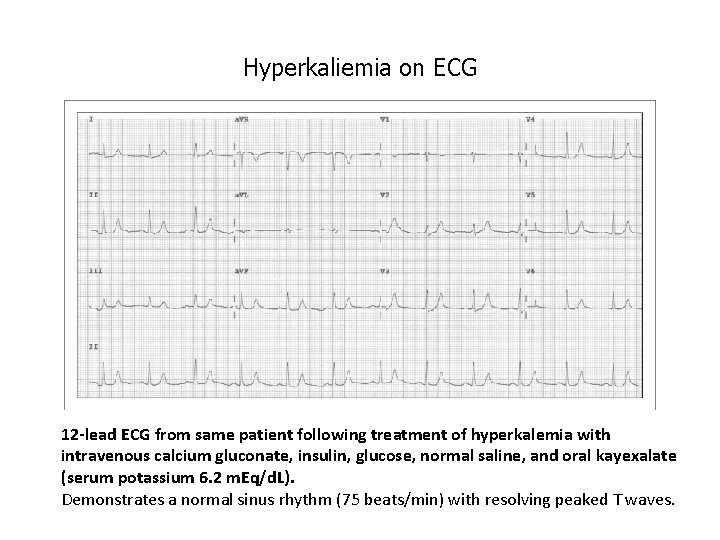
Hyperkaliemia on ECG 12 -lead ECG from same patient following treatment of hyperkalemia with intravenous calcium gluconate, insulin, glucose, normal saline, and oral kayexalate (serum potassium 6. 2 m. Eq/d. L). Demonstrates a normal sinus rhythm (75 beats/min) with resolving peaked T waves.
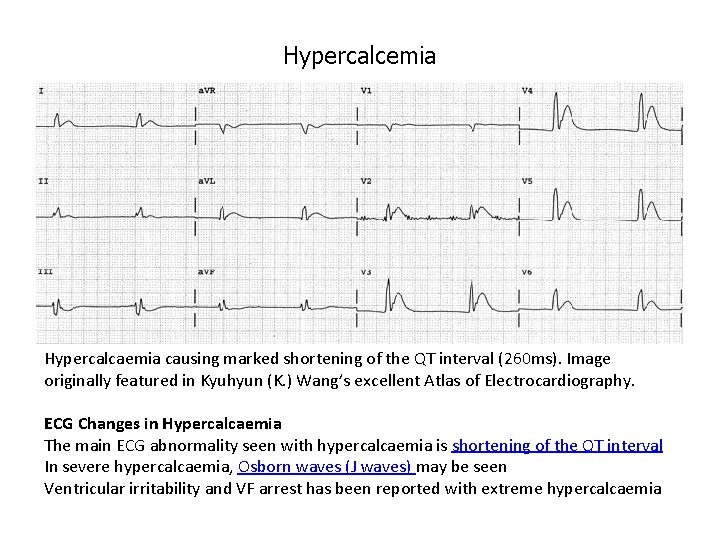
Hypercalcemia Hypercalcaemia causing marked shortening of the QT interval (260 ms). Image originally featured in Kyuhyun (K. ) Wang’s excellent Atlas of Electrocardiography. ECG Changes in Hypercalcaemia The main ECG abnormality seen with hypercalcaemia is shortening of the QT interval In severe hypercalcaemia, Osborn waves (J waves) may be seen Ventricular irritability and VF arrest has been reported with extreme hypercalcaemia
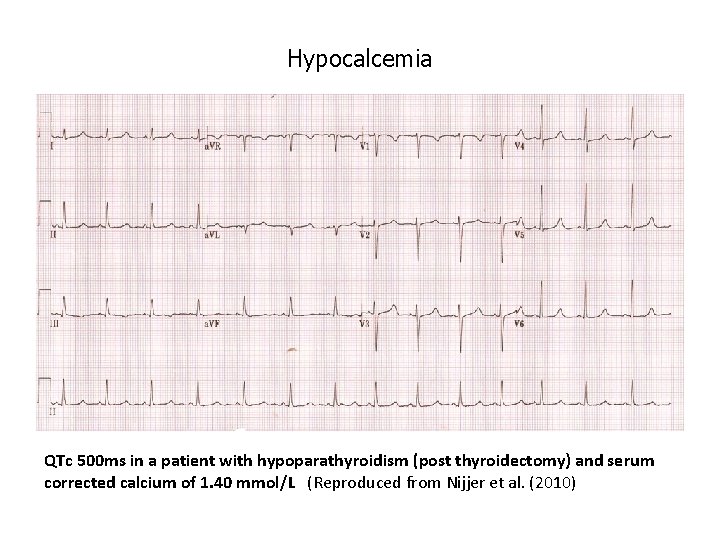
Hypocalcemia ECG changes • Hypocalcaemia causes QTc prolongation primarily by prolonging the ST segment. • The T wave is typically left unchanged. • Dysrhythmias are uncommon, although atrial fibrillation has been reported. • Torsades de pointes may occur, but is much less common than with hypokalaemia or hypomagnesaemia.
Hypocalcemia QTc 500 ms in a patient with hypoparathyroidism (post thyroidectomy) and serum corrected calcium of 1. 40 mmol/L (Reproduced from Nijjer et al. (2010)