
ECG EKG Interpretation As with all investigations the


- Slides: 97
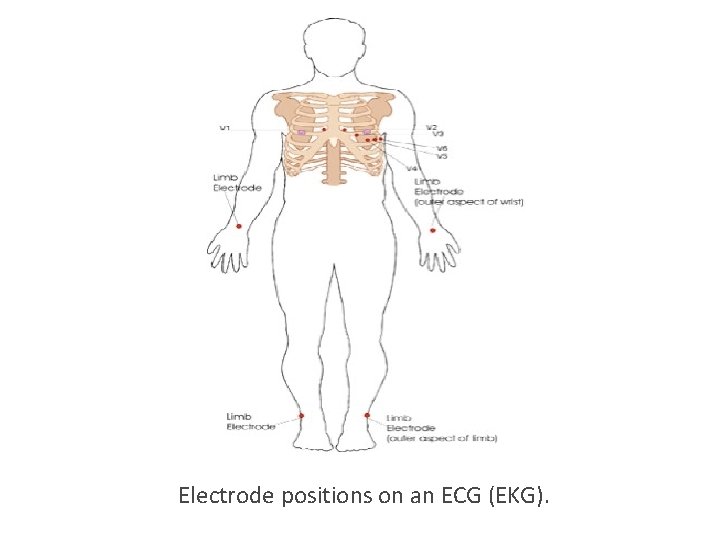
ECG (EKG) Interpretation As with all investigations the most important things are your findings on history, examination and basic observations. Having a good system will avoid making errors. To start with we will cover the basics of the ECG, how it is recorded and the basic physiology. The 12 -lead ECG misleadingly only has 10 electrodes (sometimes also called leads but to avoid confusion we will refer to them as electrodes). The leads can be thought of as taking a picture of the heart’s electrical activity from 12 different positions using information picked up by the 10 electrodes. These comprise 4 limb electrodes and 6 chest electrodes.
Electrode positions on an ECG (EKG).
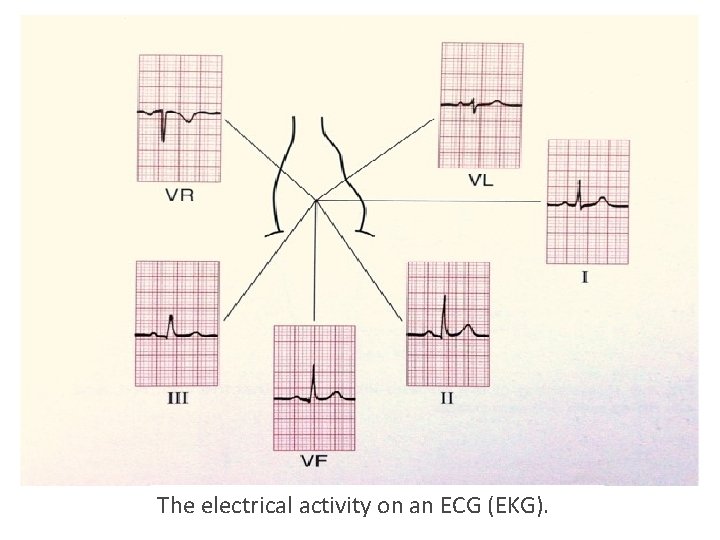
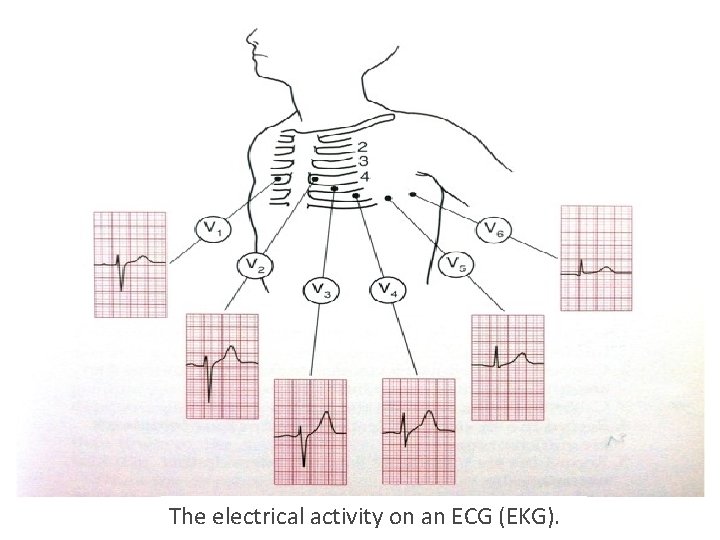
When electrical activity (or depolarisation) travels towards a lead, the deflection is net positive. When the activity travels away from the lead the deflection is net negative. If it is at 90 degrees then the complex is ‘isoelectric’ i. e. the R and S wave are the same size. This can often be seen in V.
The electrical activity on an ECG (EKG).
The electrical activity on an ECG (EKG).
The areas represented on the ECG are summarized below: V 1, V 2 = RV V 3, V 4 = septum V 5, V 6 = L side of the heart Lead II = inferior territory Lead III = inferior territory a. VF = inferior territory (remember ‘F’ for ‘feet’) a. VL = L side of the heart a. VR = R side of the heart
The ECG can be broken down into the individual components. For the purpose of this we will look at lead II. All boxes are based on the assumption that the paper speed is running at 25 mm/sec, therefore 1 large square is equivalent to 0. 2 secs and a small square to 0. 04 secs.
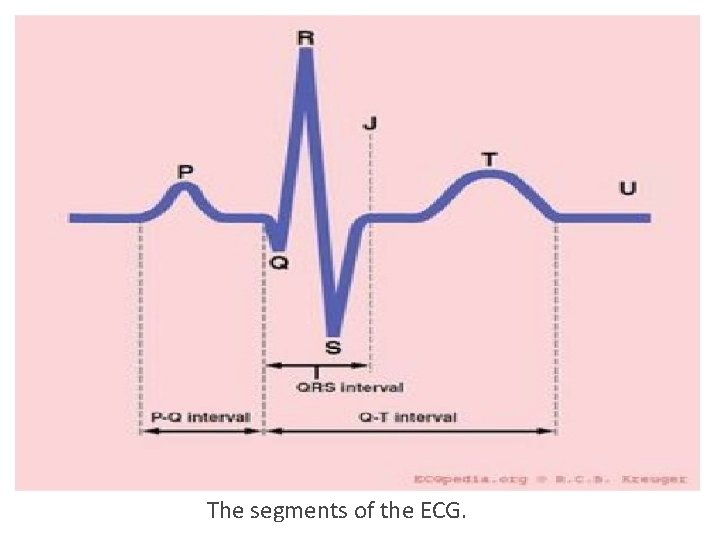
The segments of the ECG.
What do the segments of the ECG represent? § P-wave: Atrial contraction § PR interval: Represents the time taken for excitation to spread from the sino-atrial (SA) node across the atrium and down to the ventricular muscle via the bundle of His. § QRS: Ventricular contraction § ST segment: Ventricular relaxation § T-wave: Ventricular repolarisation Normal duration of ECG segments: • PR interval: 0. 12 – 0. 2 secs (3 -5 small squares) • QRS: <0. 12 secs (3 small squares) • QTc: 0. 38 – 0. 42 secs
How to read an ECG There are many different systems to interpret the ECG. This system ensures you will never miss anything: 1. Patient details 2. Situation details 3. Rate 4. Rhthm 5. Axis 6. P-wave and P-R interval 7. Q-wave and QRS complex 8. ST segment 9. QT interval 10. T-wave These components will now be explained in more detail.
1. Patient details • Patient’s name, date of birth and hospital number • Location This becomes important as in the ED or acute medical setting doctors are often shown multiple ECGs. You need to know where your patient is in order to ensure that they can be moved to a higher dependency area if appropriate.
2. Situation details When was the ECG done? • The time • The number of the ECG if it is one of a series • If you are concerned that there are dynamic changes in an ECG it is helpful to ask for serial ECGs (usually three ECGs recorded 10 minutes apart) so they can be compared. These should always be labelled 1, 2 and 3. Did the patient have chest pain at the time? • Or other relevant clinical details. For example, if you are wanted an ECG to look for changes of hyperkalaemia, note the patient’s potassium level on the ECG.
3. Measuring the rate on an ECG • Rate can be calculated in a number of ways: • Count the number of QRSs on one line of the ECG (usually lead II – running along the bottom) and multiply by six. • Count the number of large squares between R waves and divide 300 by this number (if the patient is in atrial fibrillation it is more accurate to report a rate range rather than a single value).
4. Assessing the rhythm on an ECG • Is the rhythm regular or irregular? If it is irregular is it regularly or irregularly irregular? • Rhythm can be difficult to assess especially in bradycardia or tachycardia. It may be helpful to use the ‘paper test’. • To do this place a piece of scrap paper over the ECG and mark a dot next to the top of a QRS complex, draw another dot next to the top of the next QRS then slide the paper along the ECG. If the rhythm is regular you should see that your two dots match to the tops of the QRS complexes throughout the ECG.
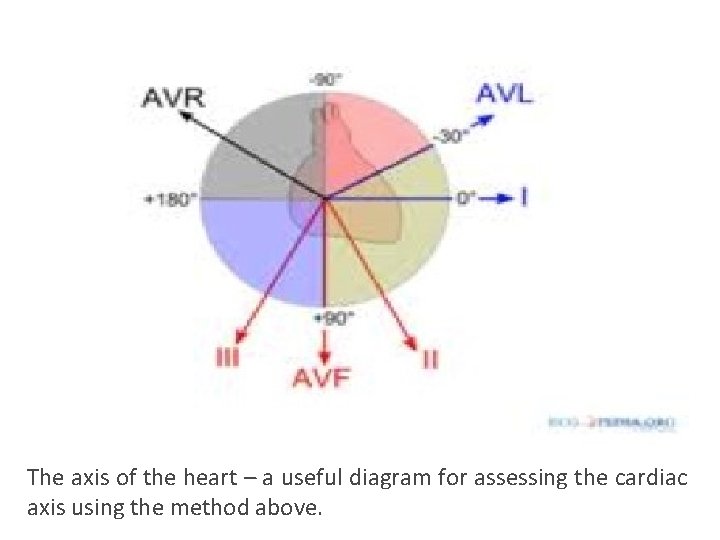
5. Assessing the axis on an ECG • Axis is the sum of all the electrical activity in the heart. • The contraction travels from the atria to the right and left ventricles. As the left ventricle is larger and more muscular normal axis lies to the left (at -30 degrees to 90 degrees – see Figure ). • As a general rule if the net deflections in leads I and a. VF are positive then the axis is normal. • If lead I has a net negative deflection whilst a. VF is positive then there is right axis deviation. • If lead I has a positive deflection and a. VF has a negative deflection there is left axis deviation
If you want to work it out more precisely you can use the method below: • Count the number of small squares of positive or negative deflection in a. VF and make a dot on the a. VF axis (see Figure 5) moving a mm for each small square counted (e. g. x mm up for negative and x mm down for positive deflections). • Count the number of small squares of positive or negative deflection in lead 1 and make a dot on the lead 1 axis moving a mm from the centre of the chart for each small square counted (e. g. x mm right for negative and x mm left for positive deflections). • Draw a horizontal line through your lead 1 dot and a vertical line through your a. VF dot then draw a line from this intersection back through 0 and this will give you the accurate axis.
The axis of the heart – a useful diagram for assessing the cardiac axis using the method above.
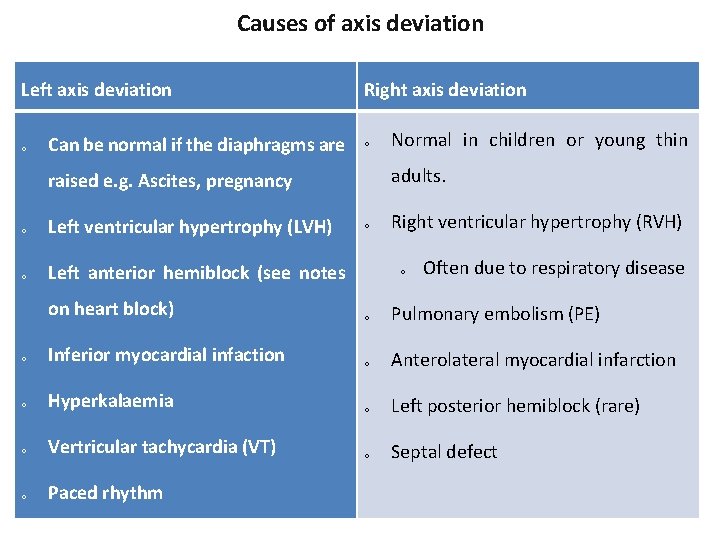
Causes of axis deviation Left axis deviation o Can be normal if the diaphragms are Right axis deviation o adults. raised e. g. Ascites, pregnancy o Left ventricular hypertrophy (LVH) o Left anterior hemiblock (see notes Normal in children or young thin o Right ventricular hypertrophy (RVH) o Often due to respiratory disease on heart block) o Pulmonary embolism (PE) o Inferior myocardial infaction o Anterolateral myocardial infarction o Hyperkalaemia o Left posterior hemiblock (rare) o Vertricular tachycardia (VT) o Septal defect o Paced rhythm
6. P-wave and PR interval § Can you see a p-wave? If the rhythm is atrial fibrillation, atrial flutter or a junctional tachycardia you may not be able to. § At this point you can also assess whether each p wave is associated with a QRS complex. P-waves not in association with QRS complexes indicate complete heart block. § Assess p-wave morphology § In some cases there can be a notched (or bifid) p-wave known as “p mitrale”, indicative of left atrial hypertrophy which may be caused by mitral stenosis. There may be tall peaked p-waves. This is called “p-pulmonale” and is indicative of right atrial hypertrophy often secondary to tricuspid stenosis or pulmonary hypertension.
§ A similar picture can be seen in hypokalaemia (known as “pseudo p-pulmonale”). § The PR interval may be prolonged in first degree heart block (described in more detail later). § The PR interval may be shortened when there is rapid conduction via an accessory pathway, for example in Wolff Parkinson White syndrome. § PR depression may be seen in pericarditis.
7. Assessing Q-wave and QRS complex • Q-wave • A q-wave is an initial downward deflection in the QRS complex. These are normal in left-sided chest leads (V 5, 6, lead I, a. VL) as they represent septal depolarization from left to right. This is as long as they are <0. 04 secs long (1 small square) and <2 mm deep. • If q-waves are larger than this or present in other leads they are pathological.
• QRS complex • Width • The QRS complex normally lasts for < 0. 12 secs (3 small squares). • Causes of a wide QRS: • Bundle branch blocks (LBBB or RBBB) • Hyperkalaemia • Paced rhythm • Ventricular pre-excitation (e. g. Wolf Parkinson White) • Ventricular rhythm • Tricyclic antidepressant (TCA) poisoning
• Shape and height • The QRS may be small (or low voltage) in pericardial effusion, high BMI, emphysema, cardiomyopathy and cardiac amyloid. • The QRS is tall in left ventricular hypertrophy (LVH) • The criteria suggestive of LVH on the ECG is if the height of the R wave in V 6 + the depth of the S wave in V 1. If this value is >35 mm this is suggestive of LVH. • The QRS can also be tall in young, fit people (especially if thin).
8. ST segment • The ST segment can be normal, elevated or depressed. To be significant the S-T segment must be depressed or elevated by 1 or more millimeters in 2 consecutive limb leads or 2 or more millimeters in 2 consecutive chest leads. Look out for reciprocal changes. • ST elevation indicates infarction. • ST depression is normally due to ischaemia. • ST segment depression may also be seen in digoxin toxicity. Here the ST depression will be downsloping (sometimes known as the “reverse tick” sign).
NB: High-takeoff • A mimic of ST elevation is high-takeoff. High-takeoff is also known as benign early repolarization. • High-takeoff is where there is widespread concave ST elevation, often with a slurring of the j-point (start of the ST segment). It is most prominent in leads V 2 -5, is usually in young health people and is benign. • The best ways to differentiate it from myocardial infarction are: • The ST segments are concave; they are most prominent in V 2 -5; they have a slurred start (j-point); the ST elevation is usually minimal compared to the amplitude of the t-wave; there are no reciprocal changes; the ST segments do not change over time.
9. QT interval • The QT interval is the time between the start of the q-wave and the end of the t-wave. • The QT interval is corrected for heart rate giving the QTc. • As a quick check, if the t-waves occur over half way between the QRS complexes the QTc may be lengthened • Not an accurate method but very quick! • A long QTc interval (known as “long QT”) is especially important to identify in patients with a history of collapse or transient loss of consciousness.
Causes of long QT: Drugs o Metabolic Familial Other Tricyclic antidepressan ts (TCAs) o Hypothermia o Terfenadine o Hypokalaemia o Erythromycin o o o es o a Amiodarone Phenothiazin Quinidine Hypocalcaemi o Hypothyroidis m o o o Long QT syndrome o IHD o Myocardi Brugada syndrome Arrhythmogenic RV dysplasia tis
10. T-wave The t-wave can be flattened or inverted for a number of reasons: • Normal variant • Commonly inverted in a. VR and V 1 and often in V 2 and V 3 in people of afro-Caribbean descent. • Ischaemia • Ventricular hypertrophy (strain pattern) usually in lateral leads • LBBB (t-wave inversion in the anterolateral leads) • Digoxin • Hypokalaemia (can cause flattened t-waves)
N. B. Hyperkalaemia causes peaked T waves. The classic changes in hyperkalaemia are: • Small p-wave • Tall, tented (peaked) t-wave • Wide QRS • Widening of the QRS indicates severe cardiac toxicity
Summary Following steps 1 -10 above give the ideal system for interpreting an ECG. If you work through these steps you will be unlikely to miss anything significant.
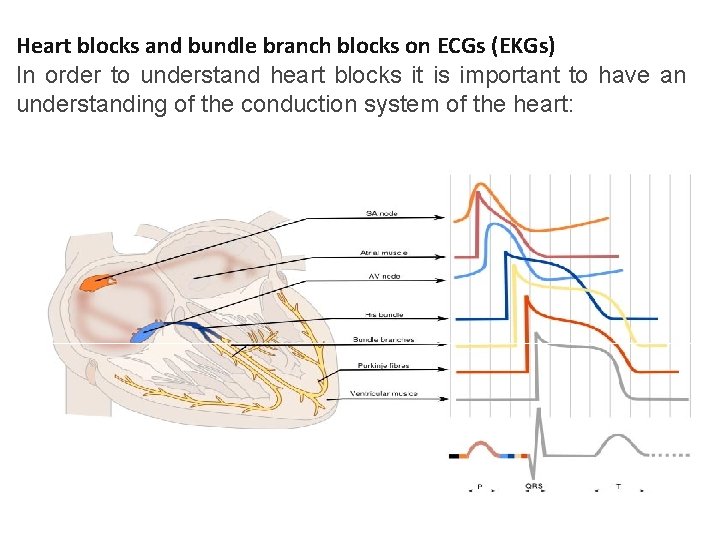
Heart blocks and bundle branch blocks on ECGs (EKGs) In order to understand heart blocks it is important to have an understanding of the conduction system of the heart:
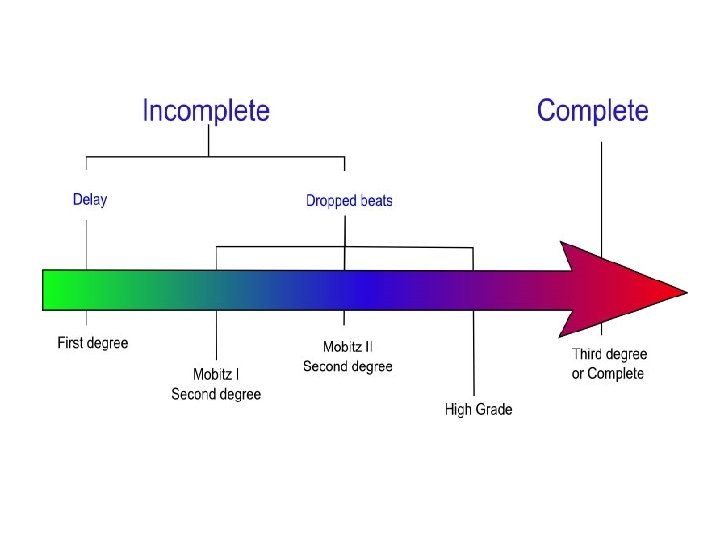
Passage of current through the heart • The initial signal originates at the sinoatrial node (SAN) • It is conducted through the myocardium of the atria and then passes via the atrio ventricular node (AVN) to the bundle of His. This bundle then splits into two bundle branches (left and right) • The left bundle further splits into anterior and posterior fascicles (more on that later) • Conduction continues through the Purkinjie fibres and finally into the ventricular muscle which contracts in systole which corresponds to the QRS complex Below we discuss what happens when the conduction system is interrupted. The figure below gives an overview but we will look at each block in more detail.
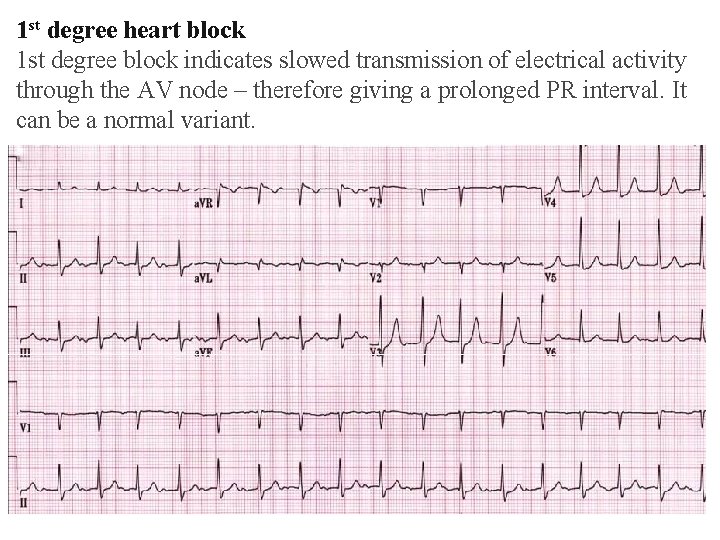
1 st degree heart block 1 st degree block indicates slowed transmission of electrical activity through the AV node – therefore giving a prolonged PR interval. It can be a normal variant.
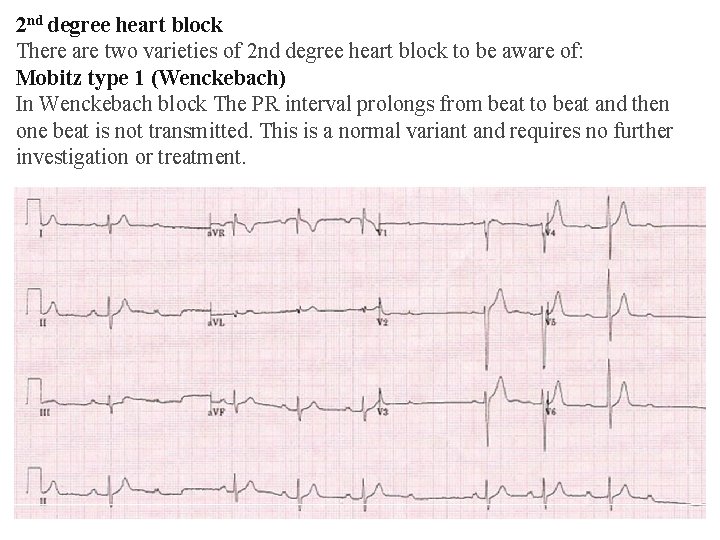
2 nd degree heart block There are two varieties of 2 nd degree heart block to be aware of: Mobitz type 1 (Wenckebach) In Wenckebach block The PR interval prolongs from beat to beat and then one beat is not transmitted. This is a normal variant and requires no further investigation or treatment.
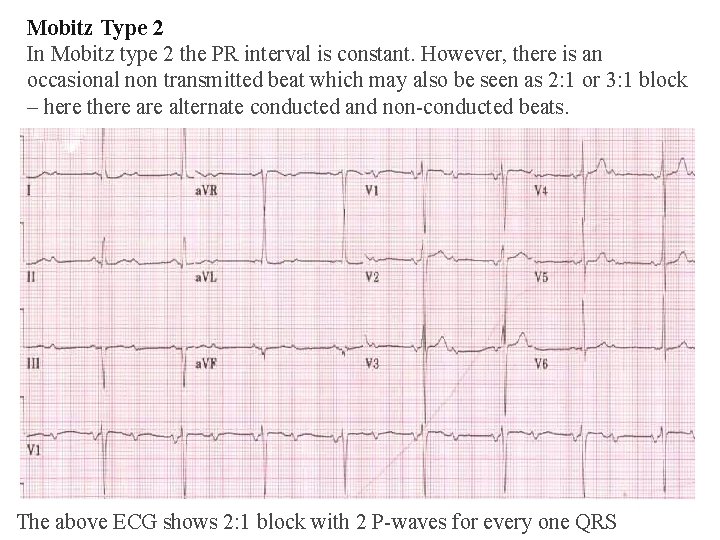
Mobitz Type 2 In Mobitz type 2 the PR interval is constant. However, there is an occasional non transmitted beat which may also be seen as 2: 1 or 3: 1 block – here there alternate conducted and non-conducted beats. The above ECG shows 2: 1 block with 2 P-waves for every one QRS
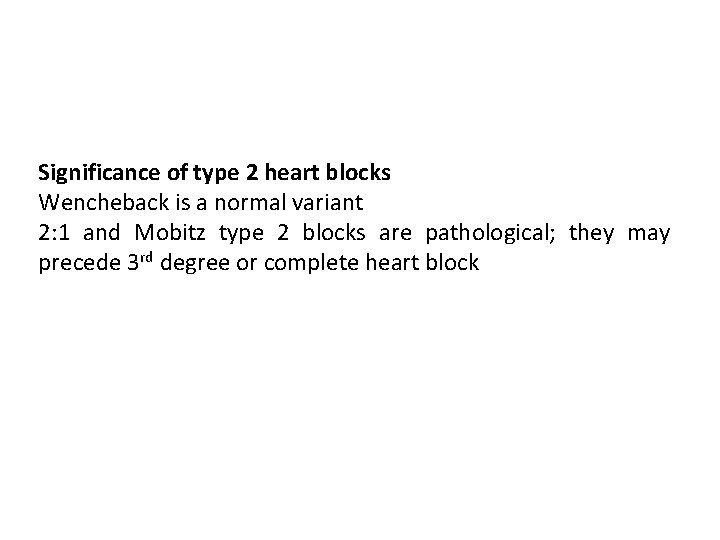
Significance of type 2 heart blocks Wencheback is a normal variant 2: 1 and Mobitz type 2 blocks are pathological; they may precede 3 rd degree or complete heart block
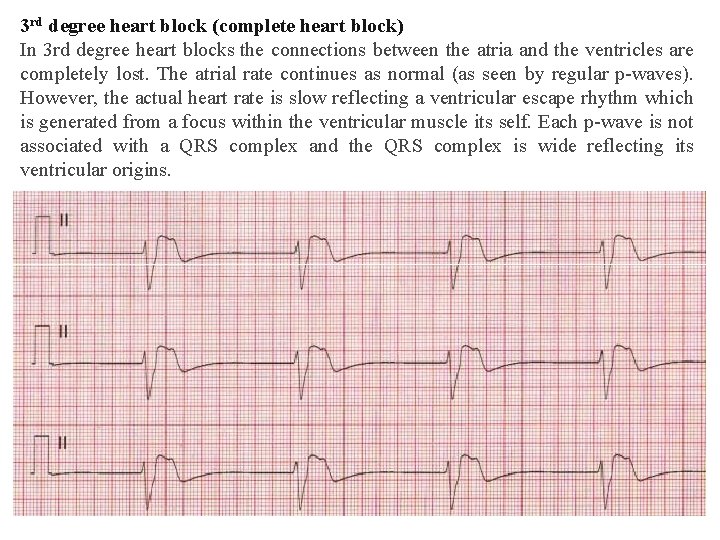
3 rd degree heart block (complete heart block) In 3 rd degree heart blocks the connections between the atria and the ventricles are completely lost. The atrial rate continues as normal (as seen by regular p-waves). However, the actual heart rate is slow reflecting a ventricular escape rhythm which is generated from a focus within the ventricular muscle its self. Each p-wave is not associated with a QRS complex and the QRS complex is wide reflecting its ventricular origins.
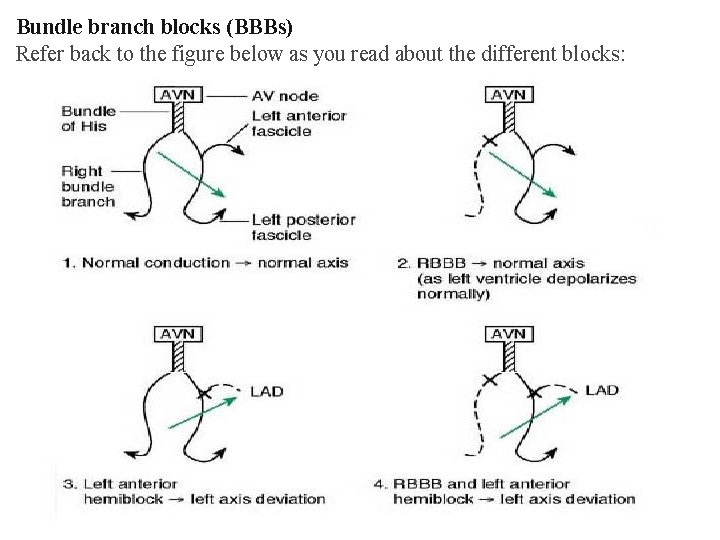
Bundle branch blocks (BBBs) Refer back to the figure below as you read about the different blocks:
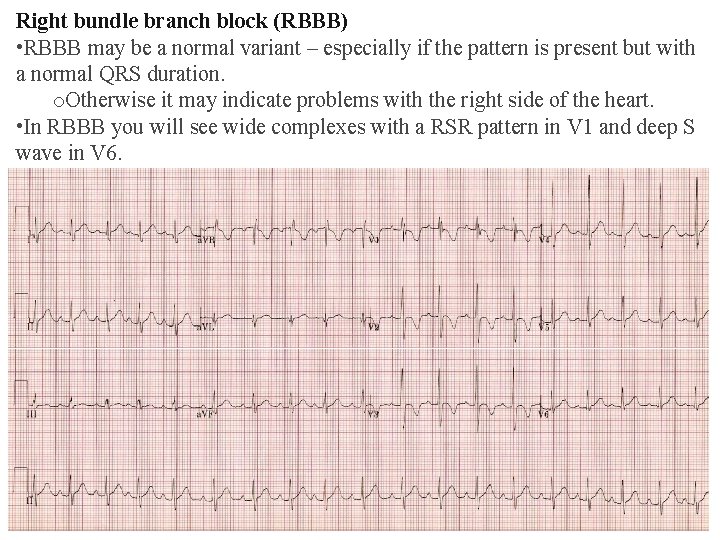
Right bundle branch block (RBBB) • RBBB may be a normal variant – especially if the pattern is present but with a normal QRS duration. o. Otherwise it may indicate problems with the right side of the heart. • In RBBB you will see wide complexes with a RSR pattern in V 1 and deep S wave in V 6.
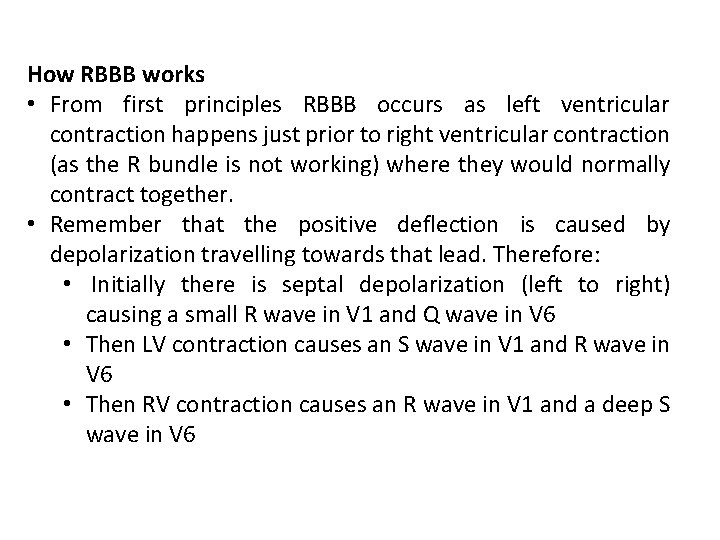
How RBBB works • From first principles RBBB occurs as left ventricular contraction happens just prior to right ventricular contraction (as the R bundle is not working) where they would normally contract together. • Remember that the positive deflection is caused by depolarization travelling towards that lead. Therefore: • Initially there is septal depolarization (left to right) causing a small R wave in V 1 and Q wave in V 6 • Then LV contraction causes an S wave in V 1 and R wave in V 6 • Then RV contraction causes an R wave in V 1 and a deep S wave in V 6
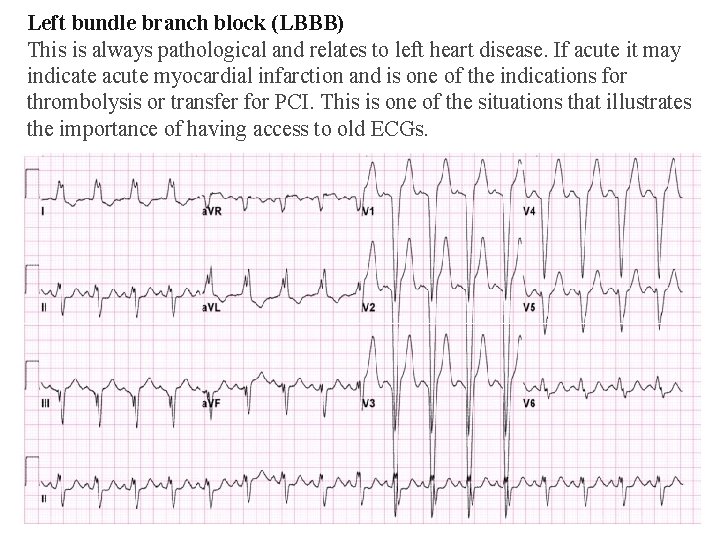
Left bundle branch block (LBBB) This is always pathological and relates to left heart disease. If acute it may indicate acute myocardial infarction and is one of the indications for thrombolysis or transfer for PCI. This is one of the situations that illustrates the importance of having access to old ECGs.
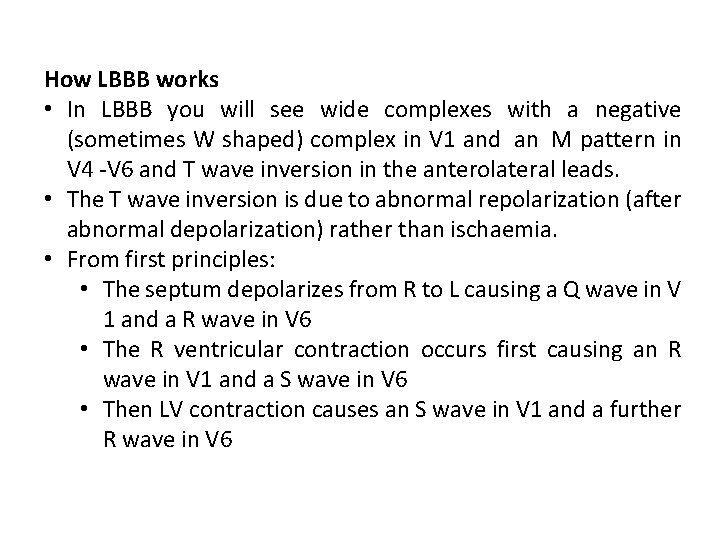
How LBBB works • In LBBB you will see wide complexes with a negative (sometimes W shaped) complex in V 1 and an M pattern in V 4 -V 6 and T wave inversion in the anterolateral leads. • The T wave inversion is due to abnormal repolarization (after abnormal depolarization) rather than ischaemia. • From first principles: • The septum depolarizes from R to L causing a Q wave in V 1 and a R wave in V 6 • The R ventricular contraction occurs first causing an R wave in V 1 and a S wave in V 6 • Then LV contraction causes an S wave in V 1 and a further R wave in V 6
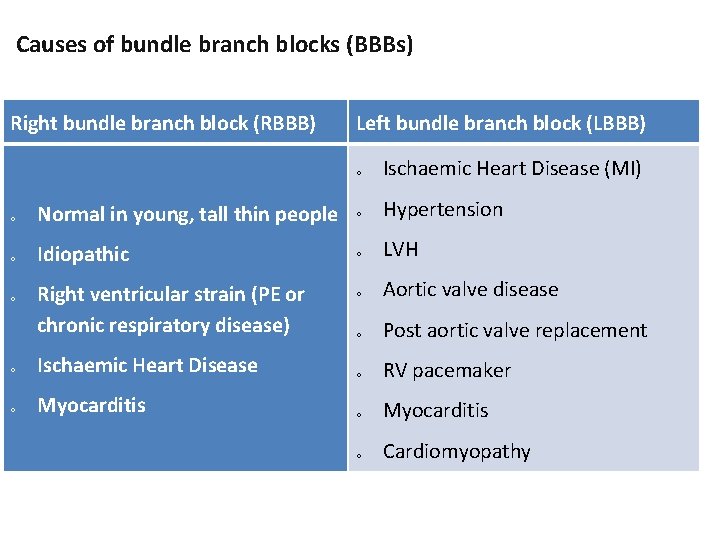
Causes of bundle branch blocks (BBBs) Right bundle branch block (RBBB) Left bundle branch block (LBBB) o Ischaemic Heart Disease (MI) o Normal in young, tall thin people o Hypertension o Idiopathic o LVH o Aortic valve disease o Post aortic valve replacement o Right ventricular strain (PE or chronic respiratory disease) o Ischaemic Heart Disease o RV pacemaker o Myocarditis o Cardiomyopathy
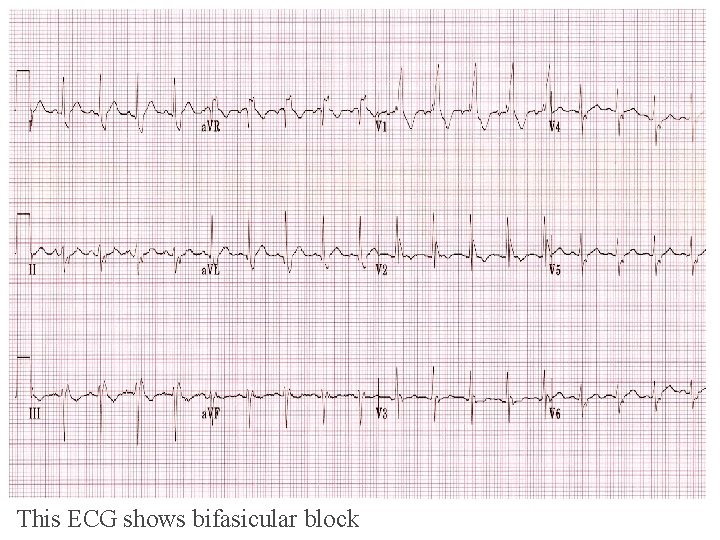
Fascicular blocks • The left bundle can also be split into anterior and posterior fascicles (as shown in the figure above) and block can affect either of these. • Anterior fascicular block • If the anterior fascicle is blocked the cardiac axis swings round to the left causing left axis deviation. • This is known as left anterior hemiblock • It is often caused by LVH • Posterior fascicular block • Uncommonly the left posterior fascicle is exclusively blocked in which case there is right axis deviation. • Bifascicular block • If the left anterior fascicle (or left posterior fascicle but this is much less common) and the right bundle are blocked you will see both right bundle branch block and left axis deviation, this is known as bifascicular block. • This is clinically important as the patient may intermittently go into complete heart block as they are solely relying on the posterior fascicle for ventricular contraction.
This ECG shows bifasicular block
Trifascicular block If there is bifasicular block with a prolonged pr interval (i. e. first degree block) this is known as trifasicular block as there is block in 2 fasicles and a delay in the 3 rd As with bifasicular block it should be treated urgently as it may deteriorate into complete heart block
ECG (EKG) examples and quiz For each of the questions below a short clinical scenario is given followed by the 12 -lead ECG. Review the ECG (EKG), present it according to the structure in ECG interpretation and attempt a diagnosis before clicking on the plus symbol to see the answer.
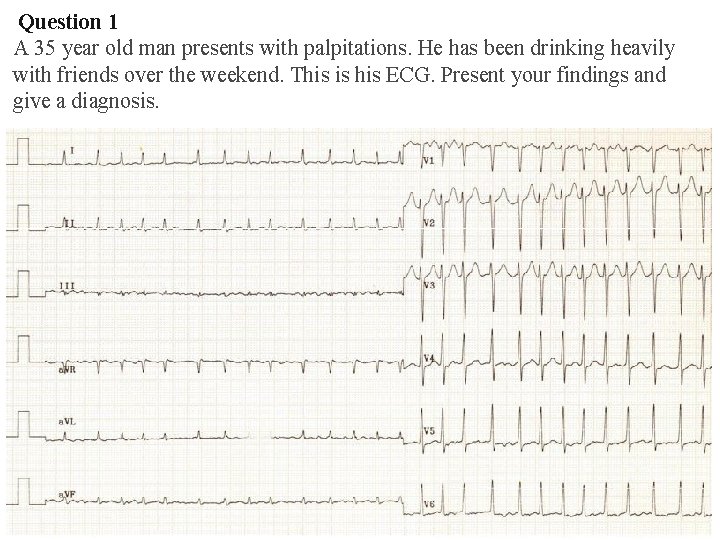
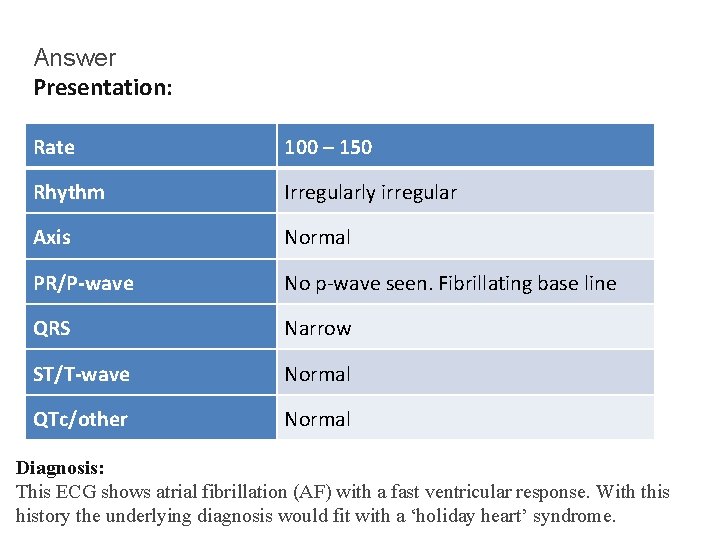
Question 1 A 35 year old man presents with palpitations. He has been drinking heavily with friends over the weekend. This is his ECG. Present your findings and give a diagnosis.
Answer Presentation: Rate 100 – 150 Rhythm Irregularly irregular Axis Normal PR/P-wave No p-wave seen. Fibrillating base line QRS Narrow ST/T-wave Normal QTc/other Normal Diagnosis: This ECG shows atrial fibrillation (AF) with a fast ventricular response. With this history the underlying diagnosis would fit with a ‘holiday heart’ syndrome.
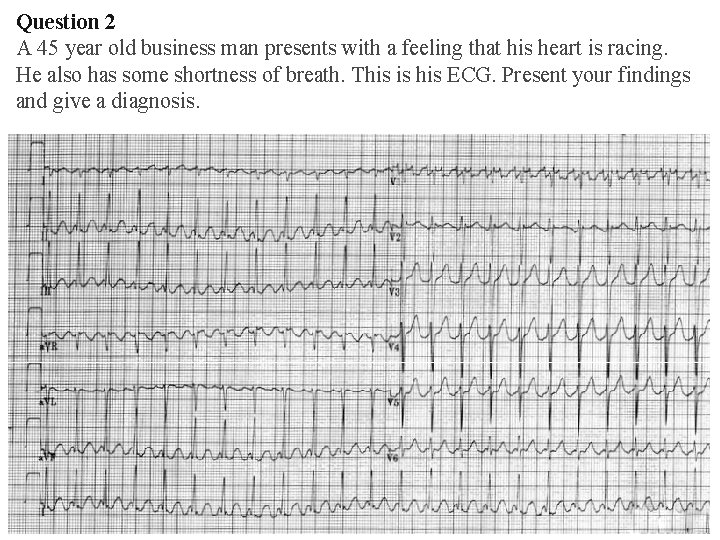
Question 2 A 45 year old business man presents with a feeling that his heart is racing. He also has some shortness of breath. This is his ECG. Present your findings and give a diagnosis.
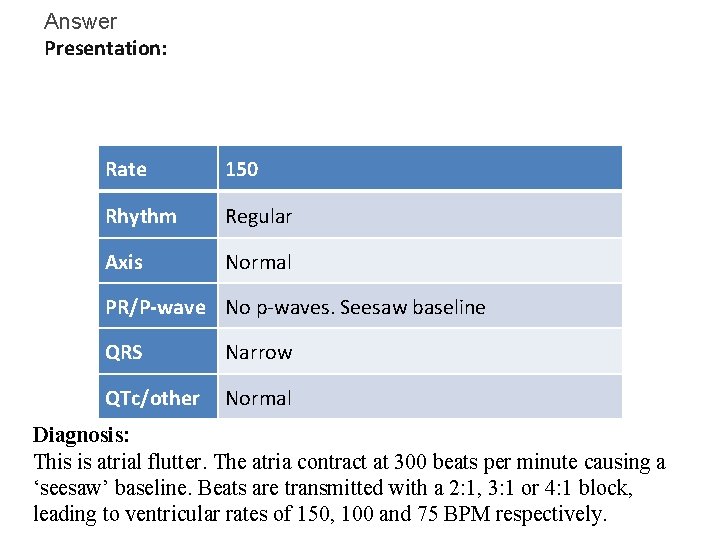
Answer Presentation: Rate 150 Rhythm Regular Axis Normal PR/P-wave No p-waves. Seesaw baseline QRS Narrow QTc/other Normal Diagnosis: This is atrial flutter. The atria contract at 300 beats per minute causing a ‘seesaw’ baseline. Beats are transmitted with a 2: 1, 3: 1 or 4: 1 block, leading to ventricular rates of 150, 100 and 75 BPM respectively.
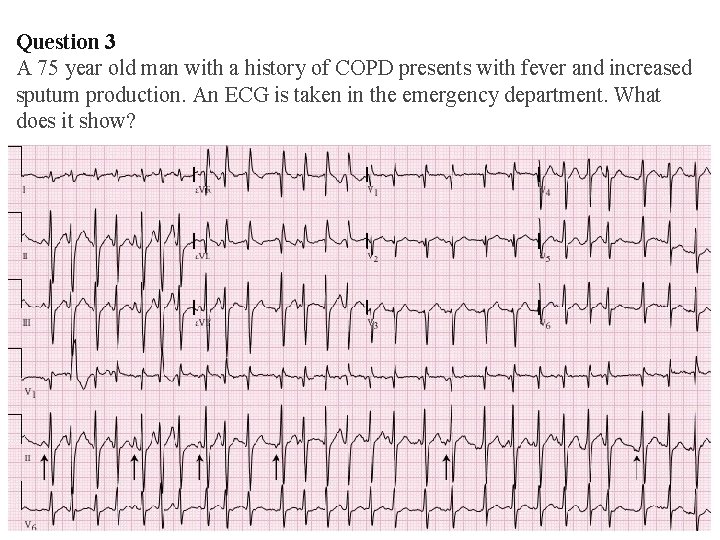
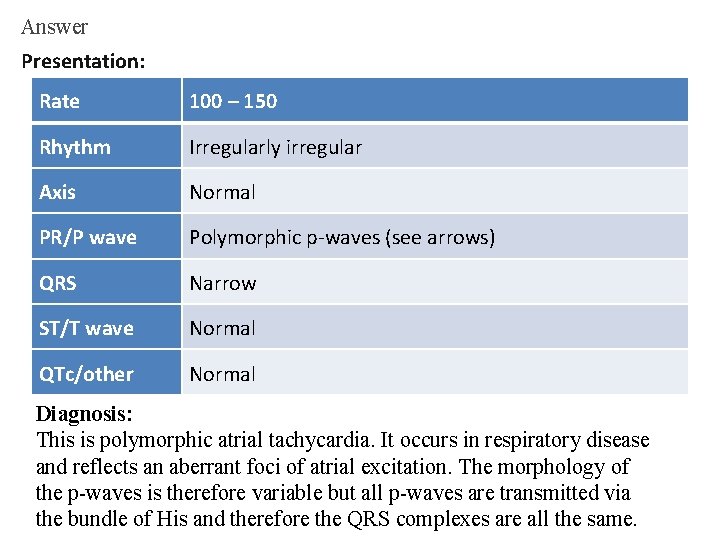
Question 3 A 75 year old man with a history of COPD presents with fever and increased sputum production. An ECG is taken in the emergency department. What does it show?
Answer Presentation: Rate 100 – 150 Rhythm Irregularly irregular Axis Normal PR/P wave Polymorphic p-waves (see arrows) QRS Narrow ST/T wave Normal QTc/other Normal Diagnosis: This is polymorphic atrial tachycardia. It occurs in respiratory disease and reflects an aberrant foci of atrial excitation. The morphology of the p-waves is therefore variable but all p-waves are transmitted via the bundle of His and therefore the QRS complexes are all the same.
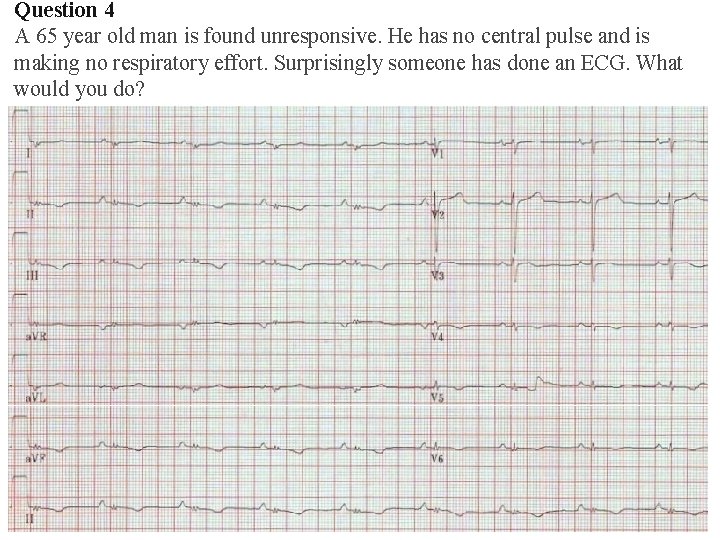
Question 4 A 65 year old man is found unresponsive. He has no central pulse and is making no respiratory effort. Surprisingly someone has done an ECG. What would you do?
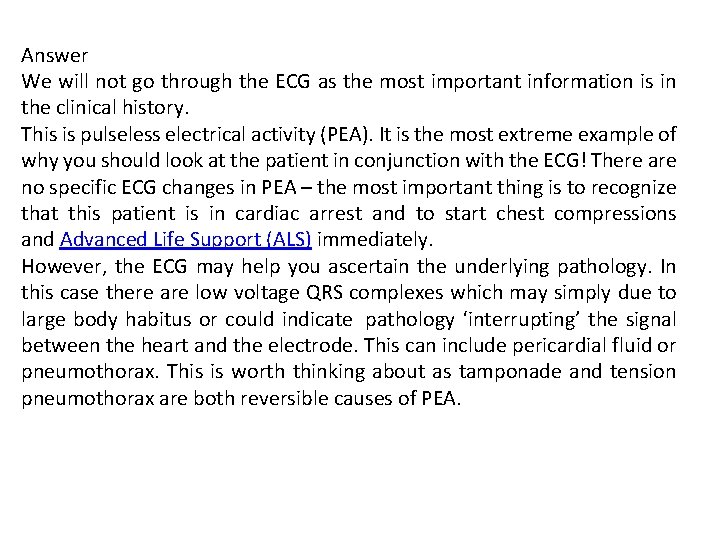
Answer We will not go through the ECG as the most important information is in the clinical history. This is pulseless electrical activity (PEA). It is the most extreme example of why you should look at the patient in conjunction with the ECG! There are no specific ECG changes in PEA – the most important thing is to recognize that this patient is in cardiac arrest and to start chest compressions and Advanced Life Support (ALS) immediately. However, the ECG may help you ascertain the underlying pathology. In this case there are low voltage QRS complexes which may simply due to large body habitus or could indicate pathology ‘interrupting’ the signal between the heart and the electrode. This can include pericardial fluid or pneumothorax. This is worth thinking about as tamponade and tension pneumothorax are both reversible causes of PEA.
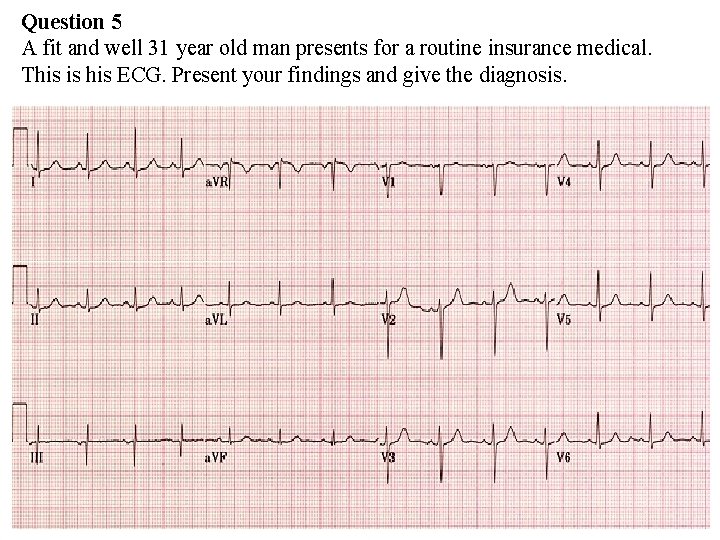
Question 5 A fit and well 31 year old man presents for a routine insurance medical. This is his ECG. Present your findings and give the diagnosis.
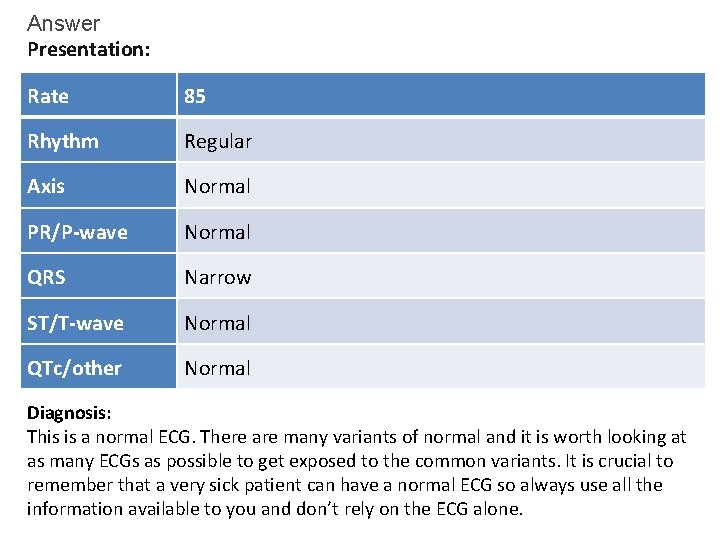
Answer Presentation: Rate 85 Rhythm Regular Axis Normal PR/P-wave Normal QRS Narrow ST/T-wave Normal QTc/other Normal Diagnosis: This is a normal ECG. There are many variants of normal and it is worth looking at as many ECGs as possible to get exposed to the common variants. It is crucial to remember that a very sick patient can have a normal ECG so always use all the information available to you and don’t rely on the ECG alone.
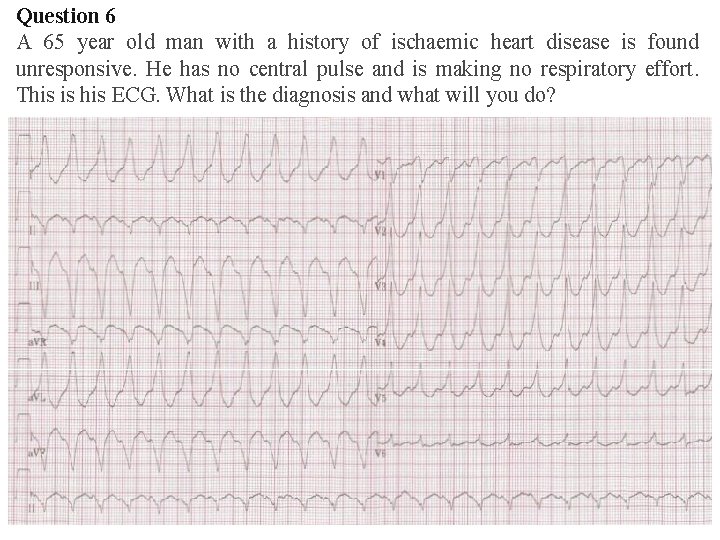
Question 6 A 65 year old man with a history of ischaemic heart disease is found unresponsive. He has no central pulse and is making no respiratory effort. This is his ECG. What is the diagnosis and what will you do?
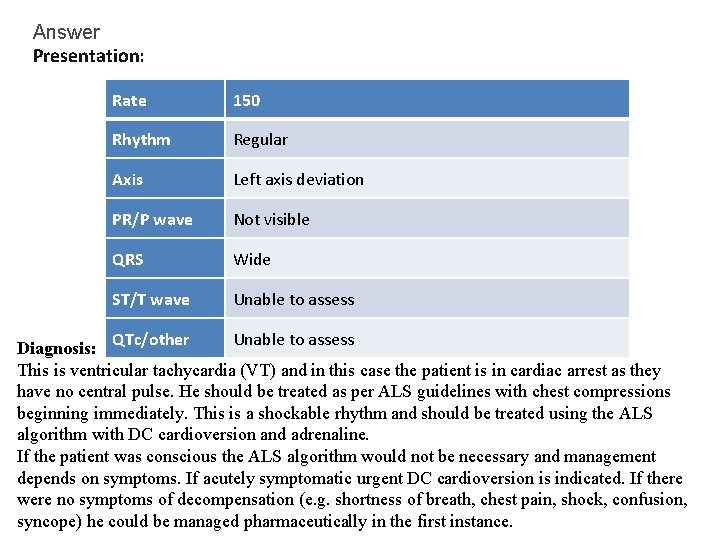
Answer Presentation: Rate 150 Rhythm Regular Axis Left axis deviation PR/P wave Not visible QRS Wide ST/T wave Unable to assess QTc/other Unable to assess Diagnosis: This is ventricular tachycardia (VT) and in this case the patient is in cardiac arrest as they have no central pulse. He should be treated as per ALS guidelines with chest compressions beginning immediately. This is a shockable rhythm and should be treated using the ALS algorithm with DC cardioversion and adrenaline. If the patient was conscious the ALS algorithm would not be necessary and management depends on symptoms. If acutely symptomatic urgent DC cardioversion is indicated. If there were no symptoms of decompensation (e. g. shortness of breath, chest pain, shock, confusion, syncope) he could be managed pharmaceutically in the first instance.
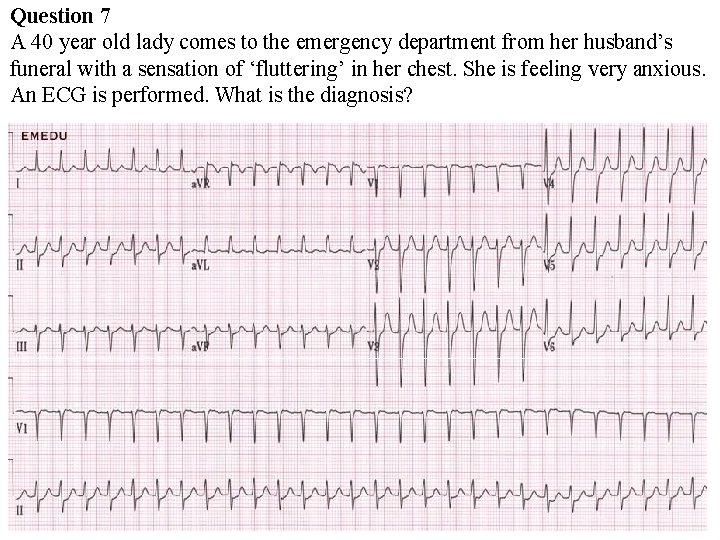
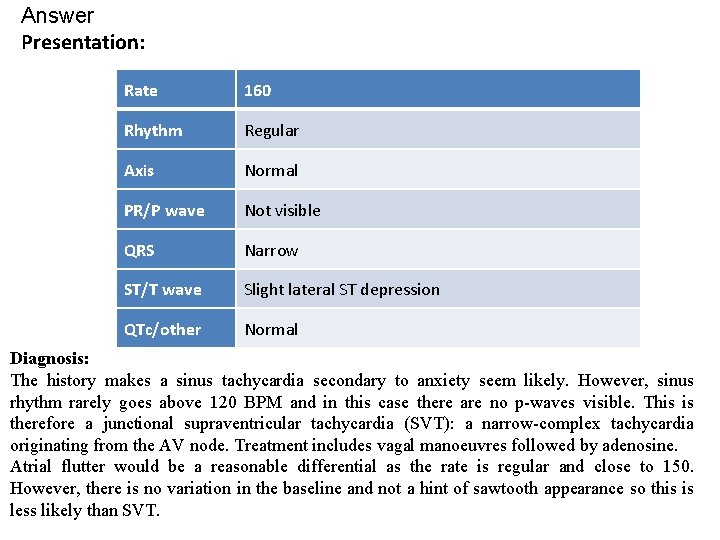
Question 7 A 40 year old lady comes to the emergency department from her husband’s funeral with a sensation of ‘fluttering’ in her chest. She is feeling very anxious. An ECG is performed. What is the diagnosis?
Answer Presentation: Rate 160 Rhythm Regular Axis Normal PR/P wave Not visible QRS Narrow ST/T wave Slight lateral ST depression QTc/other Normal Diagnosis: The history makes a sinus tachycardia secondary to anxiety seem likely. However, sinus rhythm rarely goes above 120 BPM and in this case there are no p-waves visible. This is therefore a junctional supraventricular tachycardia (SVT): a narrow-complex tachycardia originating from the AV node. Treatment includes vagal manoeuvres followed by adenosine. Atrial flutter would be a reasonable differential as the rate is regular and close to 150. However, there is no variation in the baseline and not a hint of sawtooth appearance so this is less likely than SVT.
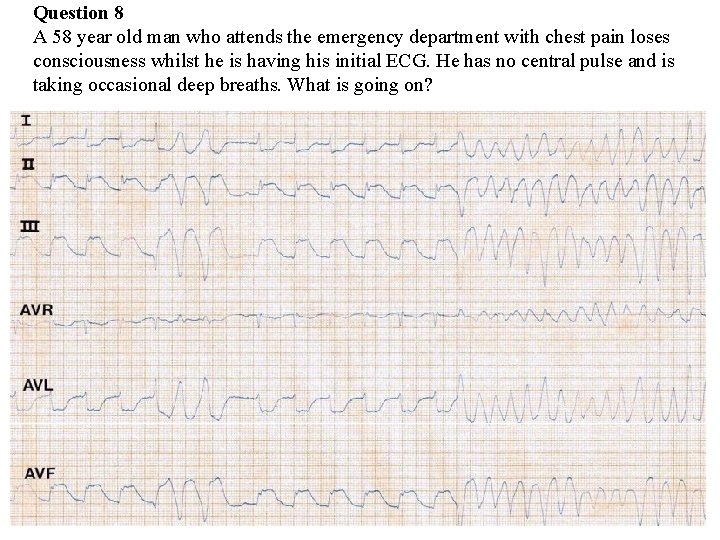
Question 8 A 58 year old man who attends the emergency department with chest pain loses consciousness whilst he is having his initial ECG. He has no central pulse and is taking occasional deep breaths. What is going on?
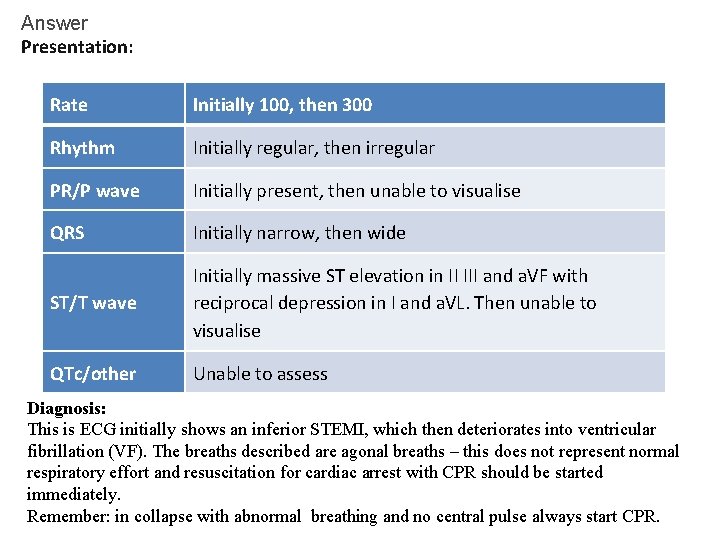
Answer Presentation: Rate Initially 100, then 300 Rhythm Initially regular, then irregular PR/P wave Initially present, then unable to visualise QRS Initially narrow, then wide ST/T wave Initially massive ST elevation in II III and a. VF with reciprocal depression in I and a. VL. Then unable to visualise QTc/other Unable to assess Diagnosis: This is ECG initially shows an inferior STEMI, which then deteriorates into ventricular fibrillation (VF). The breaths described are agonal breaths – this does not represent normal respiratory effort and resuscitation for cardiac arrest with CPR should be started immediately. Remember: in collapse with abnormal breathing and no central pulse always start CPR.
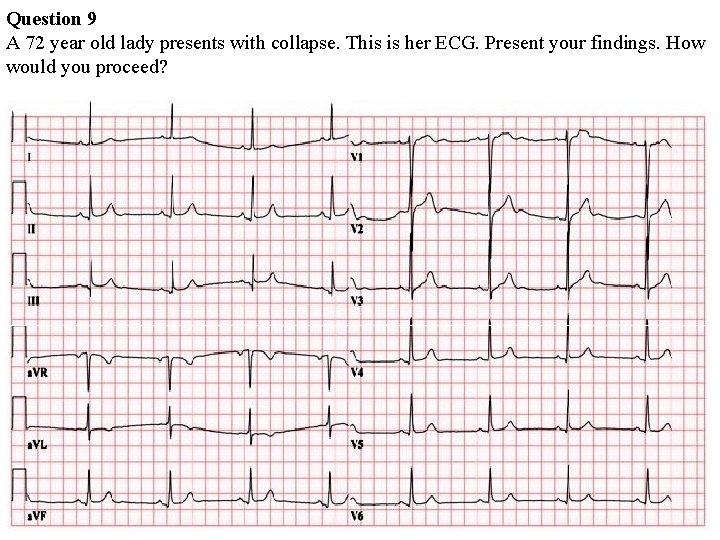
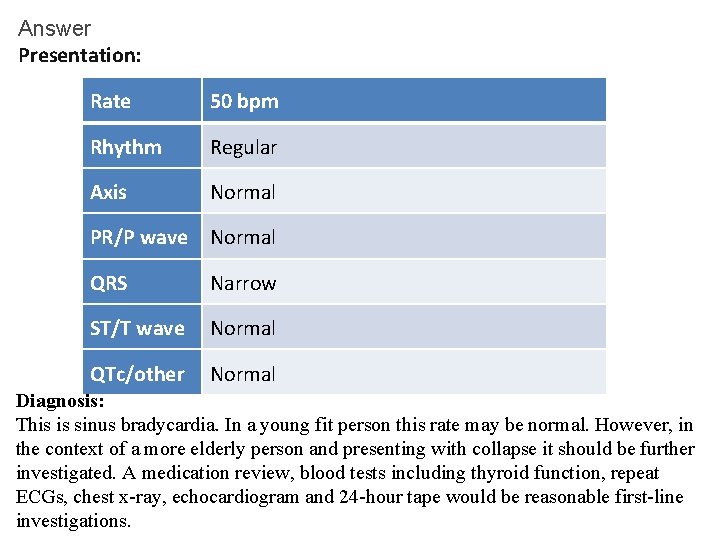
Question 9 A 72 year old lady presents with collapse. This is her ECG. Present your findings. How would you proceed?
Answer Presentation: Rate 50 bpm Rhythm Regular Axis Normal PR/P wave Normal QRS Narrow ST/T wave Normal QTc/other Normal Diagnosis: This is sinus bradycardia. In a young fit person this rate may be normal. However, in the context of a more elderly person and presenting with collapse it should be further investigated. A medication review, blood tests including thyroid function, repeat ECGs, chest x-ray, echocardiogram and 24 -hour tape would be reasonable first-line investigations.
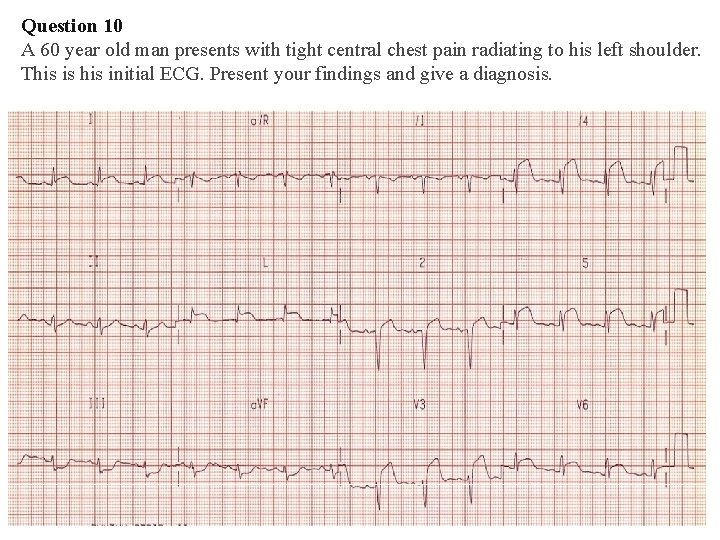
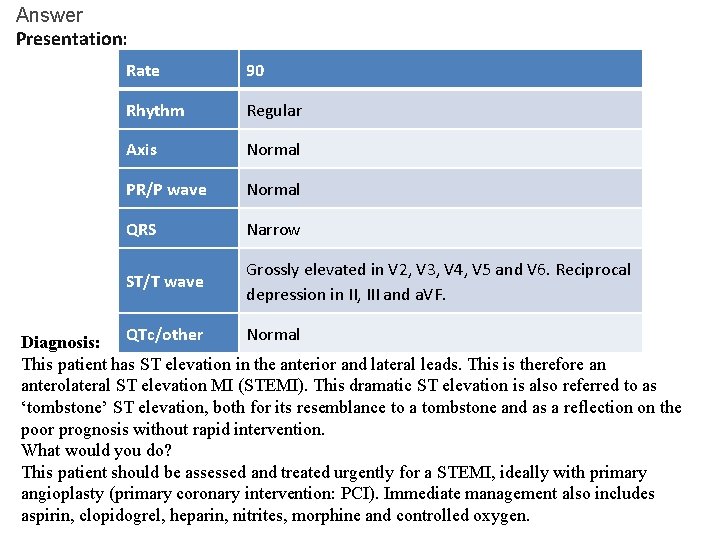
Question 10 A 60 year old man presents with tight central chest pain radiating to his left shoulder. This is his initial ECG. Present your findings and give a diagnosis.
Answer Presentation: Rate 90 Rhythm Regular Axis Normal PR/P wave Normal QRS Narrow ST/T wave Grossly elevated in V 2, V 3, V 4, V 5 and V 6. Reciprocal depression in II, III and a. VF. Normal Diagnosis: QTc/other This patient has ST elevation in the anterior and lateral leads. This is therefore an anterolateral ST elevation MI (STEMI). This dramatic ST elevation is also referred to as ‘tombstone’ ST elevation, both for its resemblance to a tombstone and as a reflection on the poor prognosis without rapid intervention. What would you do? This patient should be assessed and treated urgently for a STEMI, ideally with primary angioplasty (primary coronary intervention: PCI). Immediate management also includes aspirin, clopidogrel, heparin, nitrites, morphine and controlled oxygen.
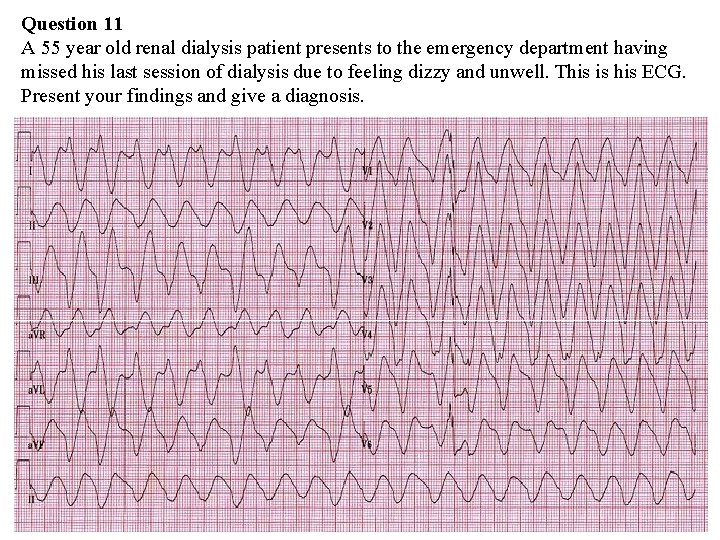
Question 11 A 55 year old renal dialysis patient presents to the emergency department having missed his last session of dialysis due to feeling dizzy and unwell. This is his ECG. Present your findings and give a diagnosis.
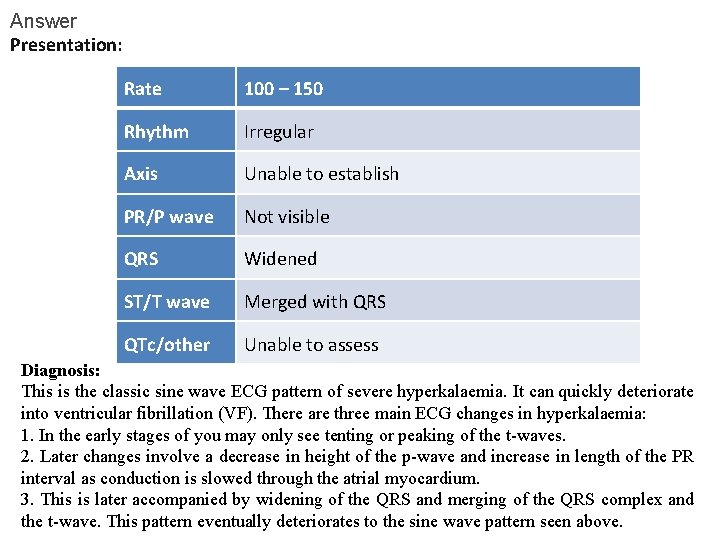
Answer Presentation: Rate 100 – 150 Rhythm Irregular Axis Unable to establish PR/P wave Not visible QRS Widened ST/T wave Merged with QRS QTc/other Unable to assess Diagnosis: This is the classic sine wave ECG pattern of severe hyperkalaemia. It can quickly deteriorate into ventricular fibrillation (VF). There are three main ECG changes in hyperkalaemia: 1. In the early stages of you may only see tenting or peaking of the t-waves. 2. Later changes involve a decrease in height of the p-wave and increase in length of the PR interval as conduction is slowed through the atrial myocardium. 3. This is later accompanied by widening of the QRS and merging of the QRS complex and the t-wave. This pattern eventually deteriorates to the sine wave pattern seen above.
What would you do? This is a medical emergency. Treatment is with 10 ml 10% calcium gluconate for cardioprotection, followed by 10 units of fast acting insulin (with 50 ml 50% dextrose) to drive potassium into the intracellular space. Inhaled salbutamol has a similar effect if there is no IV access. Bicarbonate 50 ml IV can also be given. Ultimately total body potassium needs to be decreased – in this case urgent dialysis or haemofiltration is indicated.
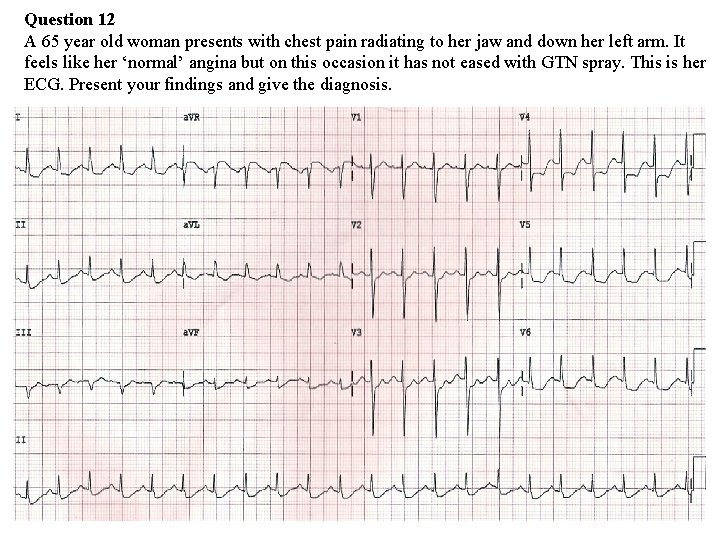
Question 12 A 65 year old woman presents with chest pain radiating to her jaw and down her left arm. It feels like her ‘normal’ angina but on this occasion it has not eased with GTN spray. This is her ECG. Present your findings and give the diagnosis.
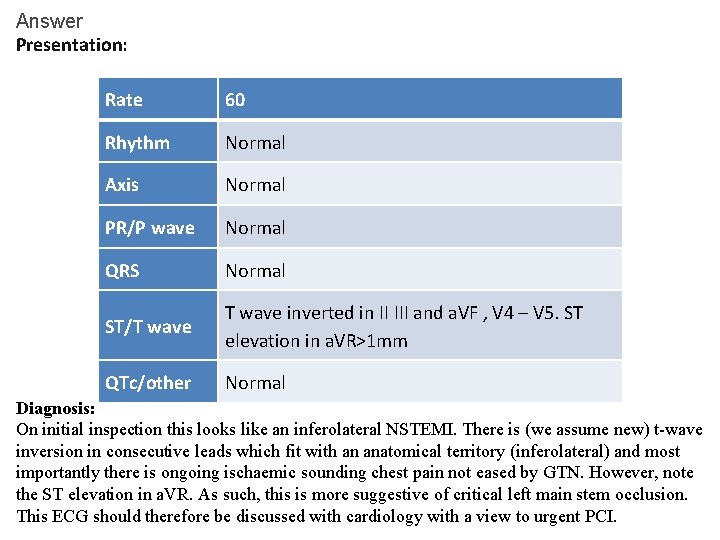
Answer Presentation: Rate 60 Rhythm Normal Axis Normal PR/P wave Normal QRS Normal ST/T wave inverted in II III and a. VF , V 4 – V 5. ST elevation in a. VR>1 mm QTc/other Normal Diagnosis: On initial inspection this looks like an inferolateral NSTEMI. There is (we assume new) t-wave inversion in consecutive leads which fit with an anatomical territory (inferolateral) and most importantly there is ongoing ischaemic sounding chest pain not eased by GTN. However, note the ST elevation in a. VR. As such, this is more suggestive of critical left main stem occlusion. This ECG should therefore be discussed with cardiology with a view to urgent PCI.
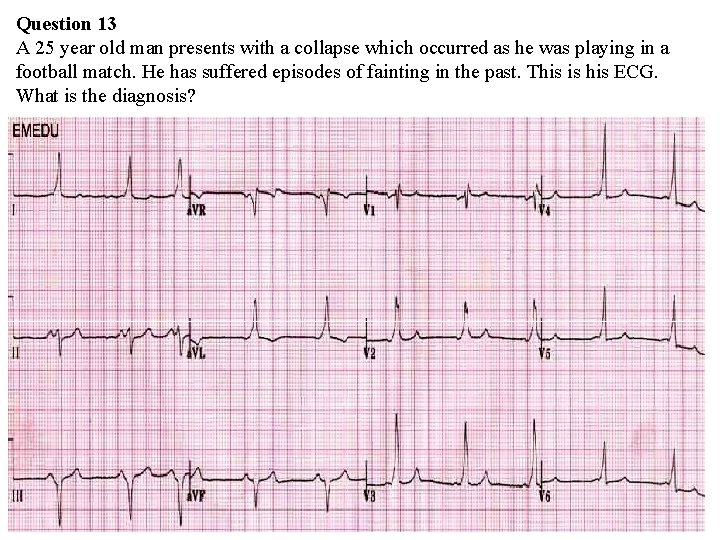
Question 13 A 25 year old man presents with a collapse which occurred as he was playing in a football match. He has suffered episodes of fainting in the past. This is his ECG. What is the diagnosis?
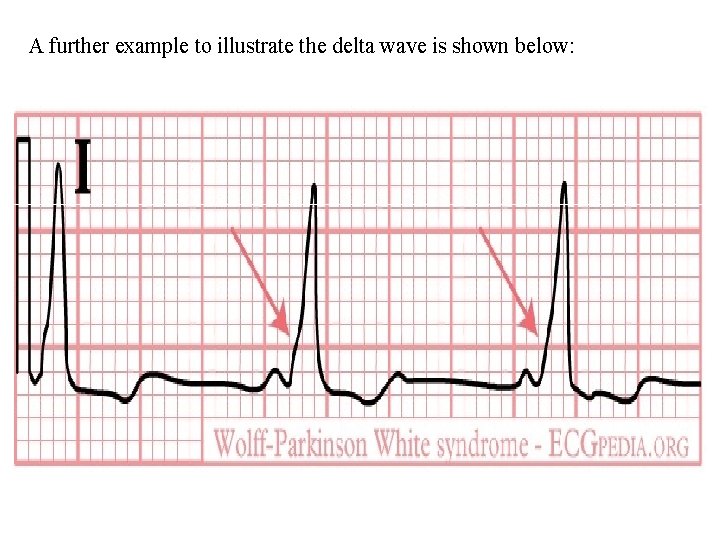
Answer Presentation: Rate 60 Rhythm Regular Axis Normal PR/P wave Shortened PR interval QRS ‘Slurred’ upstroke on QRS ST/T wave Normal QTc/other Normal Diagnosis: This picture of shortened PR interval and slurred QRS upstroke – also know as a ‘delta wave’ – are typical of Wolff-Parkinson White (WPW) syndrome. These changes represent transmission through an accessory pathway. The history of collapse in this case is concerning as these episodes could be due to re-entrant tachycardias which can be fatal. Other features not seen here which may be present in WPW include a dominant R wave in V 1 and T wave inversion in the anterior chest leads.
A further example to illustrate the delta wave is shown below:
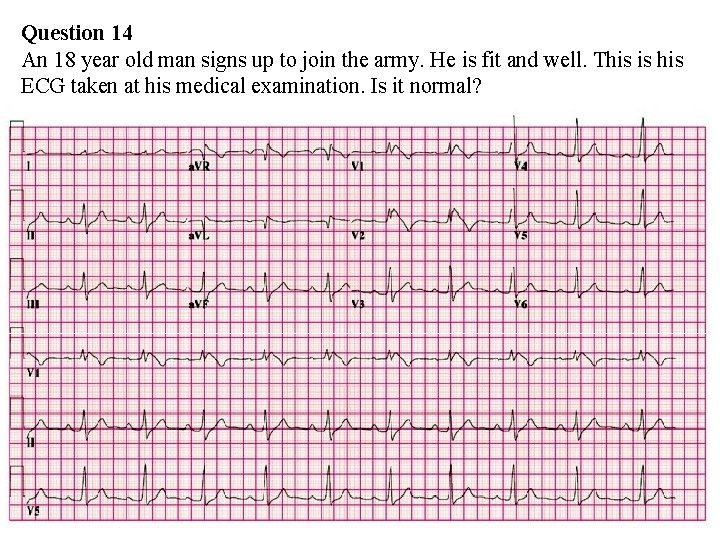
Question 14 An 18 year old man signs up to join the army. He is fit and well. This is his ECG taken at his medical examination. Is it normal?
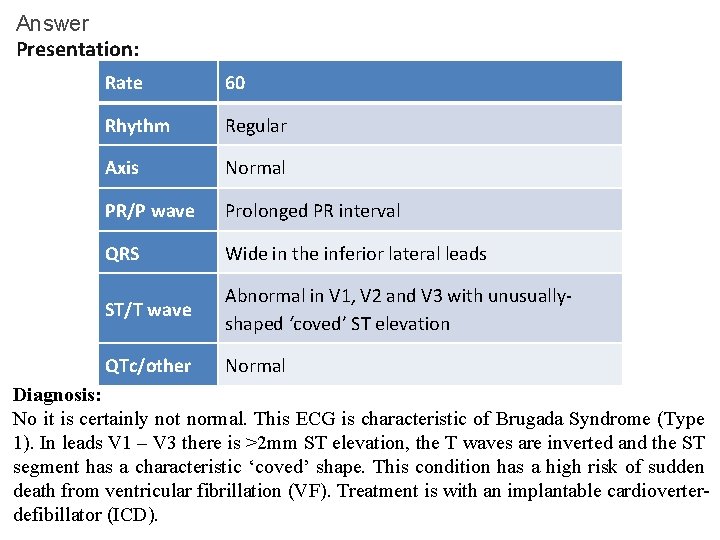
Answer Presentation: Rate 60 Rhythm Regular Axis Normal PR/P wave Prolonged PR interval QRS Wide in the inferior lateral leads ST/T wave Abnormal in V 1, V 2 and V 3 with unusuallyshaped ‘coved’ ST elevation QTc/other Normal Diagnosis: No it is certainly not normal. This ECG is characteristic of Brugada Syndrome (Type 1). In leads V 1 – V 3 there is >2 mm ST elevation, the T waves are inverted and the ST segment has a characteristic ‘coved’ shape. This condition has a high risk of sudden death from ventricular fibrillation (VF). Treatment is with an implantable cardioverterdefibillator (ICD).
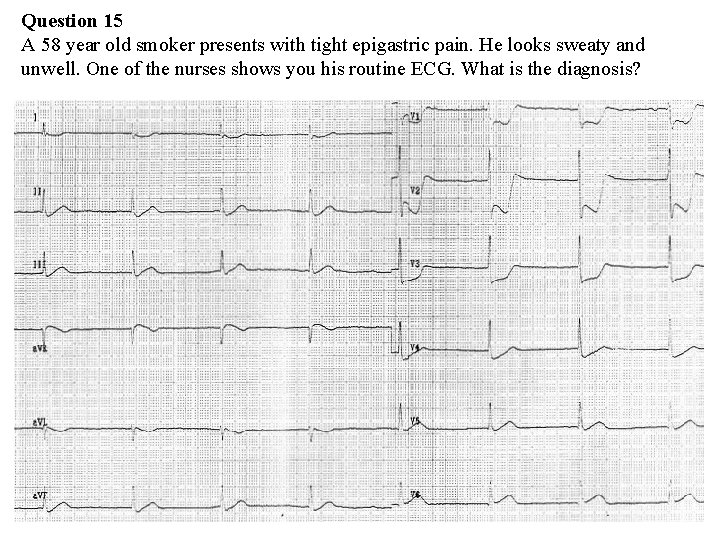
Question 15 A 58 year old smoker presents with tight epigastric pain. He looks sweaty and unwell. One of the nurses shows you his routine ECG. What is the diagnosis?
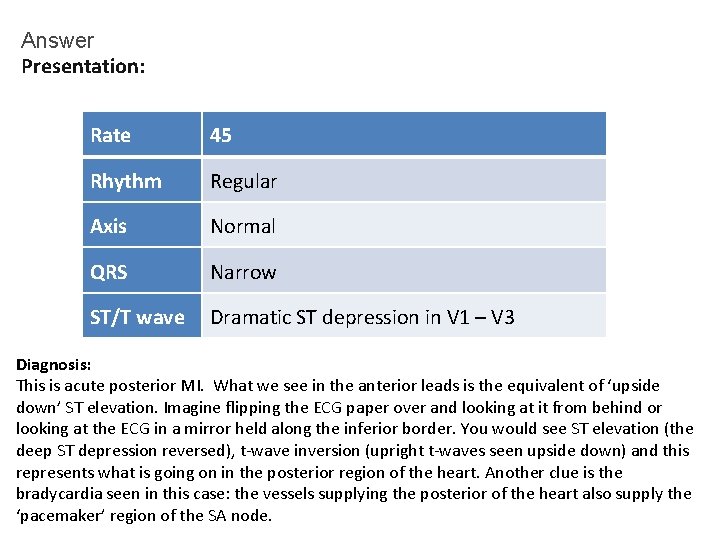
Answer Presentation: Rate 45 Rhythm Regular Axis Normal QRS Narrow ST/T wave Dramatic ST depression in V 1 – V 3 Diagnosis: This is acute posterior MI. What we see in the anterior leads is the equivalent of ‘upside down’ ST elevation. Imagine flipping the ECG paper over and looking at it from behind or looking at the ECG in a mirror held along the inferior border. You would see ST elevation (the deep ST depression reversed), t-wave inversion (upright t-waves seen upside down) and this represents what is going on in the posterior region of the heart. Another clue is the bradycardia seen in this case: the vessels supplying the posterior of the heart also supply the ‘pacemaker’ region of the SA node.
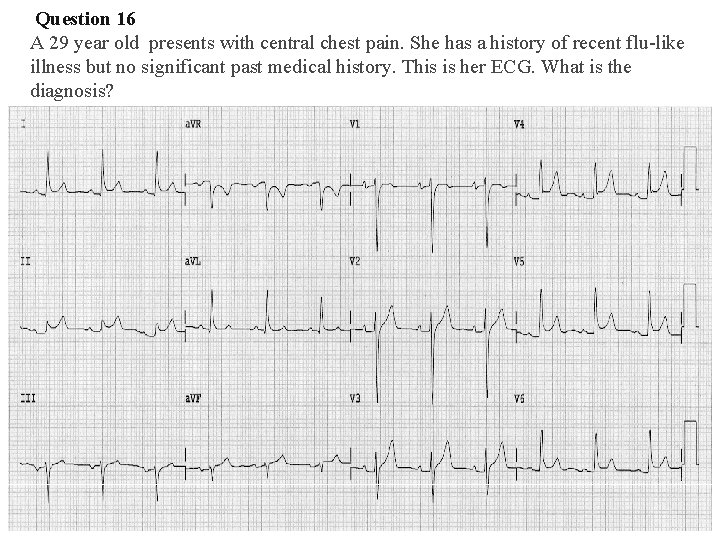
Question 16 A 29 year old presents with central chest pain. She has a history of recent flu-like illness but no significant past medical history. This is her ECG. What is the diagnosis?
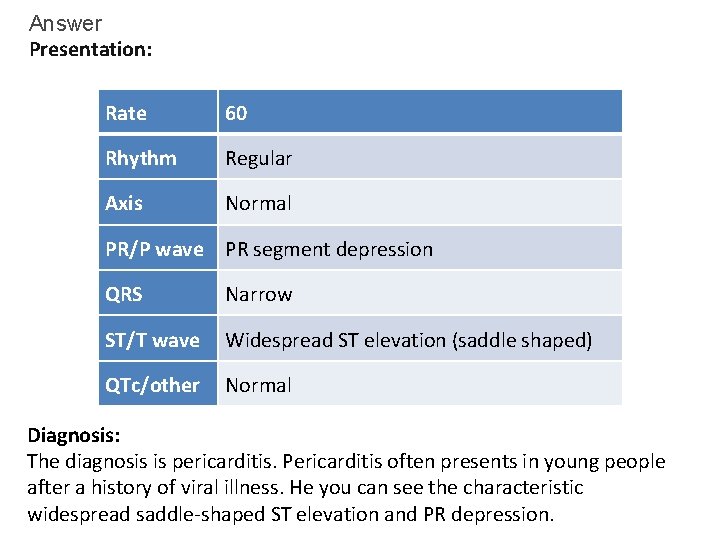
Answer Presentation: Rate 60 Rhythm Regular Axis Normal PR/P wave PR segment depression QRS Narrow ST/T wave Widespread ST elevation (saddle shaped) QTc/other Normal Diagnosis: The diagnosis is pericarditis. Pericarditis often presents in young people after a history of viral illness. He you can see the characteristic widespread saddle-shaped ST elevation and PR depression.
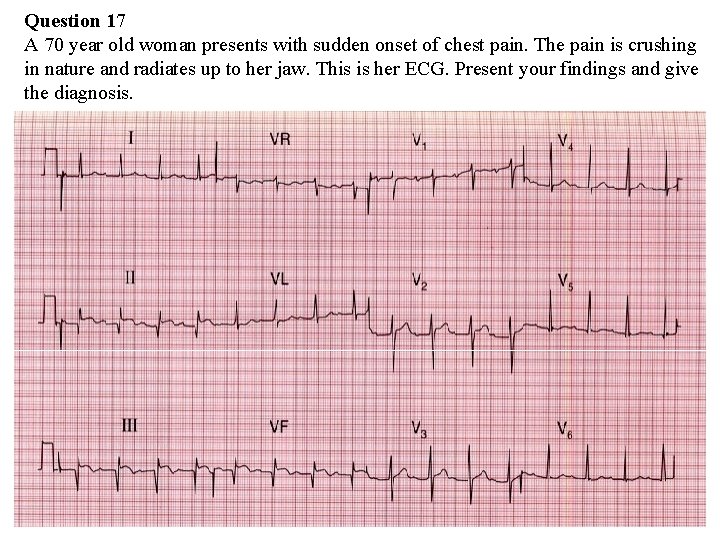
Question 17 A 70 year old woman presents with sudden onset of chest pain. The pain is crushing in nature and radiates up to her jaw. This is her ECG. Present your findings and give the diagnosis.
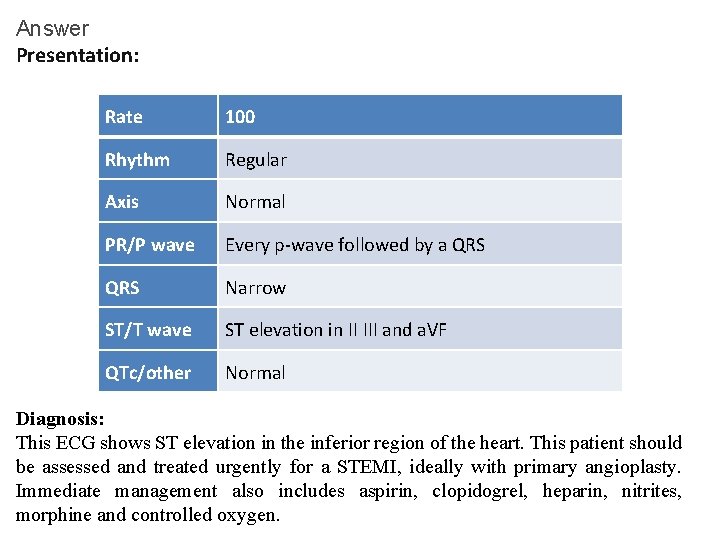
Answer Presentation: Rate 100 Rhythm Regular Axis Normal PR/P wave Every p-wave followed by a QRS Narrow ST/T wave ST elevation in II III and a. VF QTc/other Normal Diagnosis: This ECG shows ST elevation in the inferior region of the heart. This patient should be assessed and treated urgently for a STEMI, ideally with primary angioplasty. Immediate management also includes aspirin, clopidogrel, heparin, nitrites, morphine and controlled oxygen.
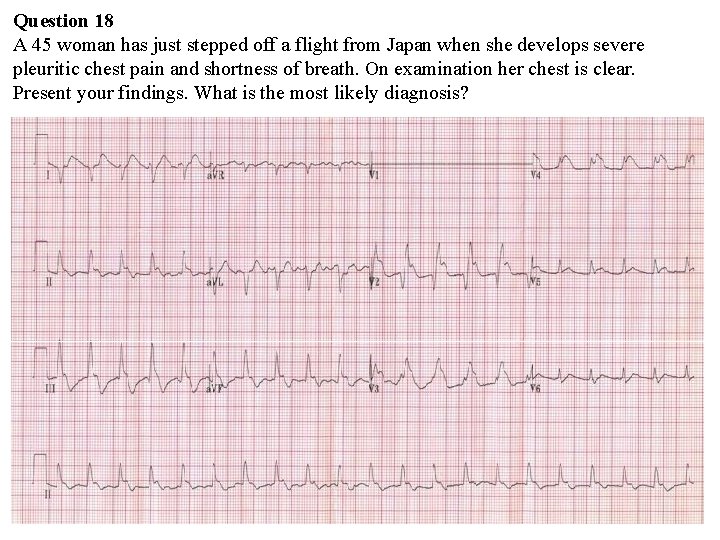
Question 18 A 45 woman has just stepped off a flight from Japan when she develops severe pleuritic chest pain and shortness of breath. On examination her chest is clear. Present your findings. What is the most likely diagnosis?
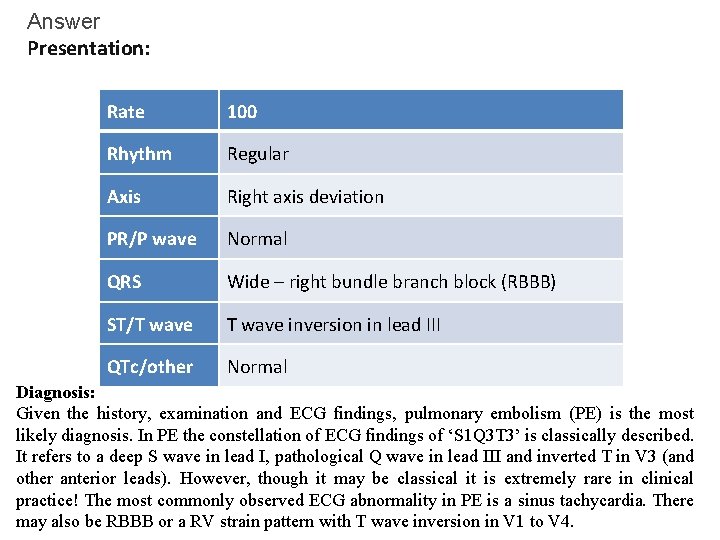
Answer Presentation: Rate 100 Rhythm Regular Axis Right axis deviation PR/P wave Normal QRS Wide – right bundle branch block (RBBB) ST/T wave inversion in lead III QTc/other Normal Diagnosis: Given the history, examination and ECG findings, pulmonary embolism (PE) is the most likely diagnosis. In PE the constellation of ECG findings of ‘S 1 Q 3 T 3’ is classically described. It refers to a deep S wave in lead I, pathological Q wave in lead III and inverted T in V 3 (and other anterior leads). However, though it may be classical it is extremely rare in clinical practice! The most commonly observed ECG abnormality in PE is a sinus tachycardia. There may also be RBBB or a RV strain pattern with T wave inversion in V 1 to V 4.
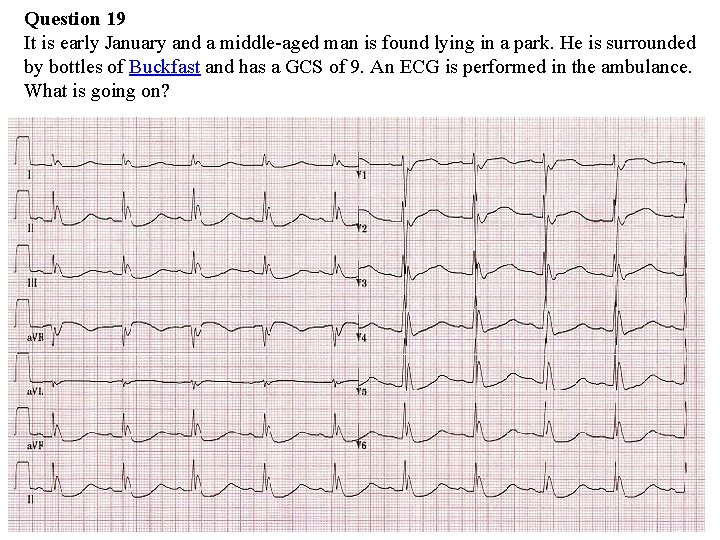
Question 19 It is early January and a middle-aged man is found lying in a park. He is surrounded by bottles of Buckfast and has a GCS of 9. An ECG is performed in the ambulance. What is going on?
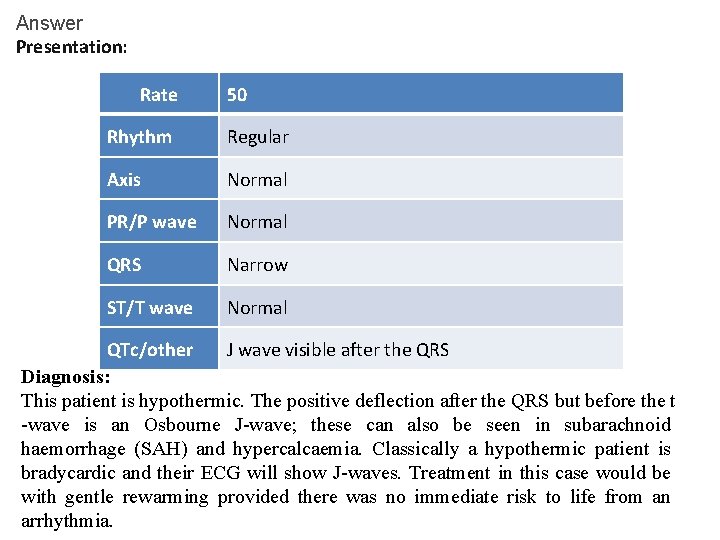
Answer Presentation: Rate 50 Rhythm Regular Axis Normal PR/P wave Normal QRS Narrow ST/T wave Normal QTc/other J wave visible after the QRS Diagnosis: This patient is hypothermic. The positive deflection after the QRS but before the t -wave is an Osbourne J-wave; these can also be seen in subarachnoid haemorrhage (SAH) and hypercalcaemia. Classically a hypothermic patient is bradycardic and their ECG will show J-waves. Treatment in this case would be with gentle rewarming provided there was no immediate risk to life from an arrhythmia.
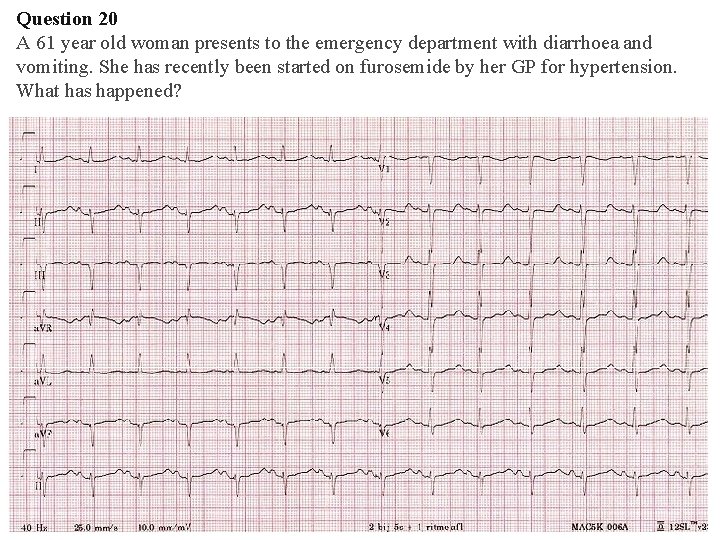
Question 20 A 61 year old woman presents to the emergency department with diarrhoea and vomiting. She has recently been started on furosemide by her GP for hypertension. What has happened?
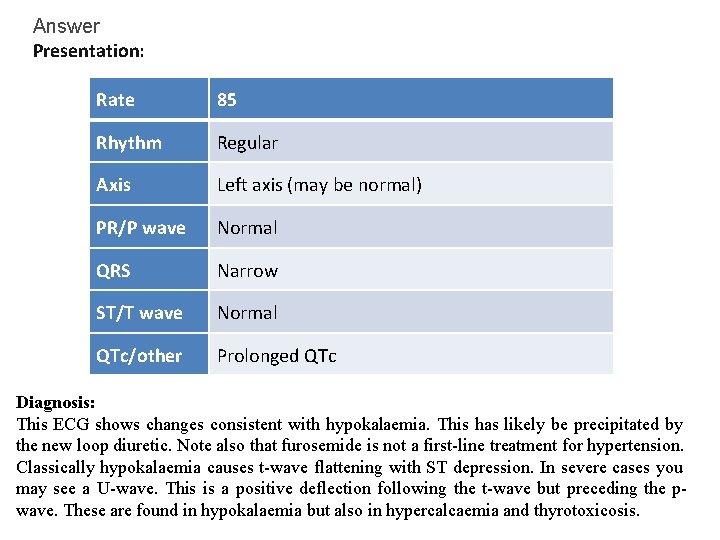
Answer Presentation: Rate 85 Rhythm Regular Axis Left axis (may be normal) PR/P wave Normal QRS Narrow ST/T wave Normal QTc/other Prolonged QTc Diagnosis: This ECG shows changes consistent with hypokalaemia. This has likely be precipitated by the new loop diuretic. Note also that furosemide is not a first-line treatment for hypertension. Classically hypokalaemia causes t-wave flattening with ST depression. In severe cases you may see a U-wave. This is a positive deflection following the t-wave but preceding the pwave. These are found in hypokalaemia but also in hypercalcaemia and thyrotoxicosis.
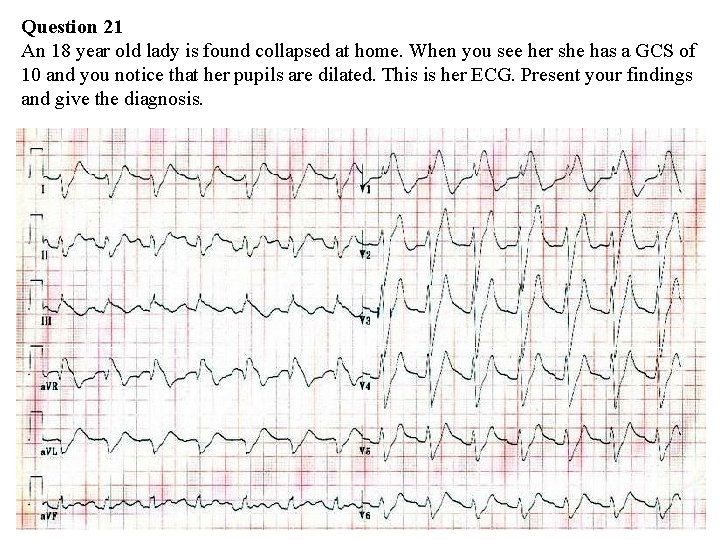
Question 21 An 18 year old lady is found collapsed at home. When you see her she has a GCS of 10 and you notice that her pupils are dilated. This is her ECG. Present your findings and give the diagnosis.
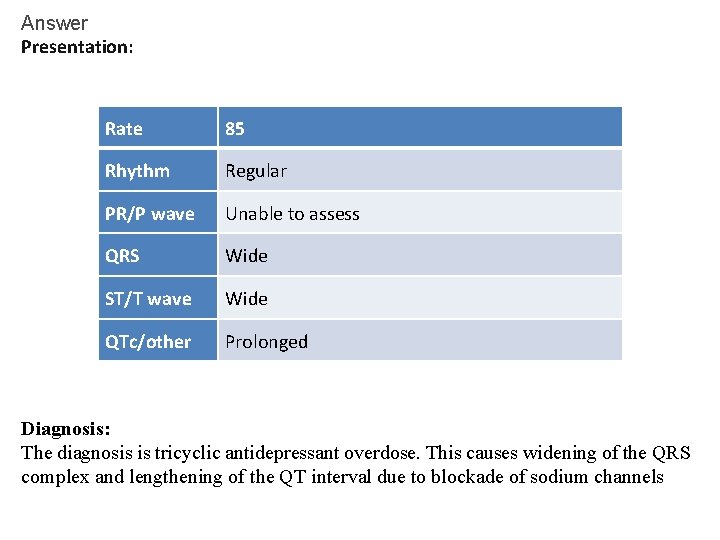
Answer Presentation: Rate 85 Rhythm Regular PR/P wave Unable to assess QRS Wide ST/T wave Wide QTc/other Prolonged Diagnosis: The diagnosis is tricyclic antidepressant overdose. This causes widening of the QRS complex and lengthening of the QT interval due to blockade of sodium channels
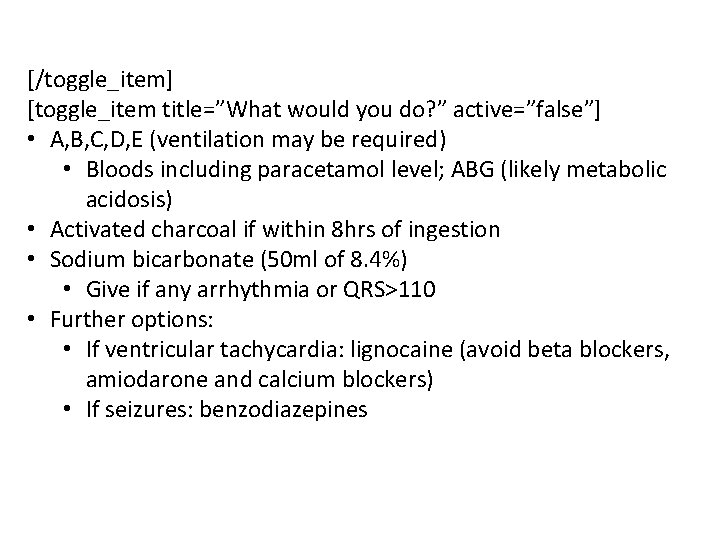
[/toggle_item] [toggle_item title=”What would you do? ” active=”false”] • A, B, C, D, E (ventilation may be required) • Bloods including paracetamol level; ABG (likely metabolic acidosis) • Activated charcoal if within 8 hrs of ingestion • Sodium bicarbonate (50 ml of 8. 4%) • Give if any arrhythmia or QRS>110 • Further options: • If ventricular tachycardia: lignocaine (avoid beta blockers, amiodarone and calcium blockers) • If seizures: benzodiazepines
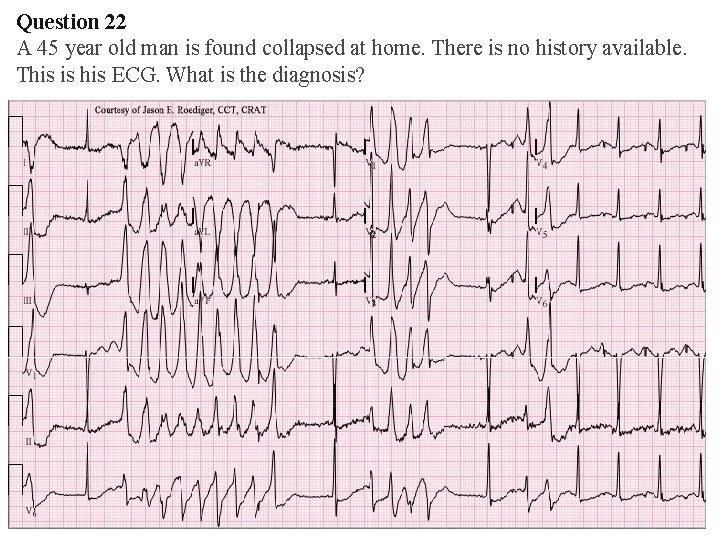
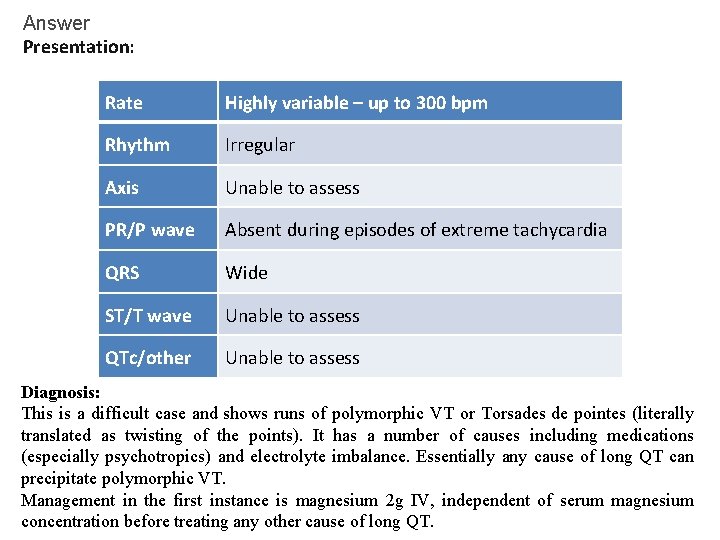
Question 22 A 45 year old man is found collapsed at home. There is no history available. This is his ECG. What is the diagnosis?
Answer Presentation: Rate Highly variable – up to 300 bpm Rhythm Irregular Axis Unable to assess PR/P wave Absent during episodes of extreme tachycardia QRS Wide ST/T wave Unable to assess QTc/other Unable to assess Diagnosis: This is a difficult case and shows runs of polymorphic VT or Torsades de pointes (literally translated as twisting of the points). It has a number of causes including medications (especially psychotropics) and electrolyte imbalance. Essentially any cause of long QT can precipitate polymorphic VT. Management in the first instance is magnesium 2 g IV, independent of serum magnesium concentration before treating any other cause of long QT.
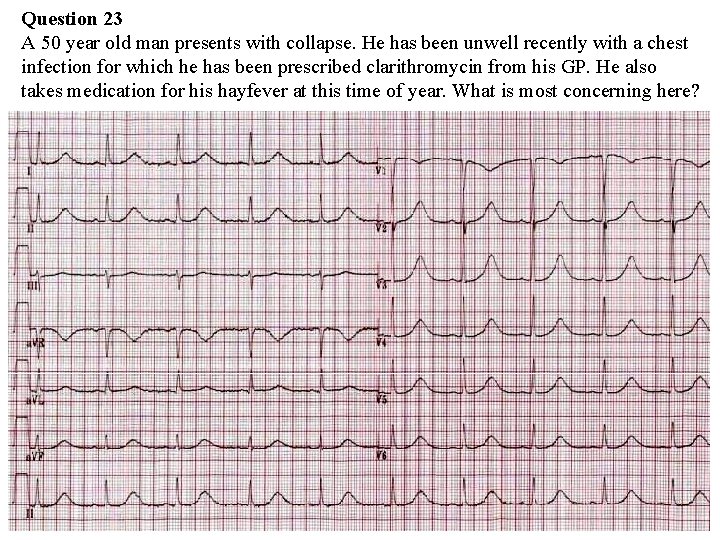
Question 23 A 50 year old man presents with collapse. He has been unwell recently with a chest infection for which he has been prescribed clarithromycin from his GP. He also takes medication for his hayfever at this time of year. What is most concerning here?
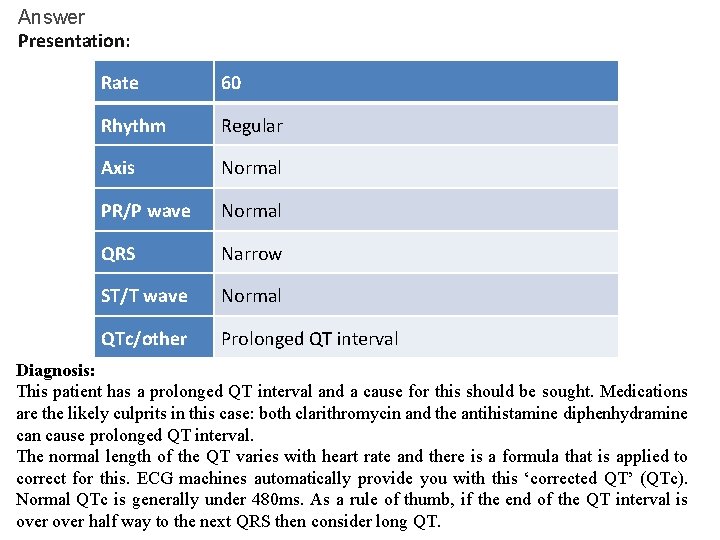
Answer Presentation: Rate 60 Rhythm Regular Axis Normal PR/P wave Normal QRS Narrow ST/T wave Normal QTc/other Prolonged QT interval Diagnosis: This patient has a prolonged QT interval and a cause for this should be sought. Medications are the likely culprits in this case: both clarithromycin and the antihistamine diphenhydramine can cause prolonged QT interval. The normal length of the QT varies with heart rate and there is a formula that is applied to correct for this. ECG machines automatically provide you with this ‘corrected QT’ (QTc). Normal QTc is generally under 480 ms. As a rule of thumb, if the end of the QT interval is over half way to the next QRS then consider long QT.