ECG and Arrhythmia 24 12 leads ECG SangHoon


 (+) (-) (+)")

, 30 mm(Precordial) 4 LVH 1 V 6 3 2")
, 5/7/9 mm(Precordial) Low Voltage QRS If decreased m mass")


 Preceding")
 ↑ 1 mm")

 ↑ 1 mm")

 Myocardial Infarction")

")

 Upward convex( ) ST elevation")
 Upward convex ST elevation( ) T-inversion( )")
 Q wave ( ) Inferior STEMI")
")


 (2) (3)")

 2) 3) Dia")


 sinus")


- Slides: 65
ECG and Arrhythmia - 2/4 12 leads ECG- Sang-Hoon Na
12 Leads ECG I a. VR V 1 V 4 II a. VL V 2 V 5 III a. VF V 3 V 6
Normal ECG
Standard 12 Lead ECG
12 Lead ECG record
Role of Conduction System
12 lead ECG Limb leads I a. VR II III Precordial leads V 1 V 4 a. VL V 2 V 5 a. VF V 3 V 6 Rhythm strip: 300 150 100 75 6050 43
Standard 12 lead ECG 25 mm/sec 1 mv/10 mm 10 sec !!
Pre Interpretation Validation : 3 step o Identifiction ! o Is The Clibration mark standard ? o Is the Net vetor of a. VR negative ?
Pre Interpretation Validation 5 mm width: 25 mm/sec 10 mm height : 1 mv/10 mm 10 sec !!
a. VR : All Negative Wave? Limb Leads Chest Leads I - a. VR V 1 V 4 II a. VL V 2 V 5 III a. VF V 3 V 6 Rhythm Strip
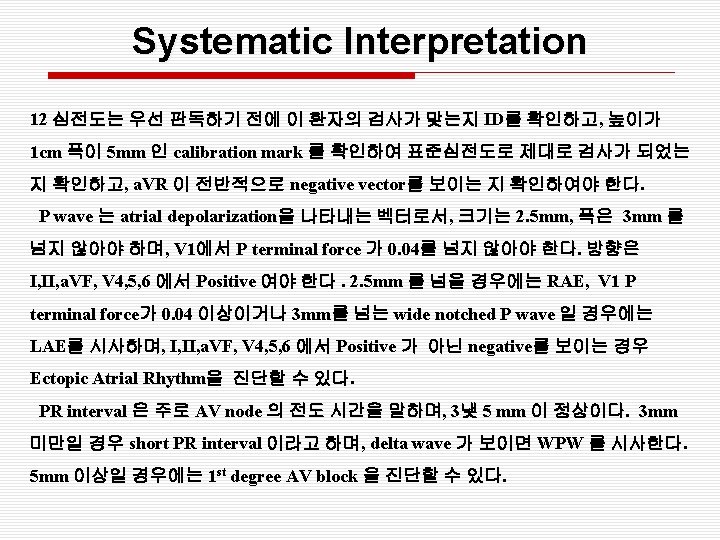
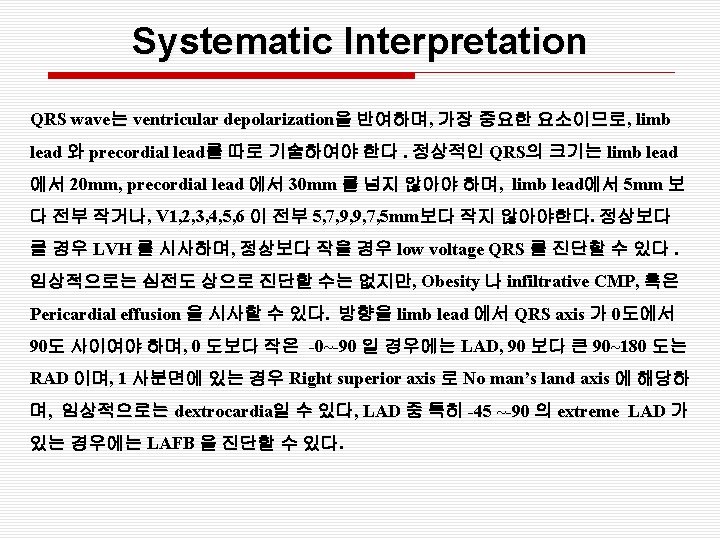
Systematic Interpretation o P wave Atrial Depolarization o PR interval AV nodal conduction time o QRS wave Ventrcular Depolarization : limb leads and precordial leads o ST segment Ventrcular Repolarization o T wave Ventrcular Repolarization
Systematic Interpretation o P wave Atrial Depolarization o PR interval AV nodal conduction time o QRS wave Ventrcular Depolarization : limb leads and precordial leads o ST segment Ventrcular Repolarization o T wave Ventrcular Repolarization
P wave Size: 2. 5 x 3, PR : 3~5 Limb Leads I - a. VR Chest Leads V 1 V 4 1 3 III mm mm a. VL V 2 V 5 a. VF V 3 V 6 2. 5 mm II mm 1 Rhythm Strip
Normal P wave Size: 2. 5 mm x 3 mm 2 1 V 1 II
P wave Height > 2. 5 mm 2 1 II P height > 2. 5 mm V 1 RAE
P wave Width > 3 mm 2 1 V 1 II V 1 P terminal force > 0. 04 or II wide notched P LAE
P wave : Positive, Negative Limb Leads Chest Leads I - a. VR V 1 V 4 II a. VL V 2 V 5 III a. VF V 3 V 6 Rhythm Strip
P wave Vector direction 1 2 II Abnormal P axis V 1 Ectopic Atrial Rhythm
Systematic Interpretation o P wave Atrial Depolarization o PR interval AV nodal conduction time o QRS wave Ventrcular Depolarization : limb leads and precordial leads o ST segment Ventrcular Repolarization o T wave Ventrcular Repolarization
PR interval : AV nodal conduction time PR< 3 mm Short PR ex>WPW Sd, LGL Sd 3~ 5 mm PR >5 mm 1 st degree AV block
Systematic Interpretation o P wave Atrial Depolarization o PR interval AV nodal conduction time o QRS wave Ventrcular Depolarization : limb leads and precordial leads o ST segment Ventrcular Repolarization o T wave Ventrcular Repolarization
“LEAD”ing of QRS axis: Limb Leads Chest Leads I - a. VR II a. VL q(+) III q(+) a. VF q(+) Equiphasic V 1 V 4 V 2 max. S V 5 V 3 Rhythm Strip q(+) V 6 q(+) R max
QRS axis in “Limb leads” +180 ~+360 or -90 ~ -180 Right Superior Axis (No man’s land) 0 ~ - 90 LAD If -45~-90 LAFB +90 ~+180 RAD 0 ~ +90 Normal axis
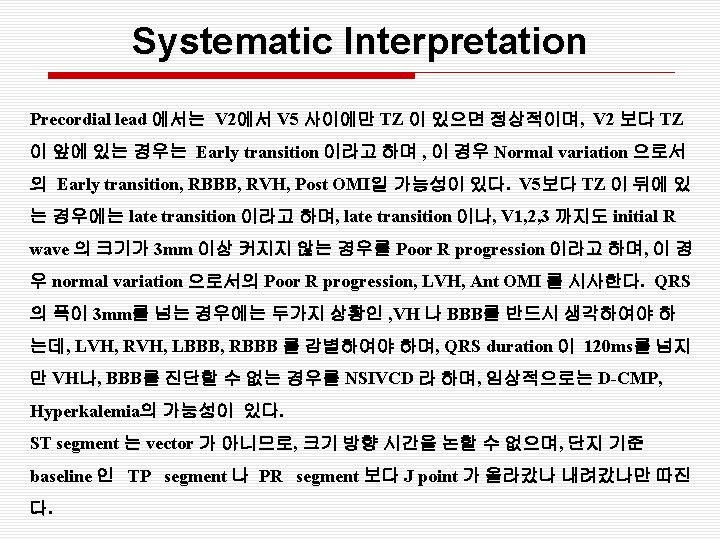
QRS axis in “Precordial” V 2 ~ V 5 Normal Transition V 1 V 2 Zero V 3 V 4 V 5 V 6 “TZ” ~ V 2 Early Transition V 5 ~ Late Transition 1. Early transition (Normal variation) 2. RBBB (if rs. R’) 3. RVH (if Increased R/S ratio and RAD+) 4. Post OMI (if Increased R/S ratio and No RAD, old age Cf> Poor R progression 1. Normal 2. LVH 3. OMI
QRS axis in “Limb leads” (+) (+) (-) (+)
QRS size: All lower, Any upper Limb Leads I II Chest Leads 20 - a. VR 5 20 5 5 III 20 5 20 a. VL 20 5 a. VF 20 5 V 1 V 2 V 3 30 5 30 7 30 9 Rhythm Strip V 4 30 9 V 5 V 6 30 7 30 5
QRS voltage > 20 mm(Limb), 30 mm(Precordial) 4 LVH 1 V 6 3 2 V 1 Deep wide S Tall wide R 1. Volatage 2. LAD 3. QRS>120 ms(>3 mm) 4. LAE 5. Strain ST-T change
QRS voltage < 5 mm(Limb), 5/7/9 mm(Precordial) Low Voltage QRS If decreased m mass = infiltrative disease (Hypothyroidism) (Amylodosis) If increased lead-to-cardiac muscle distance (Obesity) (Pericardial effusion) cf. Electrical alterance
QRS duration > 120 ms or 3 mm LVH RBBB LBBB if V 5~6 R tall-wide, LAD if V 1~2 R tall-wide, RAD VH ? BBB ? if V 1 rs. R’, V 6 slured S if V 1 deep S, V 6 wide-notched
V 1 LBBB Normal V 1 V 6 LVH RBBB r. SR’ Normal V 1 RBBB slurred S Deep wide S V 6 LBBB Wide notched R wave deep wide S V 6 LVH Tall Wide R wave
QRS duration > 120 ms or 3 mm LVH RBBB LBBB if V 5~6 R tall-wide, LAD if V 1~2 R tall-wide, RAD VH ? BBB ? if V 1 rs. R’, V 6 slured S if V 1 deep S, V 6 wide-notched if no mathed criteria BBB or VH NIVCD
Systematic Interpretation o P wave Atrial Depolarization o PR interval AV nodal conduction time o QRS wave Ventrcular Depolarization : limb leads and precordial leads o ST segment Ventrcular Repolarization o T wave Ventrcular Repolarization
T wave : Positive, Negative Limb Leads Chest Leads I - a. VR V 1 V 4 II a. VL V 2 V 5 III a. VF V 3 V 6 Rhythm Strip
T wave Height Q> Which one is Normal T wave ? A> (2) Preceding QRS height 1/2 ~ 1/4 (1) (2) (3)
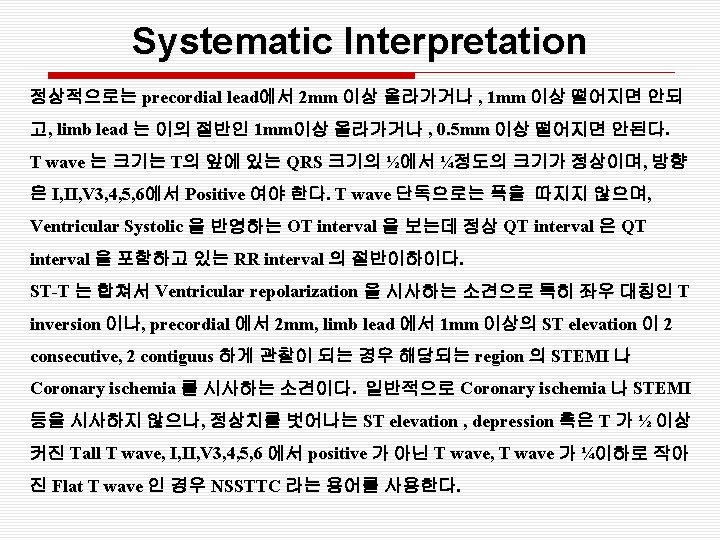
ST segment : ↑ 2 mm ~ ↓ 1 mm (precordial) ↑ 1 mm ~ ↓ 0. 5 mm (limb) (1) (2) (3) (4) ↑ 1. 5 mm ↓ 1. 5 mm ↑ 1. 5 mm ? ↑ 많이 ?
ST segment at “J” point
ST segment : ↑ 2 mm ~ ↓ 1 mm (precordial) ↑ 1 mm ~ ↓ 0. 5 mm (limb) (1) (2) (3) (4) ↑ 1. 5 mm ↓ 1. 5 mm ↑ 1. 5 mm ? ↑ 2. 5 mm
ECG finding of ACS/STEMI o ECG finding favoring AMI/Angina n ST segment elevation/depression o o Upward Convex elevation +/- receiprocal change More 2 consecutive leads Symmetrical deep T-inversion Dynamic ST-T change n pathologic Q wave o Q wave duration > 0. 04 sec(1 mm) o Q wave amplitude > ¼ of QRS o Any Q wave in V 1~2 precordial leads n Intraventricular conduction disturbance o RBBB o LBBB Most Important Finding ? : New-onset !!!
Accuracy of Chest pain Dx : Myocardial Infarction Diagnosis (Overall Outpatient probability) Myocardial Infarction (2%) Heart failure (2 %) Probability of Dx(%) If finding is. . Clinical finding Present Absent New ST elevation 25 1 New Q wave 15 1 New Conduction defect 11 2 Any ST segment elevation 18 1 Any Q wave 7 1 Any Conduction defect 5 2 New T-wave inversion Troponin T >2 ng/m. L at least 8 hours from Sx presentation Troponin T >1 ng/m. L at least 6 hours from Sx presentation 5 1 10 <1 27 <1 44 1 7 <1 Abnormal ECG Abnormal BNP level( > 80 pg/m. L)
Leads group I a. VR V 1 V 4 II a. VL V 2 V 5 III a. VF V 3 V 6
Early Repolarization Upward concave Diffuse elevation Prominent J point ( )
Coronary T inversion V 6 LVH Ischemic Symmetrical T inversion
Anterior STEMI Receiprocal ST depression( ) Upward convex( ) ST elevation
Anterior OMI No Receiprocal ST depression( ) Upward convex ST elevation( ) T-inversion( ) Q wave ( )
Upward Convex ST elevation ( ) Q wave ( ) Inferior STEMI
ST elevation Early Repolarization Inferioir STEMI Anterior STEMI Upward Convex ST elevation ( ) Upward concave Diffuse elevation Prominent J point( ) Q wave ( ) Upward convex( ) ST elevation
Systematic Interpretation o P wave Always 2 x 2 Atrial Depolarization o PR interval AV nodal conduction time QRS wave 2 o cosecutive and 2 contiguous : limb leads and. Ventrcular precordial Depolarization leads o ST segment Ventrcular Repolarization o T wave Ventrcular Repolarization
> 2 contiguous I a. VR V 1 V 4 II a. VL V 2 V 5 III a. VF V 3 V 6
T wave : Positive, Negative Limb Leads Chest Leads I - a. VR V 1 V 4 II a. VL V 2 V 5 III a. VF V 3 V 6 Rhythm Strip
T wave Height Preceding QRS height 1/2 ~ 1/4 (1) (2) (3)
T wave duration? QT ECG LV pressure Sys Dia
T wave duration → QT interval RR QT ECG Sys 1) 2) 3) Dia Sys Dia Normal Cardiac Cycle = Systole+Diastole > Systole at Normal state therefore , Normal QT interval < ½ RR interval
T wave duration → QT interval RR Normal QT RR QT QT prolongation 1. (Hypocalcemia) 2. Long QT Sd if bizzare morphology and Sx
Question Q 1> Single most frequent, abnormal arrhythmia ? A 1> VPC ( VPB ) Q 2> Single most frequent, abnormal arrhythmia , which is clinically significant ? A 2> Atrial fibrillation Q 3> Single most frequent, abnormal ECG Dx ? A 3> NSSTTC !
NSSTTC : nonspecific ST-T change “ Specific 하지 않는 ST 및 T 의 이상 모두~~~” “ Specific ST-T change ? ” STEMI 를 시사하는 ST 변화( > 2 mm) LVH 를 시사하는 Strain pattern ST change QRS 와 반대방향으로 움직이는 ST T change Ischemia 를 시사하는 Coronary T inversion(symmetric) Early Reporlization 을 시사하는 전 lead 의 ST elevation Hyperkalemia 를 시사하는 Tall T + Wide WRS Hypocalcemia 를 시사하는 QT prolongation Angina 를 시사하는 pain 에 동반된 dynamic ST-T change NSSTTC : 정상범위를 벗어나는 ST-T 이상이 있으나, specific Dx 를 붙이지 못하는 모든 상황
NSSTTC : nonspecific ST-T change NSSTTC 1. Tall T wave 2. Flat T wave 3. ST elevation<2 mm(1 mm) or ST depression< 1 mm(0. 5 mm) 4. V 1 T > V 6 T in normal transition
Normal ECG
정상 심전도 Nonspecific ST-T change 60 - 100 ( 세칸 - 다섯 칸) sinus bradycardia(<60). Tachycardia(>120) 0. 20 sec( 다섯 칸) 이하 >0. 20 sec : first degree AV block 0. 09(0. 12: 세칸) 이하 QTc : Male 0. 42, Female 0. 43 sec 이하 Lat lead P terminal force(a. Xb) > 0. 04 : LAE a 1. Flat T 2. V 1 T > V 6 T 3. Tall T(정상은 QRS 의 1/4이하) 4. ST depression < 1 mm or ST elevation < 2 mm QRS 정상높이 더 작은 경우 5 mm 9 mm low voltage QRS 7 mm 9 mm 5 mm # limb lead 는 5 mm 이상 b P wave 2. 5 mm 3. 0 mm 높이 2. 2 이상 tall P : RAE 넓이 3 이상 wide notched P : LAE Lat lead V 1 - V 3 R < 3 mm : poor R progression Lat lead Inf lead 1 sec HR 300 150 100 75 60 RR interval 이 가장 작은 것과 큰 것이 4 칸(0. 16 sec) 이상 차이날 경우 or 10 % 이상 차이날 경우 : sinus arrythmia 1. LVH 2. OMI ( septal ) 3. Normal ( clockwise rotation)
Precordial QRS Transition of Norm ECG Normal P-QRS-T PR interval < 5 mm QRS < 3 mm 10 초에 10 개 QRS = HR 60 bpm
Q&A nasanghoon@gmail. com 010 -9246 -4966 imnash Aug 2013