ECEN 46165616 Optoelectronic Design Class website with past

ECEN 4616/5616 Optoelectronic Design Class website with past lectures, various files, and assignments: http: //ecee. colorado. edu/ecen 4616/Spring 2014/ (The first assignment will be posted here on 1/22) To view video recordings of past lectures, go to: http: //cuengineeringonline. colorado. edu and select “course login” from the upper right corner of the page. Lecture #24: 3/10/14
 to")
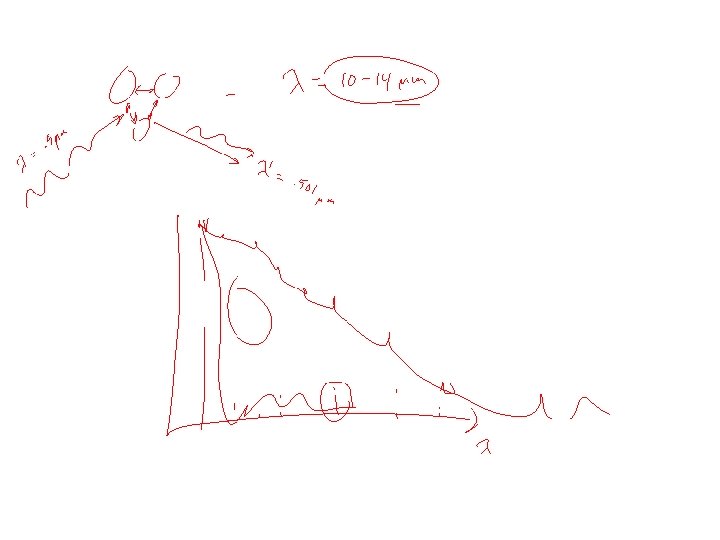
Fluorescence refers to the characteristic of certain molecules (referred to a ‘dye’ molecules) to absorb light energy at one wavelength and – after the molecule loses some of that energy in a non-radiative process – to emit energy at a longer wavelength. In general, the time lag is only a few nanoseconds. λ 1 λ 2 The wavelength separation between excitation and emission allows us to use wavelength separation means to distinguish between them. Hence, it is possible to measure the amount of dye in a sample by irradiating it with the exitation wavelength and measuring the responding emission wavelength.

Antibodies How do you attach dye molecules to the actual molecules you want to measure? The answer is “Antibodies”. These are molecules (named for the ones your immune system produces to neutralize pathogens) which attach to a specific target molecule and only that specific molecule. How antibodies work: It’s thought that they look more like this: Antibodies don’t actually look like this

How Antibodies are used to attach dye molecules to target molecules: Antibodies, either naturally or artifically produced, are ‘tagged’ with a dye molecule, the presence of which can be identified using the fluorescence of the dye molecule. Of course, the dye molecules and antibodies have to be compatible.

Methods of attaching dye to antibodies have been worked out and patented:

Fluorescence Microscopy The goal of fluorescence microscopy is often just to make visible molecular structures in cells. The target will usually have millions of dye molecules attached selectively to its structure using antibodies or other ‘staining’ techniques. For such bright targets, straight -forward filtering techniques are adequate to separate the excitation light from the fluorescence: Neuron cell tagged with multiple dyes:

Fluorescence Detection Another use of dye-tagged antigens is to discover whether a cell sample (from someone’s blood, for example) contains any pathogen cells. The sample is temporarily exposed to dye-tagged antibodies specific to a given pathogen, then the sample is read by a fluorometer to see if any antigens attached. The goal is not to create an image of millions of dye molecules emitting, but to determine if any dye molecules are present. Ideally, the fluorometer would be sensitive to a single molecule. The usual optical design is similar to the fluorescence microscope, but the imaging detector (or user’s eye) is replaced by a highly sensitive detector – often a photon-counting device:

Regardless of how it is done, once the target molecules have been tagged with dye molecules, it is the job of the fluorometer to decide how many dye molecules exist in the sample. Physically and conceptionally, most fluorometers are pretty simple devices. Optically, they tend to be fairly simple as well:
 Sample Fluoresces in all directions Source Filter Fluorescence")
Typical Fluorometer Optical Path (Zemax model) Sample Fluoresces in all directions Source Filter Fluorescence Emission Filter Optical Stop Collected fraction of fluorescence light Detector
")
Signal Budget for Single-Molecule Detection Fluorometer (Assumptions are for typical dye like Texas Red) Light from source: (One at sample) 1 m. W @ 596 nm photons/sec Response per dye molecule: (Peak emission @ 615 nm) ≈ 100, 000 photons/sec Signal collected by receiving optics (F/1. 6, 90% efficient): ≈ 2000 photons/sec Photon-Counting Detector: (QE=0. 4, dark cnt=10/s) 800 counts/sec response to signal Hence the signal from a single molecule is easily detectable with reasonable equipment.

But … Noise Budget for Single-Molecule Detection Nominal Band-Pass Filter Transmission Performance: In-Band = 0. 5 Out-of-Band = 1 E-6 Fraction of Excitation Light scattered by Sample: (Extremely clear sample) 0. 1%: 3 e 15 Photons/s Fraction of scattered Excitation collected by Receving optics: 2%: 6 E 13 Photons/s Fraction of collected Excitation passed by Fluorescence Filter: 1 e-6: 6 E 7 Photons/s Hence, only one photon in 30, 000 will be from the target Molecule! Even with very careful blank subtraction, will need several thousand molecules for detection, and samples must be very clear.

Why not just add another Fluorescence filter? If the excitation rejection was increased from 1 E-6 to 1 E-12, then the excitation leakage counts would fall below the dark count (at least for the ‘very clear’ sample assumed). When this is tried, the rejection ratio goes from 1 E 6 to 0. 5 E-6 – an improvement factor of 2! Dual Emission Filters The extra filter also reduces the signal by a factor of 2, so there is no improvement in SNR. What is going on?

The Problem is Scatter: In a good optical system, only ~99% of the light follows the predicted paths – the rest scatters from surfaces and bulk at random angles. A low-probability ray path through the optics: When light is incident on an interference filter at an angle away from the normal, the bandpass of the filter shifts toward shorter wavelengths; Hence: • The excitation light that scatters through the filter at an angle away from normal is not attenuated because it is now in the shifted bandpass of the filter! • Adding another filter does not help, because its bandpass is also shifted for the high-angle scattered light. Because in our example there are over 1015 times as many excitation photons as signal photons, an extremely small fraction of scattered excitation photons will swamp the signal.

Typical Performance for Fluorometer Filters: Filters for Texas Red dye molecule: • Max excitation wavelength: 596 nm • Max emission wavelength: 615 nm Fluorescence Filter 0 o incident angle Excitation Filter: 0 o incident angle Mutual Rejection ~10 -6

Off-Axis Performance of Fluorometer Filters: At 26 degrees incident angle, the emission filter passes the excitation light with no attenuation, as the bandpasses overlap completely! Fluorescence Filter 0 o incident angle Excitation Filter: 0 o incident angle Fluorescence Filter 26 o incident angle At 26 o AOI, the bandpass of the fluorescence filter has shifted all the way to the central passband of the excitation filter.

Time-Resolved Fluorescence One way to escape from the scattered excitation light is to exploit the fact that fluorescence emission is delayed from the excitation event. Hence, if the excitation is done with a very short pulse of light (several ns), the fluorescence can be detected after the excitation photons are gone. Decay rates of various dyes: Excitation pulse: Problems: • The detector must be able to read a very small signal immediately after being exposed to a much larger one from the scattered excitation. • The signal must be read in a very short time, reducing the possible SNR.
 Spatial Filter Detector Sample: Wavelength Filter The")
The Wavelength-Spatial Filter Chain: (A Superior Solution) Spatial Filter Detector Sample: Wavelength Filter The Spatial Filter removes light that is not following the ray-trace predicted path – hence removes the excitation light that “snuck” through the shifted bandpass of the blocking filter. When wavelength filters are interleaved with spatial filters, the blocking ratios multiply and it is possible to get ANY desired blocking ratio. Fluorescent samples can be read without blank subtraction and without regard for turbidity.
 Spatial Filter radius (r): Image of sample")
Optical Design Issues f Sample radius: (s) Spatial Filter radius (r): Image of sample The sample volume is imaged (1: 1) at the spatial filter aperture(s): Hence that aperture can’t be smaller than the sample, or signal will be lost. A spatial filter aperture radius of r, however, will pass without attenuation a range of ray angles (in the wavelength filter) up to For a given max angle, the filter shift can be calculated or measured, and the loss of rejection estimated.

Optical Design Issues Spatial Filter Sample Wavelength Filter Typical rejection of the excitation wavelength per filter pair (wavelength – spatial) for reasonable optics and sample size is ~10 -5 , or 1/10 of what the filter is theoretically capable of. Typical loss of signal photons per filter pair is ½. However, the blocking ratios multiply, so any rejection ratio and SNR is achievable. It is easily possible to build a emission receiver sensitive to single photons in the emission band (with a QE of ~. 05) which has a rejection ratio of excitation photons of 10 -20. The excitation beam can be directed straight into the receiver without effecting the signal!
 emit broad-band light")
Details, Details … 1. Many light sources (e. g. , lasers) emit broad-band light at a level ~1 E-6 below the narrow-band main emission; Hence the source should also be filtered with a wavelength-spatial filter chain. 2. Spatial filters can be made compactly: • Disks of black honeycomb material work well. • Special holographic spatial filters are available only a few mm thick. 3. Both wavelength and spatial filters work best when the sample volume is small, and the ray angles through the optics can be constrained to a narrow range.
 this principle 1. Field-Portable Polarization Fluorometer (Jolley")
Commercial Instruments that have used (some of) this principle 1. Field-Portable Polarization Fluorometer (Jolley Instruments -- now bankrupt). 2. Bio-Chip Scanner (Nanogen – never commercialized). 3. Reading fluorescent tags in saliva samples for drug testing (company failed, but instrument achieved 1 e-17+ rejection of excitation light). There seems to be a common fate for companies that use this technology. I’m sure it’s just coincidence.


Scheimpflug Principle: Consider the problem of taking a picture of the top of a table, from an oblique angle: Depth of Focus: Table Only a portion of the table-top will be in focus. The resulting image would look something like this: Is there some way to achieve a focal plane and DOF like this? DOF: Focal Plane Table camera

Scheimpflug Principle: The problem is solved by a camera type known as a “View Camera”: While this simply looks like an antique camera, it is not. (Although there antique view cameras, they are also produced today. ) The defining characteristic of a view camera is its ability to move the lens (and film plane also) with at least 3 degrees of freedom each (x, y tilt, and z translation):

Scheimpflug Principle: How does this help? Consider the imaging properties of a lens if the object is tilted: Object point ‘A’, which is far from the lens, images at image point ‘a’, which is near. b a Object point ‘B’, which is near to the lens, images at image point ‘b’, which is far. A B A Gaussian optics (linear) calculation will show that, if the object is a plane, so is the image.

Scheimpflug Principle: When the tilted object is in focus, the focal plane, image plane and lens plane have the characteristic that they intersect at a line: This is known as the “Scheimpflug Condition”. For a derivation from paraxial optics, see: http: //en. wikipedia. org/wiki/Scheimpflug_principle

Scheimpflug Principle: The Scheimpflug principle also works with afocal systems, allowing a constant magnification system: This has applications in photogrammetry – the use of photographs to determine the size and shape of objects, and in optical inspection systems.

Uses of View Cameras Perspective control in architectual photography. Still life photography, food advertisements. (When you are next in a fast-food restaurant, look at the food images on the walls and see how many could not have been taken with a normal camera. )

View Cameras Setting up view cameras can be complex, hence they are never used except from a tripod or other mount: You can buy ‘tilt-shift’ lenses and lens attachments for SLR cameras, which give you some of the capabilities of the view camera, at reduced cost.


“Lightfield” Photography 1 RAYS Lenslets Detector Arrays A 2 B C 3 Exit Pupil Plane Real Detector Location Virtual Detector Location Z
- Slides: 33