
EasyBLUE Total RNA Extraction Kit 1 2 3





실험방법 – Easy-BLUE Total RNA Extraction Kit (인트론바이오) 1. 2. 3. 4. 5. 6. 7. 8. 9. 10. 11. 12. 13. 14. 15. 16. RNA를 추출하고자 하는 세포를 준비한다. 배양된 세포의 기존의 배지를 제거하고, 1 ml 의 Lysis Buffer를 넣어준다. (100 -mm dish 기준) Scraper를 이용하여, 바닥에 붙은 세포를 긁어서 모아준다. Pipette을 이용하여 (세포를 긁어모은) Lysis Buffer를 1. 5 ml tube로 옮겨준다. Vigorously vortex in room temperature for 10 sec Add 200μl of Chloroform and apply vortex. After centrifuging the solution at 13, 000 rpm (4℃) for 10 min, transfer 400μl of the upper fluid to an empty 1. 5 ml tube. Add 400μl of Binding Buffer and mix it well by pipetting or gently inverting the 2 -3 times. Do not centrifuge and leave it for 1 min at room temperature. Column을 준비하고, 위의 800μl의 sample mix를 column에 넣어준다. Centrifuge at 13, 000 rpm for 30 sec. Column 아래로 빠져나온 용액 (filtrate)을 버린다. Add 700μl of Washing Buffer A to the column. Centrifuge at 13, 000 rpm for 30 sec. Column 아래로 빠져나온 용액 (filtrate)을 버린다. Add 700μl of Washing Buffer B to the column. Centrifuge at 13, 000 rpm for 30 sec. Column 아래로 빠져나온 용액 (filtrate)을 버린다. Column membrane을 완전히 dry 하기 위해 아무것도 넣지 않고, centrifuge at 13, 000 rpm for 1 min. 50μl의 Elution buffer를 column membrane의 중앙에 넣어주고, 1분간 대기한 후 centrifuge for 1 min at 13, 000 rpm to elute. (이때 tip 끝이 membrane에 닿지 않도록 주의한다. )
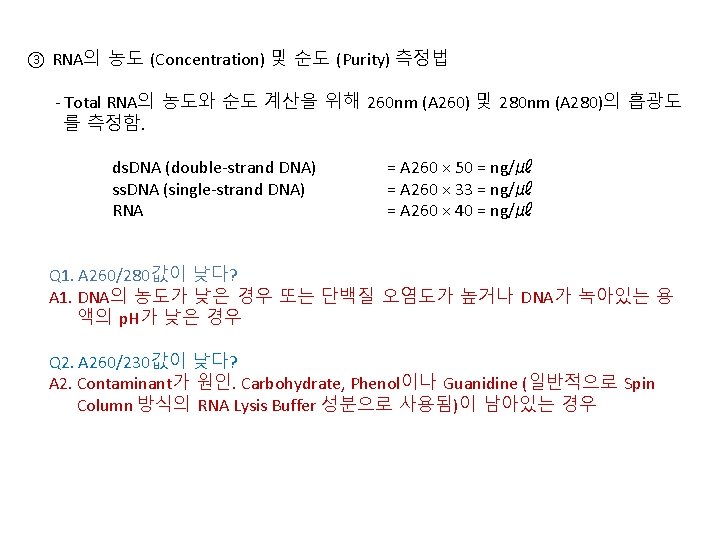
③ RNA의 농도 (Concentration) 및 순도 (Purity) 측정법 - Total RNA의 농도와 순도 계산을 위해 260 nm (A 260) 및 280 nm (A 280)의 흡광도 를 측정함. ds. DNA (double-strand DNA) ss. DNA (single-strand DNA) RNA = A 260 × 50 = ng/㎕ = A 260 × 33 = ng/㎕ = A 260 × 40 = ng/㎕ Q 1. A 260/280값이 낮다? A 1. DNA의 농도가 낮은 경우 또는 단백질 오염도가 높거나 DNA가 녹아있는 용 액의 p. H가 낮은 경우 Q 2. A 260/230값이 낮다? A 2. Contaminant가 원인. Carbohydrate, Phenol이나 Guanidine (일반적으로 Spin Column 방식의 RNA Lysis Buffer 성분으로 사용됨)이 남아있는 경우

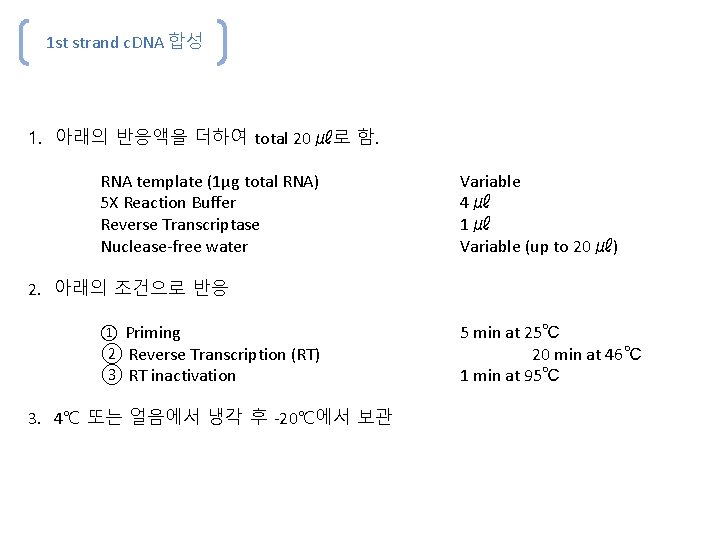
1 st strand c. DNA 합성 1. 아래의 반응액을 더하여 total 20 ㎕로 함. RNA template (1μg total RNA) 5 X Reaction Buffer Reverse Transcriptase Nuclease-free water Variable 4㎕ 1㎕ Variable (up to 20 ㎕) 2. 아래의 조건으로 반응 ① Priming ② Reverse Transcription (RT) ③ RT inactivation 3. 4℃ 또는 얼음에서 냉각 후 -20℃에서 보관 5 min at 25℃ 20 min at 46℃ 1 min at 95℃

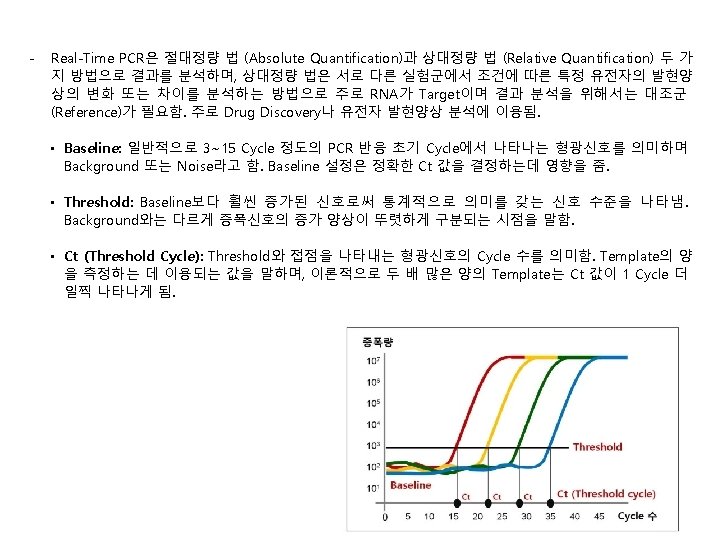

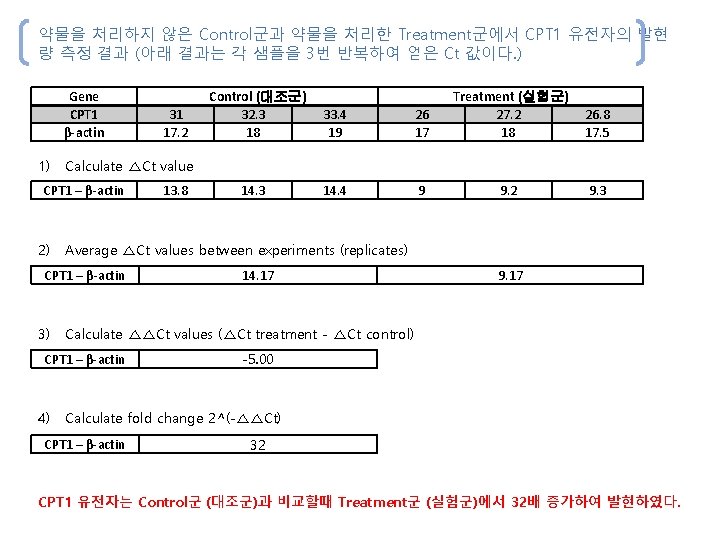
약물을 처리하지 않은 Control군과 약물을 처리한 Treatment군에서 CPT 1 유전자의 발현 량 측정 결과 (아래 결과는 각 샘플을 3번 반복하여 얻은 Ct 값이다. ) Gene CPT 1 β-actin 1) 14. 4 9 9. 2 26. 8 17. 5 13. 8 14. 3 9. 3 14. 17 9. 17 Calculate △△Ct values (△Ct treatment - △Ct control) CPT 1 – β-actin 4) 26 17 Average △Ct values between experiments (replicates) CPT 1 – β-actin 3) 33. 4 19 Treatment (실험군) 27. 2 18 Calculate △Ct value CPT 1 – β-actin 2) 31 17. 2 Control (대조군) 32. 3 18 -5. 00 Calculate fold change 2^(-△△Ct) CPT 1 – β-actin 32 CPT 1 유전자는 Control군 (대조군)과 비교할때 Treatment군 (실험군)에서 32배 증가하여 발현하였다.








- Slides: 32