Earthquakes I General Description of Earthquakes A Earthquakes


 waves (P -waves) - particles in the crust are alternately stretched")
 waves (S-waves) Cause the crust’s particles to move in a direction")
 - cause the earth’s surface to move like waves on")


 Let’s enlarge a small section")


 Let’s enlarge a")


")


")

")

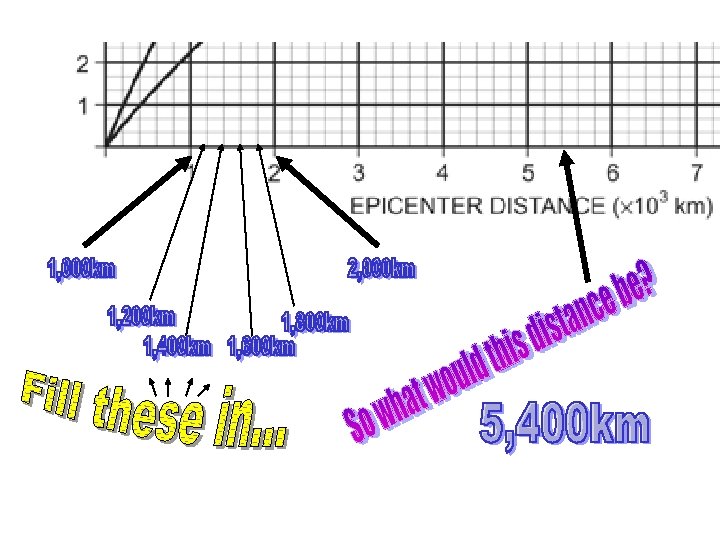
 1. What relationship can you identify between the locations of")
- Slides: 83
Earthquakes
I. General Description of Earthquakes A. Earthquakes are a shaking of the earth’s crust due to a release of energy.
B. Earthquakes affect large areas. Effects of this shaking can include: 1. Collapse of buildings 2. Explosions/Fires 3. Broken electric wires/gas mains 4. Sewage line breakage
5. Spread of disease 6. Food shortages 7. Roads, airports, railways closed 8. Tsunamis (Tidal wave)
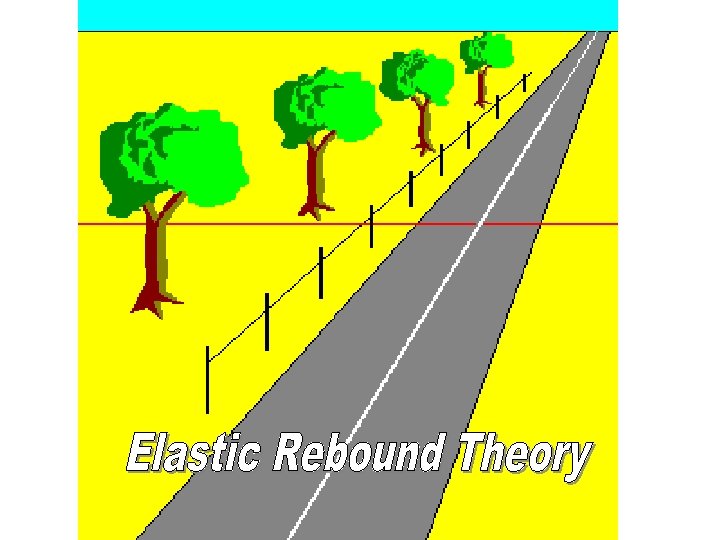
C. Causes of earthquakes: 1. Volcanic eruptions 2. Collapse of caverns 3. Meteor impacts 4. Release of built up stress between two plates moving past one another. (Elastic-Rebound Theory)
D. Earthquakes usually originate deep within the earth. The exact location within the earth that an earthquake occurs is called the hypocenter or focus.
E. The location on earth’s surface directly above the locus of an earthquake is called its epicenter.
F. Earthquakes release their energy in the form of waves. 3 basic waves are produced by earthquakes:
1. Primary (compressional) waves (P -waves) - particles in the crust are alternately stretched apart and squeezed together in a back-and-forth motion. These waves can travel through any medium, solid or liquid.
2. Secondary (shear) waves (S-waves) Cause the crust’s particles to move in a direction perpendicular to the direction of wave travel. Can travel only through solids.
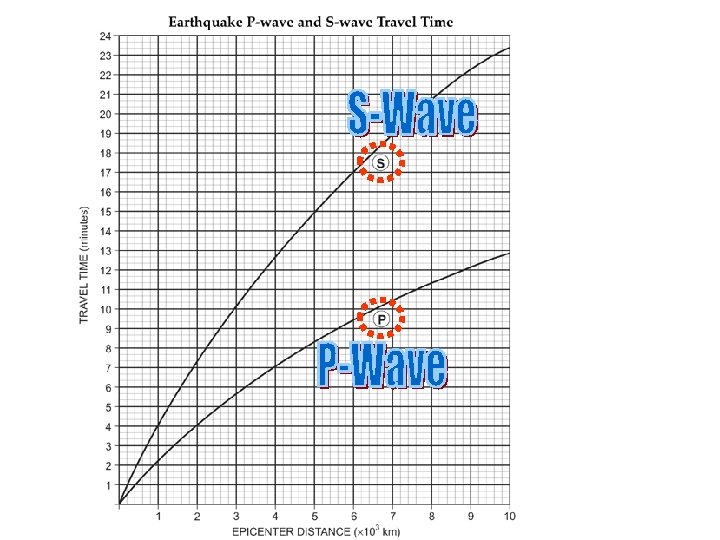
3. Surface waves (L-waves) - cause the earth’s surface to move like waves on a lake or pond. G. P-waves travel about twice as fast as s-waves, so they arrive at a location first. Brain. Pop - Earthquakes
II. Locating an Earthquake A. Instruments called seismographs are used to measure earthquake intensity. Some record horizontal motion, others vertical motion. B. The record of an earthquake from a seismograph is a seismogram. Both the pwaves and s-waves appear on this record.
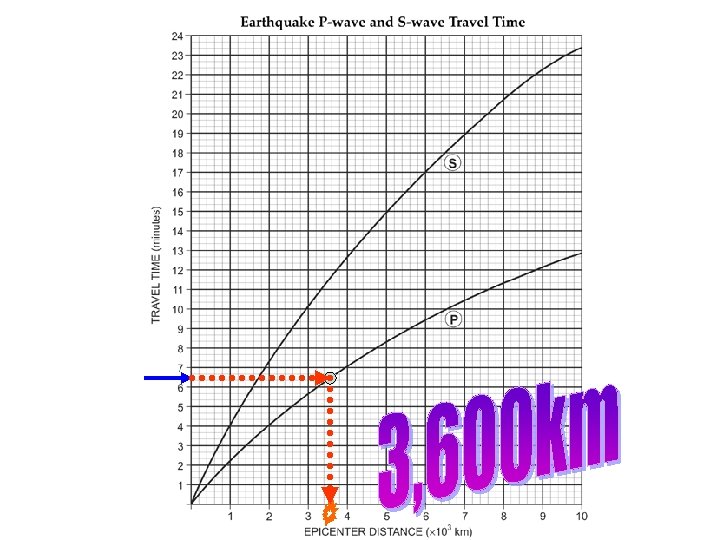
C. Your Reference Tables have a time-travel graph on them to help you determine the distance to the epicenter from any seismograph. You must be able to use this chart properly!
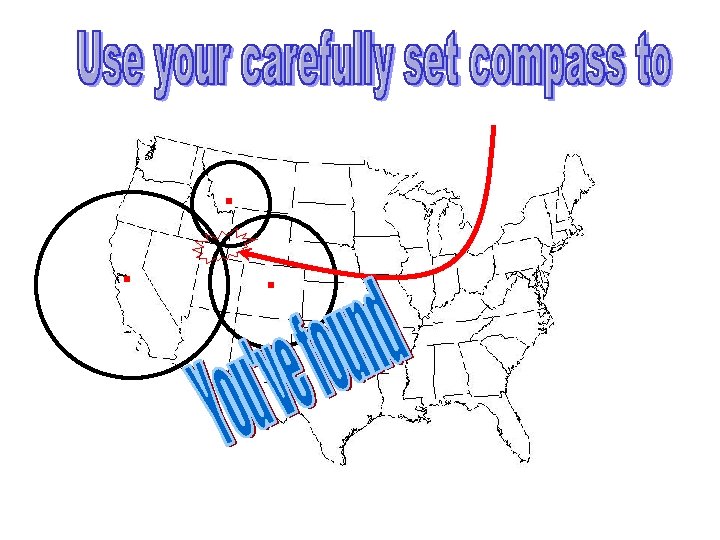
D. Three seismographs are needed to determine the location of any epicenter. Where the radii of the distances from these seismographs meet is where the epicenter is located.
III. Measuring Earthquake Magnitude A. Charles F. Richter in the 1940’s came up with the Richter Scale to measure the intensity of earthquakes. Each whole number increment is 32 times greater than the previous one. For example, a magnitude 6 earthquake is 32 times greater than a magnitude 5 earthquake. B. The Seismic Moment scale is a more accurate way of measuring earthquake energy, but is harder to measure.
C. Other earthquake damages: D. 1. Ground shaking 2. Foundation failure 3. Ground liquefaction
Earthquake Magnitude Classes Class Great Magnitude 8 or more Major 7. 0 -7. 9 Strong 6. 1 -6. 9 Moderate Under 6. 0 Light 3. 5 -5. 4 Minor Less than 3. 5
Earthquake Damage
Earthquake Chili 1960 • The Strongest Earthquake every recorded was in Chili in 1960 it measured a 9. 5 in magnitude, the quake killed 2, 000 people and wounded 3, 000. The Earthquake was on the Coast of Chili and was caused a Tsunami that traveled as far as Hawaii New Zealand Japan. Luckily the Earthquake happened in a somewhat less densely populated area or it could have been catastrophic.
Deadliest Earthquakes of the 20 th Century 1 2 3 4 5 6 7 8 9 10 Tangshan, China July 28, 1976 242, 419 killed Nanshan, China May 22, 1927 200, 000 killed Kansu, China Dec. 16, 1920 180, 000 killed Messina, Italy Dec. 28, 1908 160, 000 killed Tokyo, Japan Sept. 1, 1923 142, 807 killed Kansu, China Dec. 25, 1932 70, 000 killed Yungay, Peru. May 31, 1970 66, 800 killed Quetta, India. May 30, 1935 50, 000 -60, 000 killed Armenia Dec. 7, 1988 over 55, 000 killed Iran June 21, 1990 over 40, 000 killed
IV. Earthquake Waves Inside the Earth A. P-waves can travel right through the earth’s core, S-waves cannot. They can only pass through solid rock. Outer Core = Liquid
B. The boundary marks a spot where the waves change direction and speed markedly. This depth (30 km) is called the Moho (Mohorovic Discontinuity).
C. When an earthquake’s waves pass through the earth’s core, they are deflected at the boundary between the inner core and mantle. This creates a shadow zone, where no waves from that earthquake are observed.
-Mr. Rall
Notice the vertical axis This represents TIME (in minutes!) Let’s enlarge a small section
Between each minute, we notice that there are 3 segments. If there are 60 seconds in a minute, each one of these segments must be ____seconds.
What would this time be?
Notice the horizontal axis This represents DISTANCE (in thousands of Kilometers!) Let’s enlarge a small section
There also two curves on this chart that display the way different earthquake waves behave.
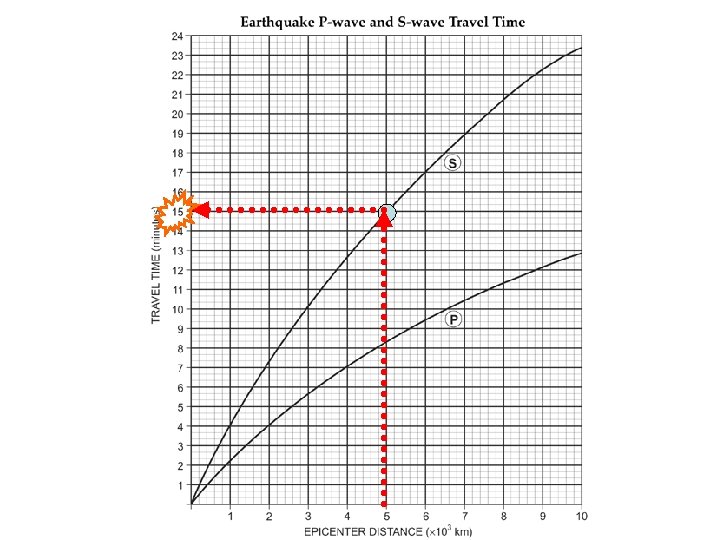
This chart can be used for answering many different questions! How long does it take an S-Wave to travel 5, 000 km?
The recording station tells us it took 6 minutes and 20 seconds for the P-Wave to reach them. How far away from the epicenter of the earthquake must they be?
I know that there was a 7 minute difference in the arrival of my P and S waves. How far away from the epicenter must I be?
Slide your scrap paper up until the tick marks match up with the curves… Mark off 7 minutes on scrap paper…
Finding an Epicenter
What is an Epicenter? • A point on the surface of the Earth directly above the FOCUS of the earthquake. • The point within the Earth from which earthquake waves originate.
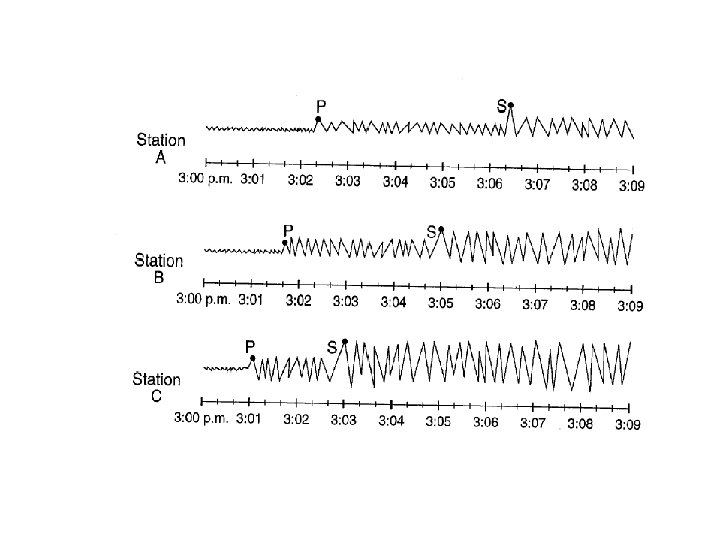
Use the data from the recording stations: • Station A: San Francisco, California P-Wave arrival 3: 02: 20 S-Wave arrival 3: 06: 30 What is the time difference between P and S wave arrivals?
Use the data from the recording stations: • Station B: Denver, Colorado P-Wave arrival 3: 01: 40 S-Wave arrival 3: 05: 00 What is the time difference between P and S wave arrivals?
Use the data from the recording stations: • Station C: Missoula, Montana P-Wave arrival 3: 01: 00 S-Wave arrival 3: 00 What is the time difference between P and S wave arrivals?
Difference in arrival times: San Francisco: 4: 10 Denver, Colorado: 3: 20 Missoula, Montana: 2: 00
TAKE A PIECE OF PAPER, AND MARK OFF THE DIFFERENCE IN ARRIVAL TIME 4: 10 2800 Km
MOVE THE PAPER UNTIL THE TWO TICK MARKS LINE UP WITH THE P AND S CURVES WHEN TICK MARKS LINE UP, GO STRAIGHT DOWN AND READ THE EPICENTER DISTANCE OF 2800 KM
EPICENTER DISTANCES San Francisco: 4: 10 2, 800 km Denver, Colorado: 3: 20 2, 000 km Missoula, Montana 2: 00 1100 km
Recording Board Difference in arrival times: 2, 800 km San Francisco: 4: 10 5, 000 4, 000 3, 000 2, 000 1, 000 Open your compass to the EXACT distance on the scale.
Earth’s Dynamic Surface The Pacific Rim Example
Dynamic Surface • Dynamic – ‘Characterized by continuous change, activity, or progress’ • Questions to consider for today… – How is the earth’s surface ‘dynamic’? – What causes the dynamic surface?
1 - Andes
South America - Andes
High Andes Mountains, Peru
La Misti Volcano, Peru
Lima, Peru – Earthquake damage, 1974
2 - Mexico 1 - Andes
Mexico
Popocatépeli, Mexico
Earthquake Damage, Mexico City September 19, 1985 magnitude 8. 1 more than 30, 000 deaths
3 – San Andreas Fault; and Cascade Range 2 - Mexico 1 - Andes
Southern California – San Andreas Fault
North • San Andreas Fault W e s t E a s t – West Side moves north – East Side moves south • Earthquakes are very common in this region South
Landslide damage caused by a 1995 Earthquake in La Conchita, California
Oregon and Washington Cascade Range
Mt. Hood, Oregon
Mt. St. Helens, Washington
University of Washington: damage to campus libraries after the Feb. 28, 2001 Earthquake Damage, Seattle, Washington
4 - Alaska 3 – San Andreas Fault; and Cascade Range 2 - Mexico 1 - Andes
Aleutian Archipelago (chain of islands)
Novarupta Volcano, Katmai National Park, Alaska
Southwest Alaska March 27, 1964 magnitude 9. 2 earthquake and tsunami took 125 lives (tsunami 110, earthquake 15)
4 - Alaska 5 - Japan 3 – San Andreas Fault; and Cascade Range 2 - Mexico 1 - Andes
Japan
Earthquake Damage, Japan
Kobe, Japan; Jan. 17, 1995 magnitude 7. 2 5100 deaths
Mt. Fuji, Honshu, Japan (population ~ 230, 000)
4 - Alaska 5 - Japan 3 – San Andreas Fault; and Cascade Range 2 - Mexico s e n pi ip 6 - il h P 1 - Andes
Philippines (south Pacific)
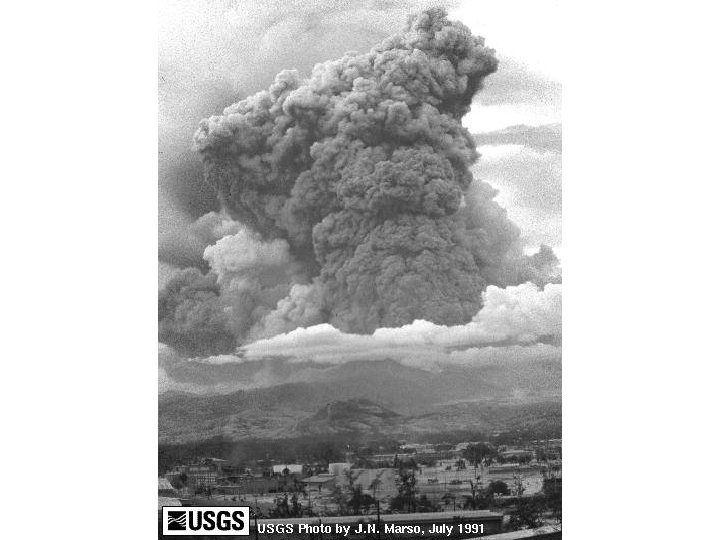
Pinatubo, 1991, north of Manila, Philippines Pacific southwest
Questions to consider (HW) 1. What relationship can you identify between the locations of volcanic and earthquake activity? 2. Explain as best you can why the Pacific Rim is so active with volcanoes and earthquakes (include any pictures and diagrams if you think they will help). 3. Think about other coastlines (like the East Coast of North America). Do we experience a lot of earthquakes and volcanoes? YES/NO (Circle one). – How does this answer support or disagree with your previous answer?