
Earth Resources the Looming Crunch by Poorna Pal
Earth Resources — the Looming Crunch! by Poorna Pal
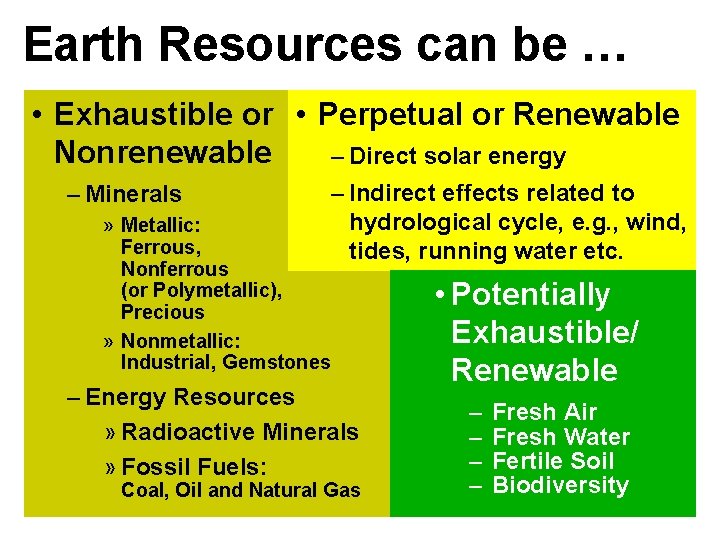
Earth Resources can be … • Exhaustible or • Perpetual or Renewable Nonrenewable – Direct solar energy – Minerals » Metallic: Ferrous, Nonferrous (or Polymetallic), Precious » Nonmetallic: Industrial, Gemstones – Indirect effects related to hydrological cycle, e. g. , wind, tides, running water etc. – Energy Resources » Radioactive Minerals » Fossil Fuels: Coal, Oil and Natural Gas • Potentially Exhaustible/ Renewable – – Fresh Air Fresh Water Fertile Soil Biodiversity
Ocean Resources • Resources and man • The ocean reservoir – Food resources – Mineral resources – Energy resources • Oceans and the environment – Climate change – Environmental degradation and waste disposal
Resources and Man • The Malthusian trap • The kinds of resources – renewable versus nonrenewable • The nature of exhaustibility
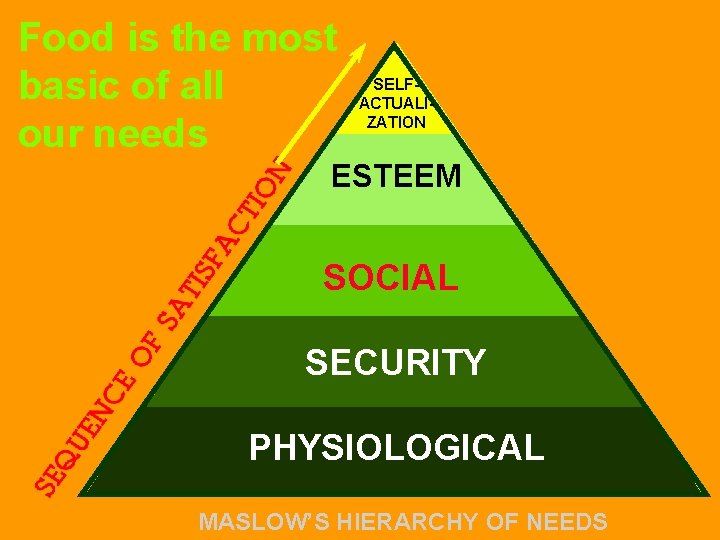
Food is the most basic of all our needs SELFACTUALIZATION ESTEEM SOCIAL SECURITY PHYSIOLOGICAL MASLOW’S HIERARCHY OF NEEDS
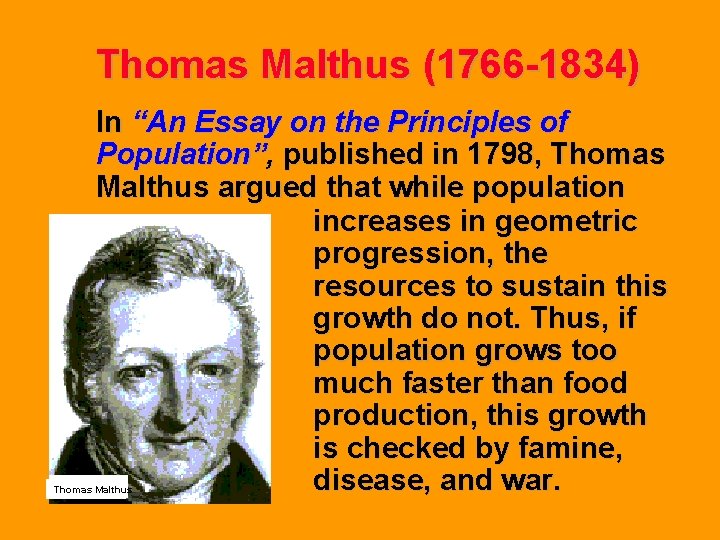
Thomas Malthus (1766 -1834) In “An Essay on the Principles of Population”, published in 1798, Thomas Malthus argued that while population increases in geometric progression, the resources to sustain this growth do not. Thus, if population grows too much faster than food production, this growth is checked by famine, disease, and war. Thomas Malthus
In an essay first published* in 1798, Thomas Roberts Malthus argued that “the power of population is indefinitely greater than the power in the earth to produce subsistence for man”. * This was entitled “An essay on the principles of population as it affects the future improvement of society”
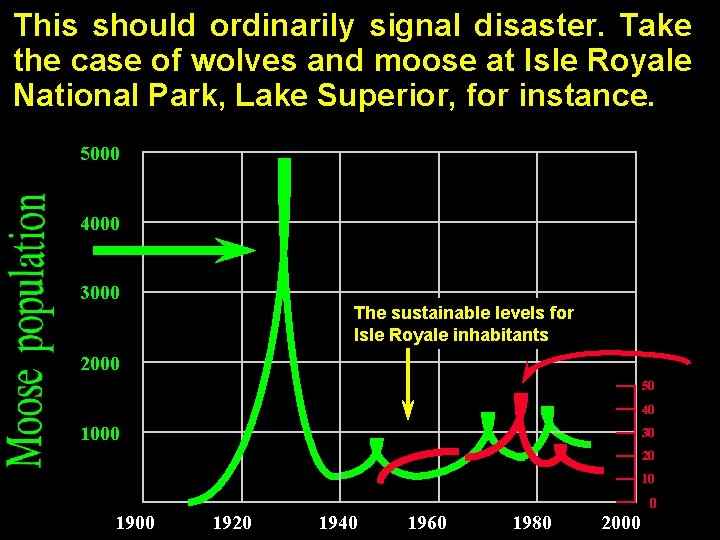
This should ordinarily signal disaster. Take the case of wolves and moose at Isle Royale National Park, Lake Superior, for instance. 5000 4000 3000 The sustainable levels for Isle Royale inhabitants 2000 50 40 1000 30 20 10 1900 1920 1940 1960 1980 2000 0
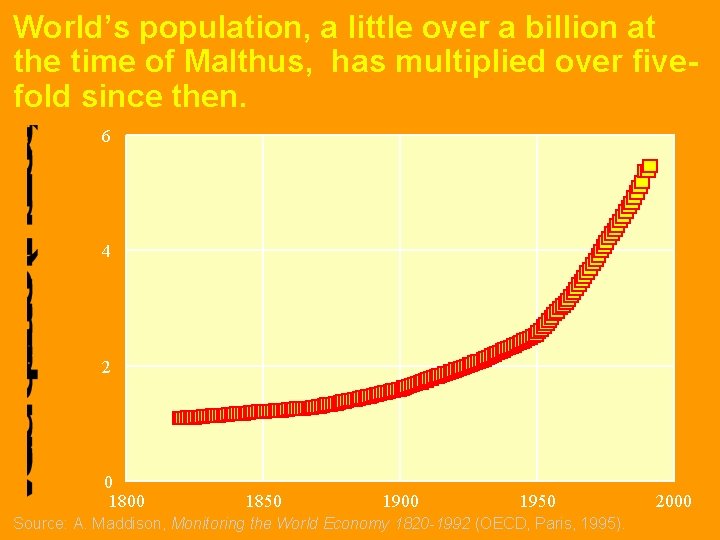
World’s population, a little over a billion at the time of Malthus, has multiplied over fivefold since then. 6 4 2 0 1800 1850 1900 1950 Source: A. Maddison, Monitoring the World Economy 1820 -1992 (OECD, Paris, 1995). 2000
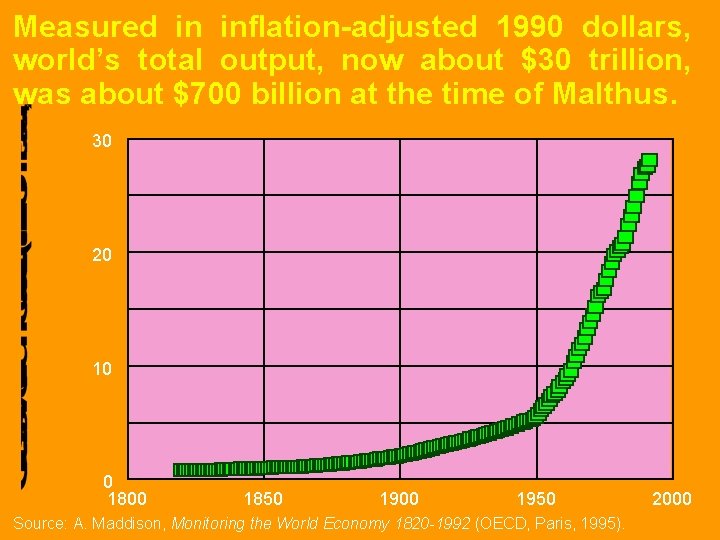
Measured in inflation-adjusted 1990 dollars, world’s total output, now about $30 trillion, was about $700 billion at the time of Malthus. 30 20 10 0 1800 1850 1900 1950 Source: A. Maddison, Monitoring the World Economy 1820 -1992 (OECD, Paris, 1995). 2000
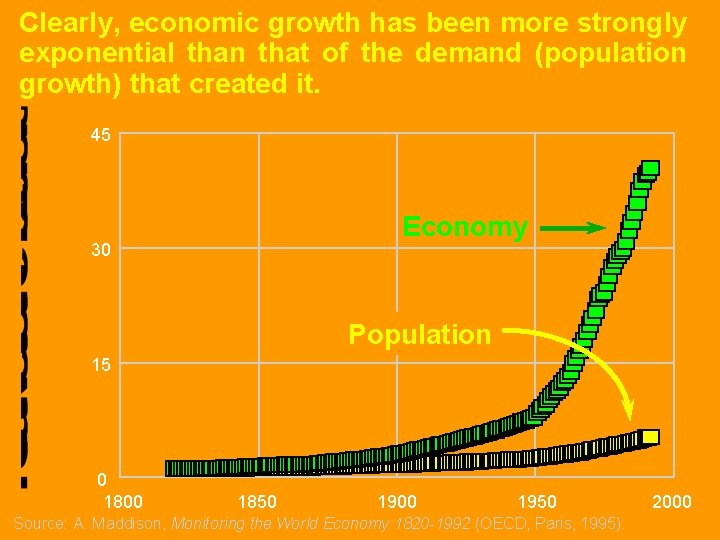
Clearly, economic growth has been more strongly exponential than that of the demand (population growth) that created it. 45 Economy 30 Population 15 0 1800 1850 1900 1950 Source: A. Maddison, Monitoring the World Economy 1820 -1992 (OECD, Paris, 1995). 2000
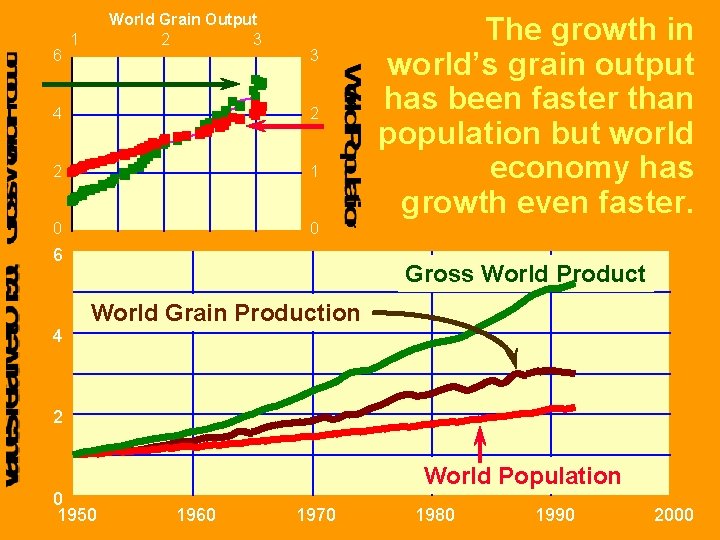
6 World Grain Output 2 3 1 3 4 2 2 1 0 0 6 4 The growth in world’s grain output has been faster than population but world economy has growth even faster. Gross World Product World Grain Production 2 0 1950 World Population 1960 1970 1980 1990 2000
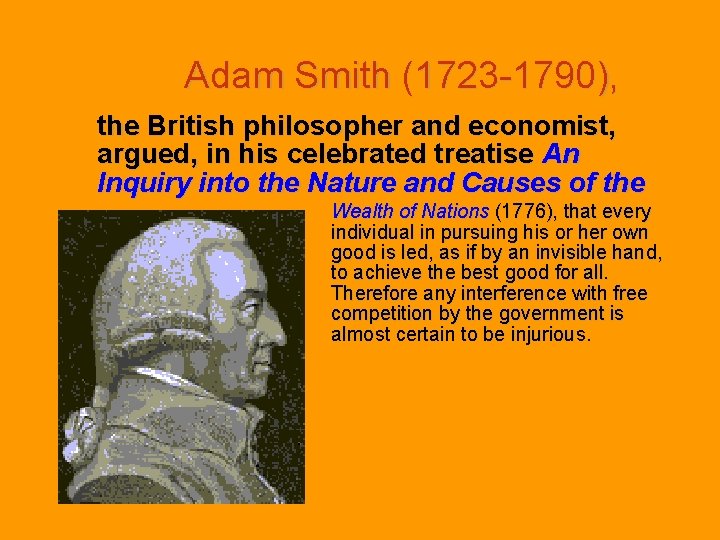
Adam Smith (1723 -1790), the British philosopher and economist, argued, in his celebrated treatise An Inquiry into the Nature and Causes of the Wealth of Nations (1776), that every individual in pursuing his or her own good is led, as if by an invisible hand, to achieve the best good for all. Therefore any interference with free competition by the government is almost certain to be injurious.
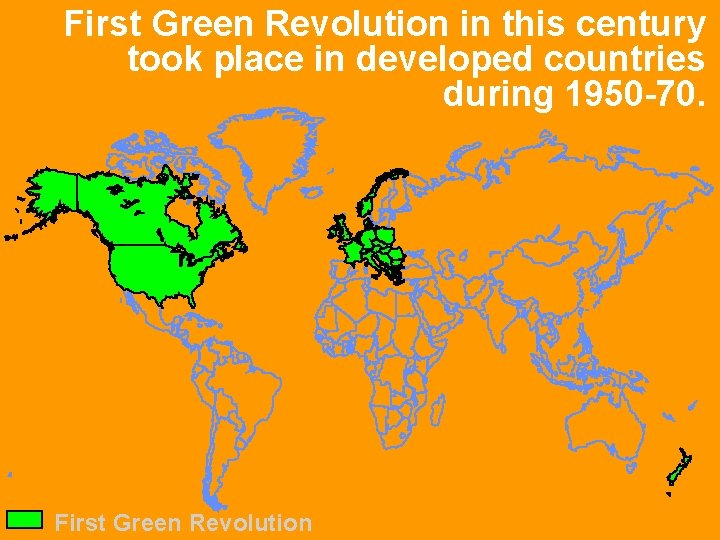
First Green Revolution in this century took place in developed countries during 1950 -70. First Green Revolution
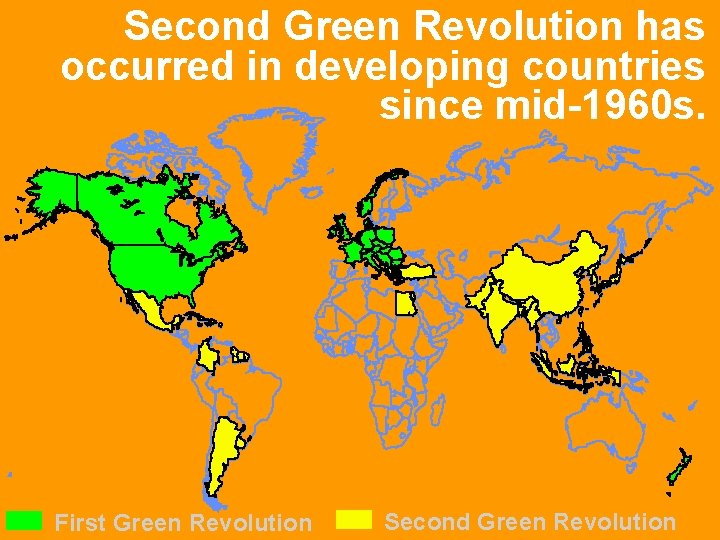
Second Green Revolution has occurred in developing countries since mid-1960 s. First Green Revolution Second Green Revolution
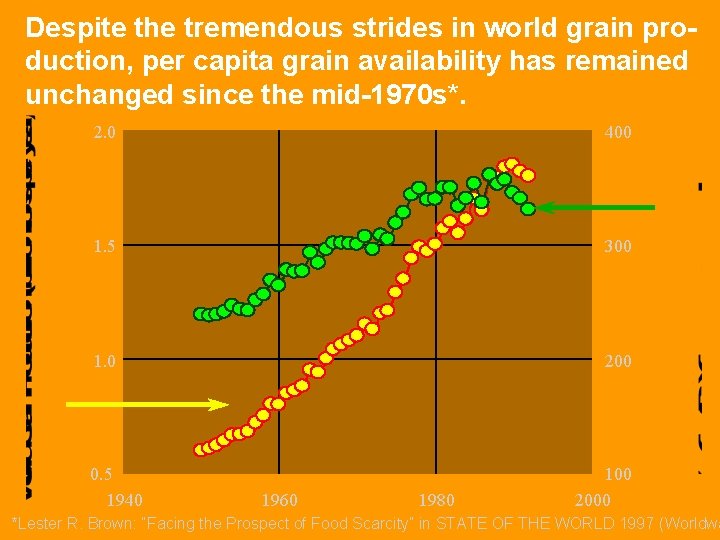
Despite the tremendous strides in world grain production, per capita grain availability has remained unchanged since the mid-1970 s*. 2. 0 400 1. 5 300 1. 0 200 0. 5 1940 1960 1980 100 2000 *Lester R. Brown: “Facing the Prospect of Food Scarcity” in STATE OF THE WORLD 1997 (Worldwa
Currently, the annual food production world-wide, including grains, poultry, seafood and meat, • is about 4 billion tons per year, or • about 4½ lbs person per day.
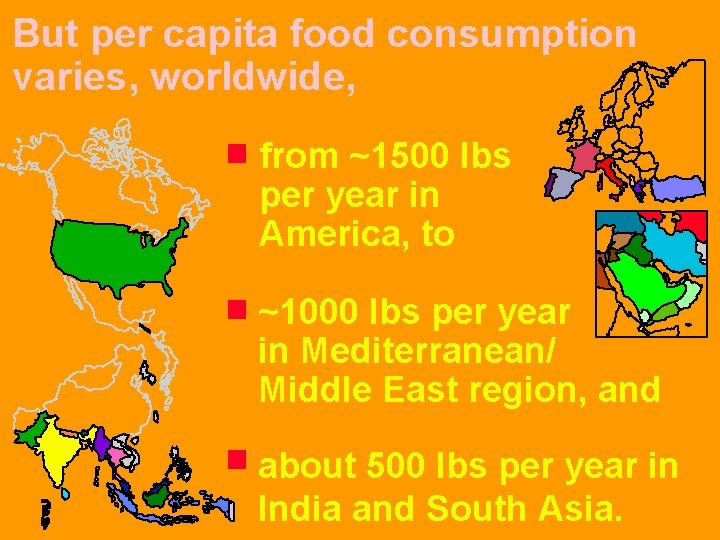
But per capita food consumption varies, worldwide, from ~1500 lbs per year in America, to ~1000 lbs per year in Mediterranean/ Middle East region, and about 500 lbs per year in India and South Asia.
An average American diet world-wide is clearly impossible, without a proportionate increase in the world’s food production.
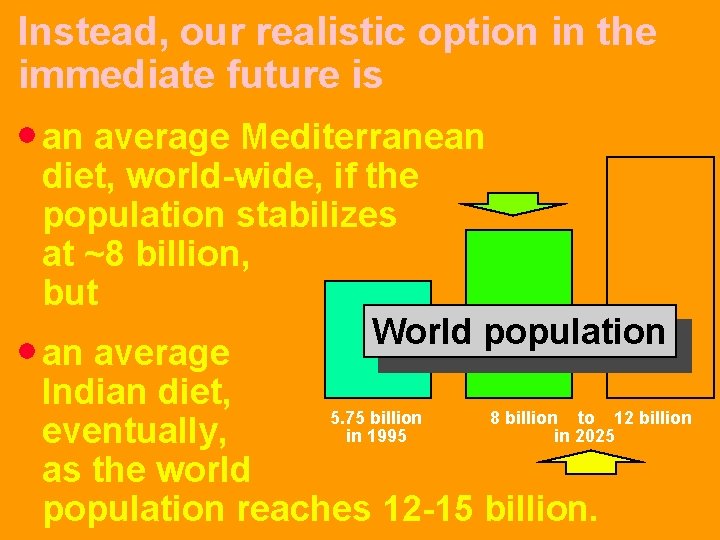
Instead, our realistic option in the immediate future is an average Mediterranean diet, world-wide, if the population stabilizes at ~8 billion, but World population an average Indian diet, 5. 75 billion 8 billion to 12 billion in 1995 in 2025 eventually, as the world population reaches 12 -15 billion.

Lesson? Get used to the Indian diet! Alternative? Grow more food!
That requires • Land • water
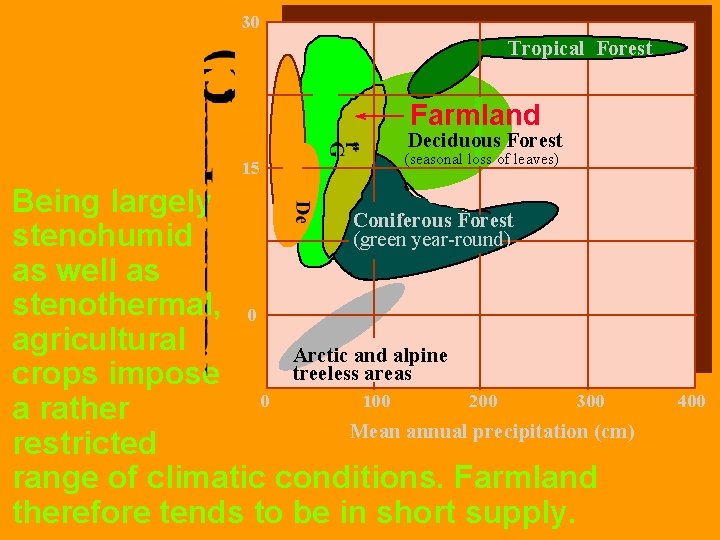
30 Tropical Forest Farmland Deciduous Forest 15 (seasonal loss of leaves) Being largely Coniferous Forest stenohumid (green year-round) as well as stenothermal, 0 agricultural Arctic and alpine treeless areas crops impose 0 100 200 300 a rather Mean annual precipitation (cm) restricted range of climatic conditions. Farmland therefore tends to be in short supply. 400
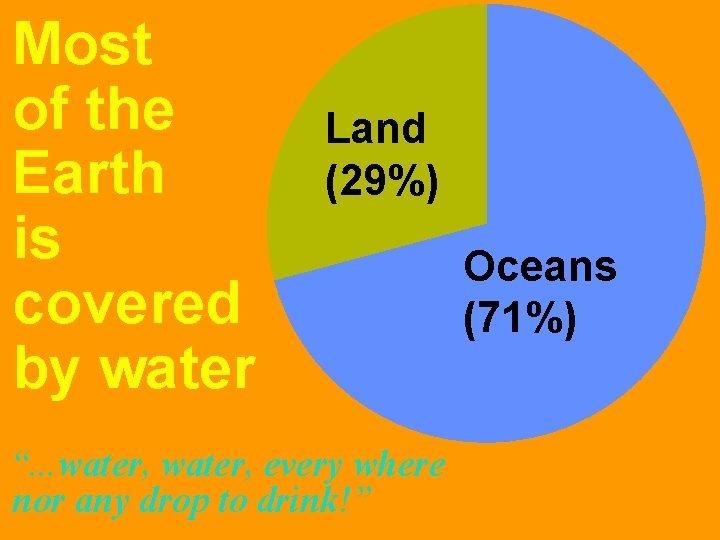
Most of the Earth is covered by water Land (29%) “. . . water, every where nor any drop to drink!” Oceans (71%)
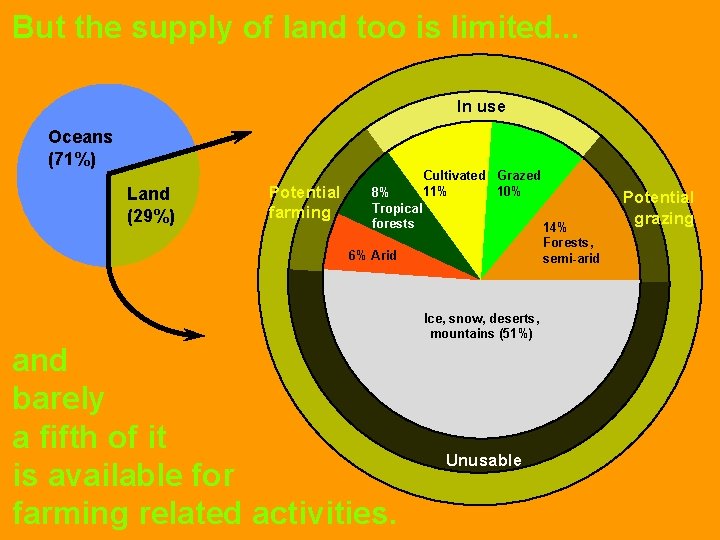
But the supply of land too is limited. . . In use Oceans (71%) Land (29%) Potential farming 8% Tropical forests Cultivated Grazed 11% 10% 14% Forests, semi-arid 6% Arid Ice, snow, deserts, mountains (51%) and barely a fifth of it is available for farming related activities. Unusable Potential grazing
Economic growth exacerbates the demand for water, e. g. , • with economic growth at 7 -10% per year, poultry consumption is rising at the rate of 15% per year in India, Indonesia and China - the water demands of this nontraditional industry are only likely to grow; • we need about 250, 000 gallons of water to produce a ton of corn, 375, 000 gallons to produce a ton of wheat, 1, 000 gallons to produce a ton of rice, and 7, 500, 000 of water to produce a ton of beef.
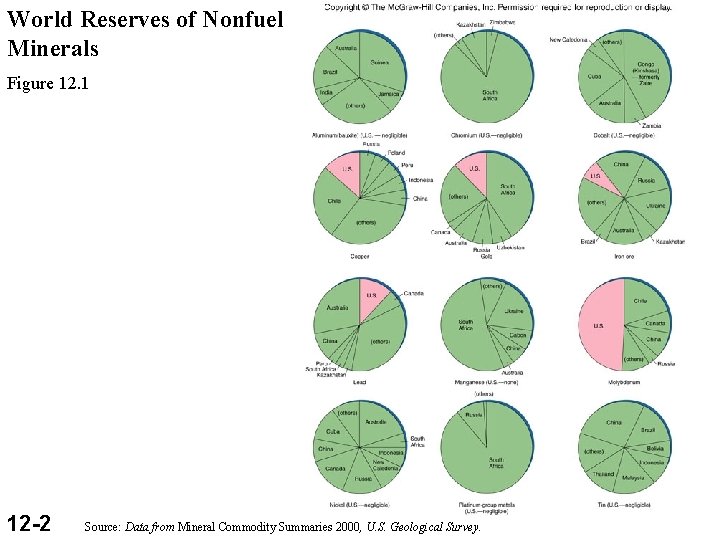
World Reserves of Nonfuel Minerals Figure 12. 1 12 -2 Source: Data from Mineral Commodity Summaries 2000, U. S. Geological Survey.
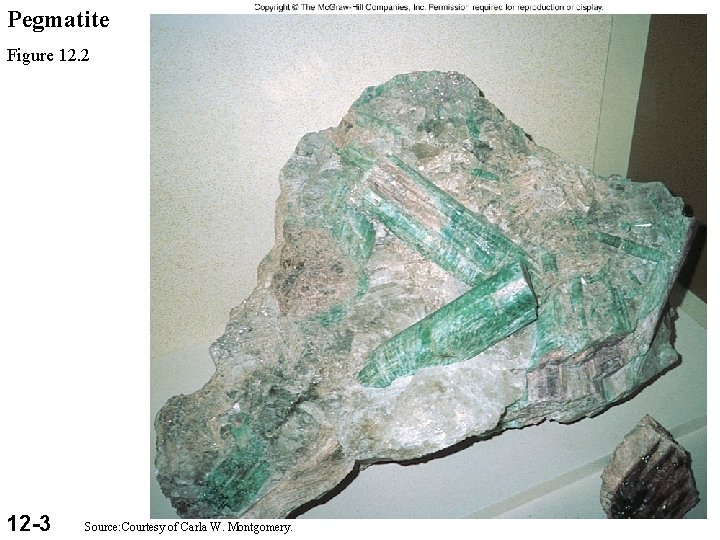
Pegmatite Figure 12. 2 12 -3 Source: Courtesy of Carla W. Montgomery.
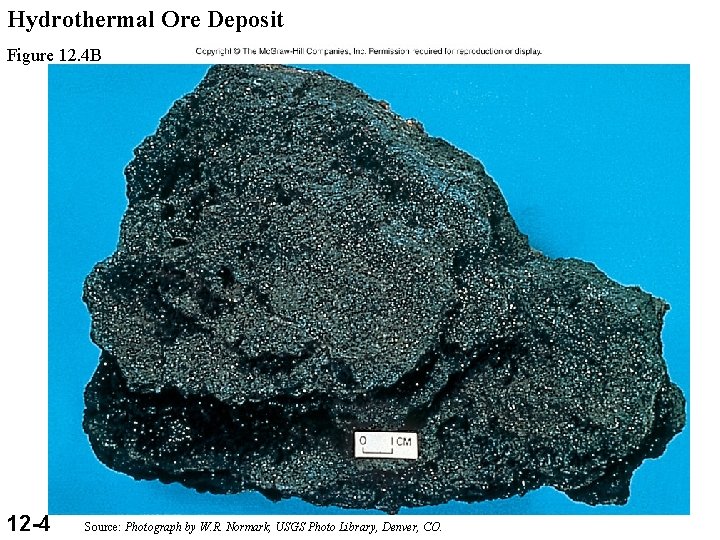
Hydrothermal Ore Deposit Figure 12. 4 B 12 -4 Source: Photograph by W. R. Normark, USGS Photo Library, Denver, CO.
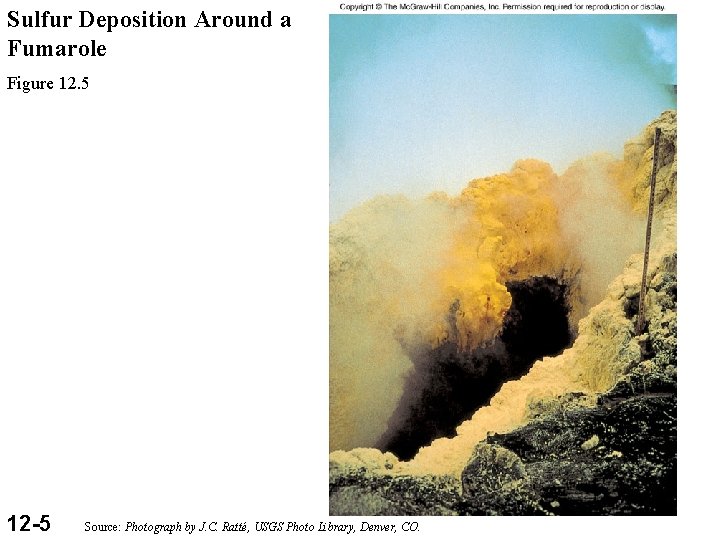
Sulfur Deposition Around a Fumarole Figure 12. 5 12 -5 Source: Photograph by J. C. Ratté, USGS Photo Library, Denver, CO.
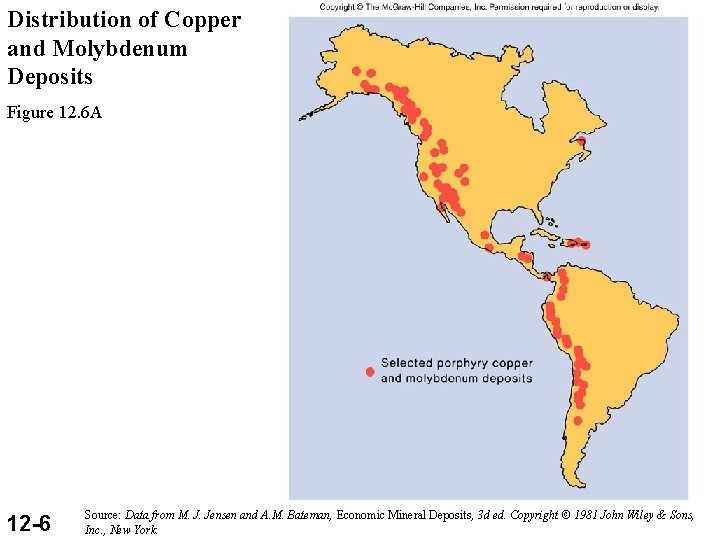
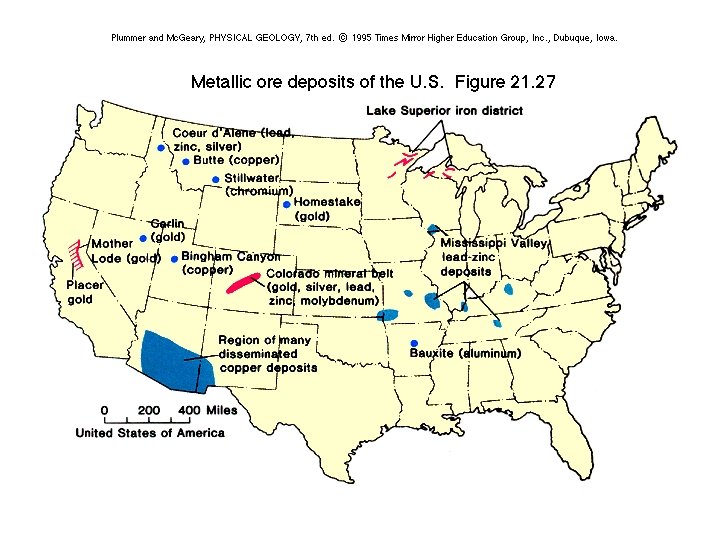
Distribution of Copper and Molybdenum Deposits Figure 12. 6 A 12 -6 Source: Data from M. J. Jensen and A. M. Bateman, Economic Mineral Deposits, 3 d ed. Copyright © 1981 John Wiley & Sons, Inc. , New York.
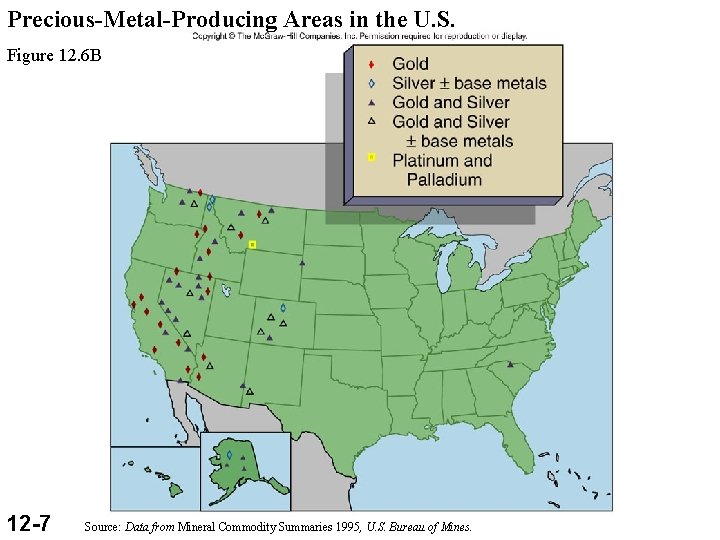
Precious-Metal-Producing Areas in the U. S. Figure 12. 6 B 12 -7 Source: Data from Mineral Commodity Summaries 1995, U. S. Bureau of Mines.
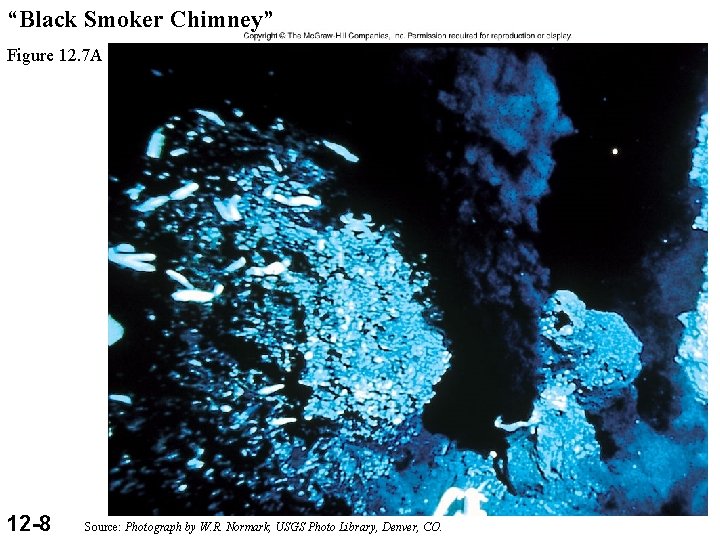
“Black Smoker Chimney” Figure 12. 7 A 12 -8 Source: Photograph by W. R. Normark, USGS Photo Library, Denver, CO.
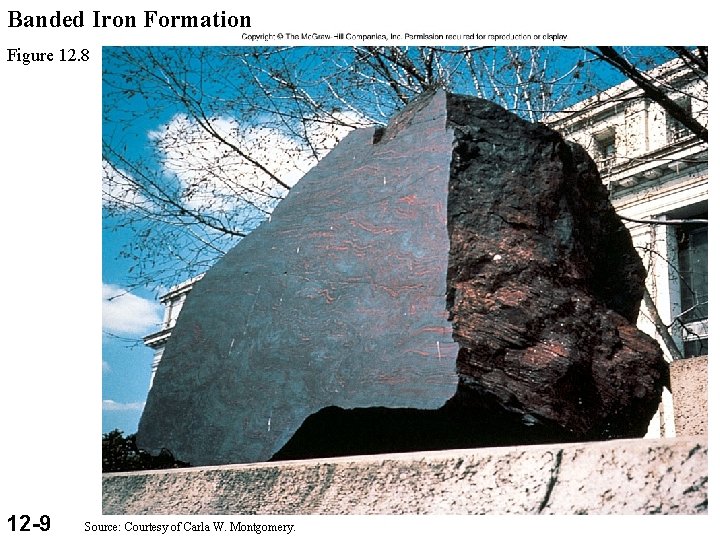
Banded Iron Formation Figure 12. 8 12 -9 Source: Courtesy of Carla W. Montgomery.
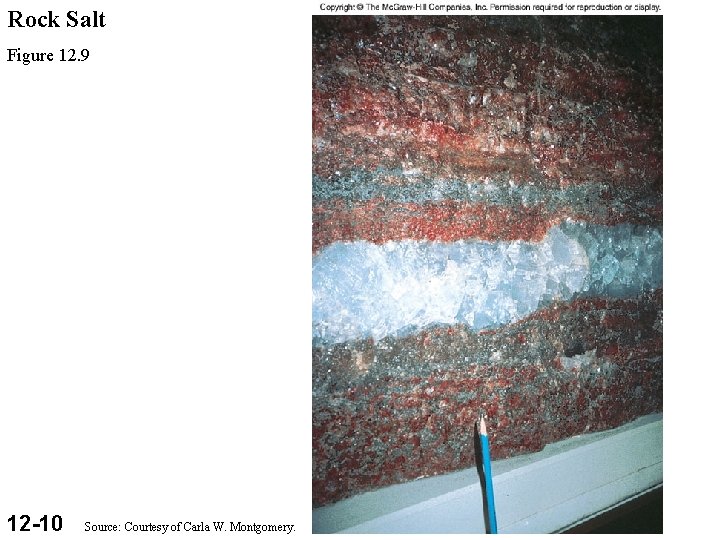
Rock Salt Figure 12. 9 12 -10 Source: Courtesy of Carla W. Montgomery.
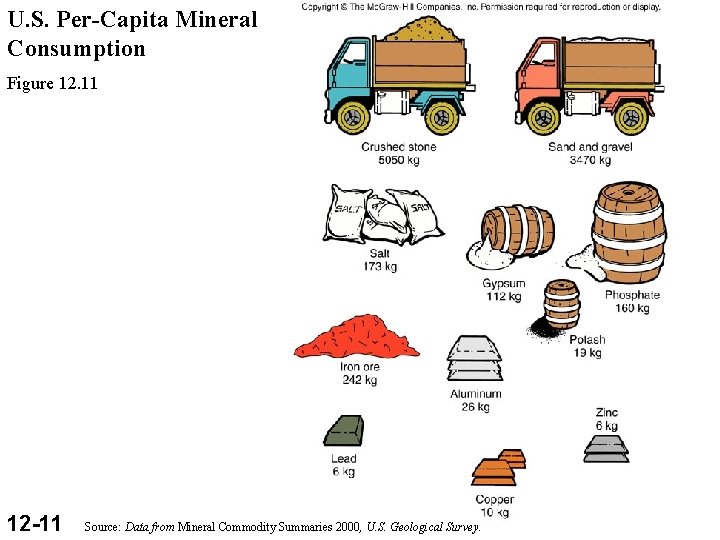
U. S. Per-Capita Mineral Consumption Figure 12. 11 12 -11 Source: Data from Mineral Commodity Summaries 2000, U. S. Geological Survey.
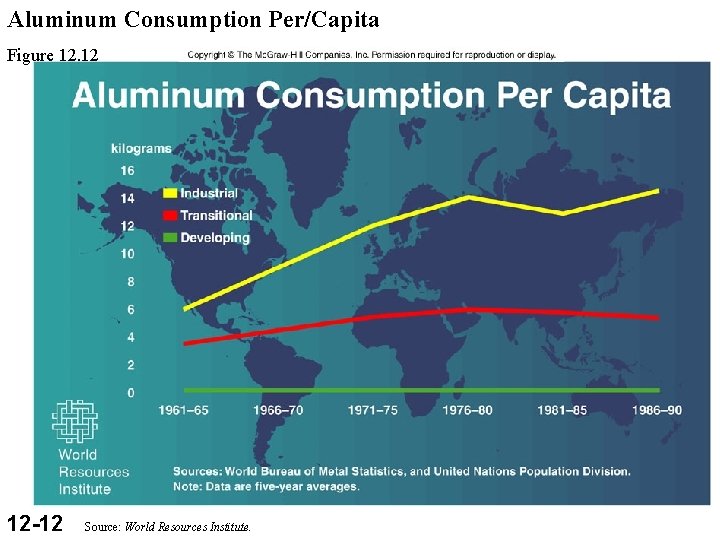
Aluminum Consumption Per/Capita Figure 12. 12 12 -12 Source: World Resources Institute.
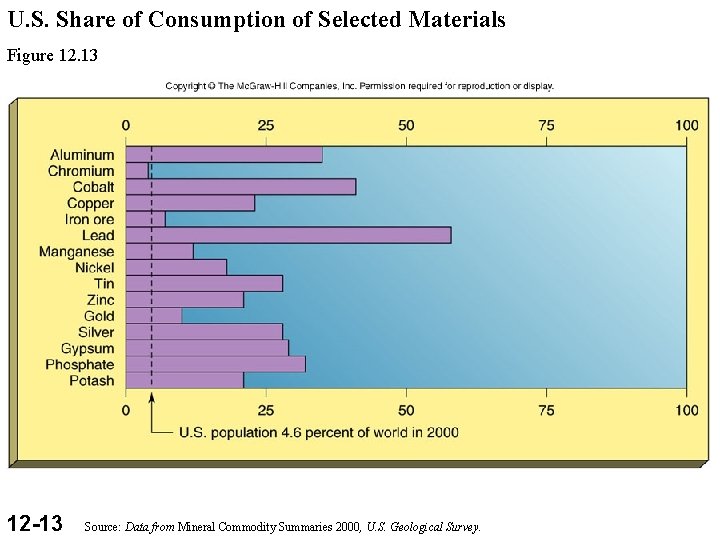
U. S. Share of Consumption of Selected Materials Figure 12. 13 12 -13 Source: Data from Mineral Commodity Summaries 2000, U. S. Geological Survey.
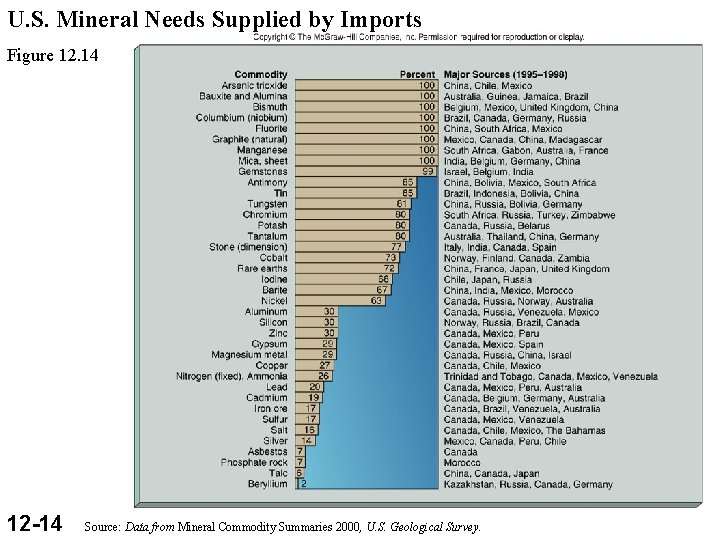
U. S. Mineral Needs Supplied by Imports Figure 12. 14 12 -14 Source: Data from Mineral Commodity Summaries 2000, U. S. Geological Survey.
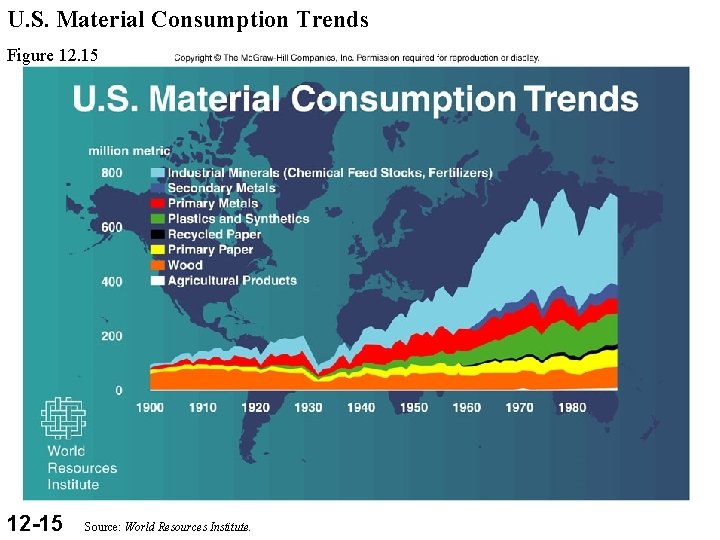
U. S. Material Consumption Trends Figure 12. 15 12 -15 Source: World Resources Institute.
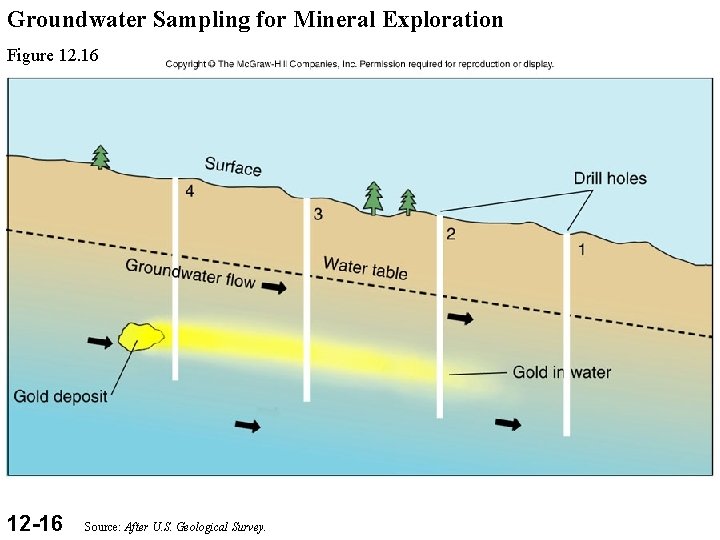
Groundwater Sampling for Mineral Exploration Figure 12. 16 12 -16 Source: After U. S. Geological Survey.
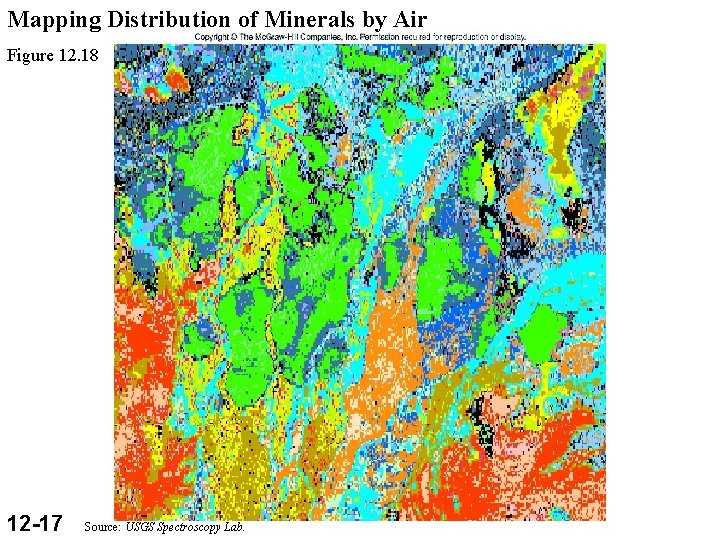
Mapping Distribution of Minerals by Air Figure 12. 18 12 -17 Source: USGS Spectroscopy Lab.
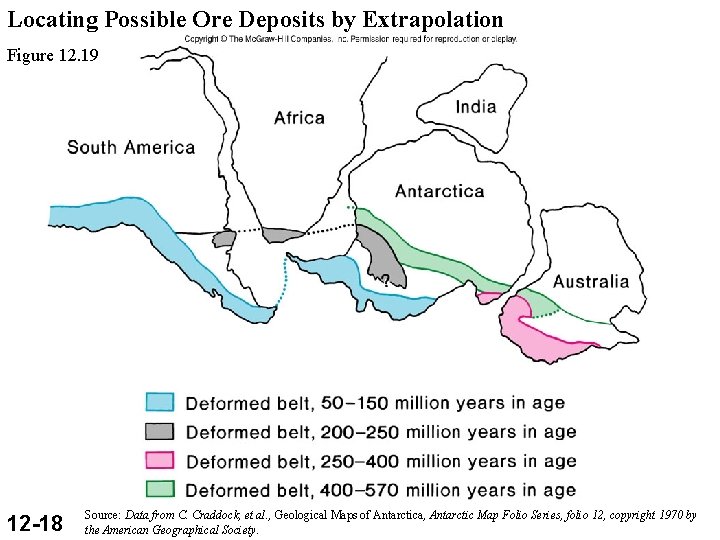
Locating Possible Ore Deposits by Extrapolation Figure 12. 19 12 -18 Source: Data from C. Craddock, et al. , Geological Maps of Antarctica, Antarctic Map Folio Series, folio 12, copyright 1970 by the American Geographical Society.
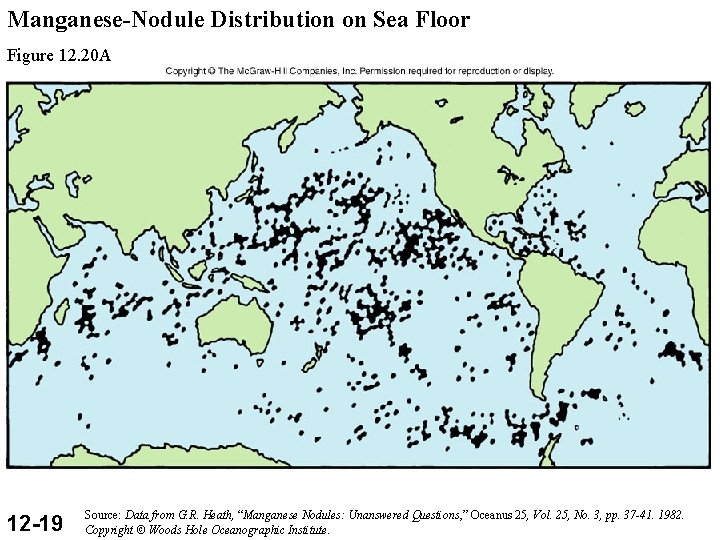
Manganese-Nodule Distribution on Sea Floor Figure 12. 20 A 12 -19 Source: Data from G. R. Heath, “Manganese Nodules: Unanswered Questions, ” Oceanus 25, Vol. 25, No. 3, pp. 37 -41. 1982. Copyright © Woods Hole Oceanographic Institute.
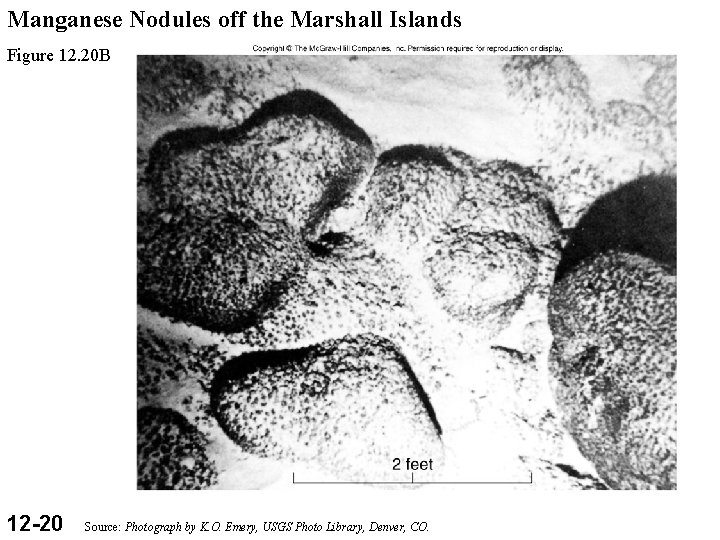
Manganese Nodules off the Marshall Islands Figure 12. 20 B 12 -20 Source: Photograph by K. O. Emery, USGS Photo Library, Denver, CO.
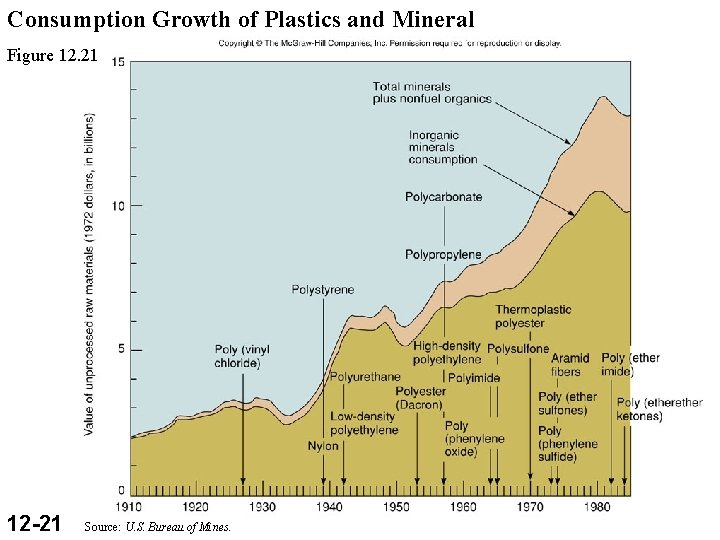
Consumption Growth of Plastics and Mineral Figure 12. 21 12 -21 Source: U. S. Bureau of Mines.
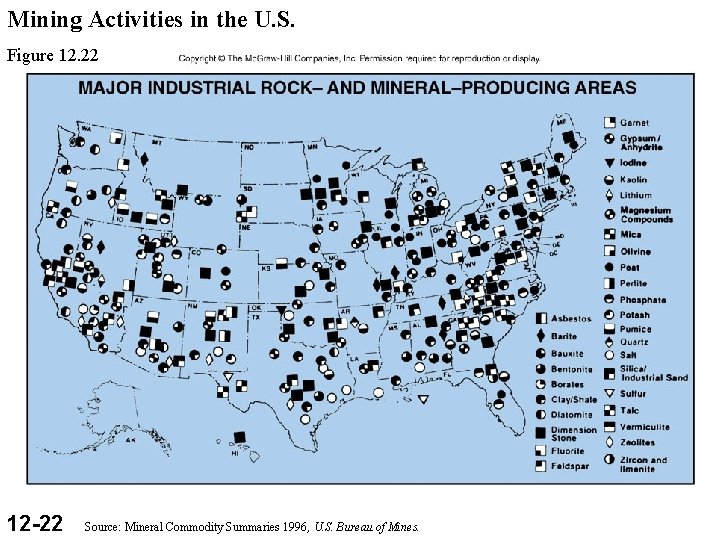
Mining Activities in the U. S. Figure 12. 22 12 -22 Source: Mineral Commodity Summaries 1996, U. S. Bureau of Mines.
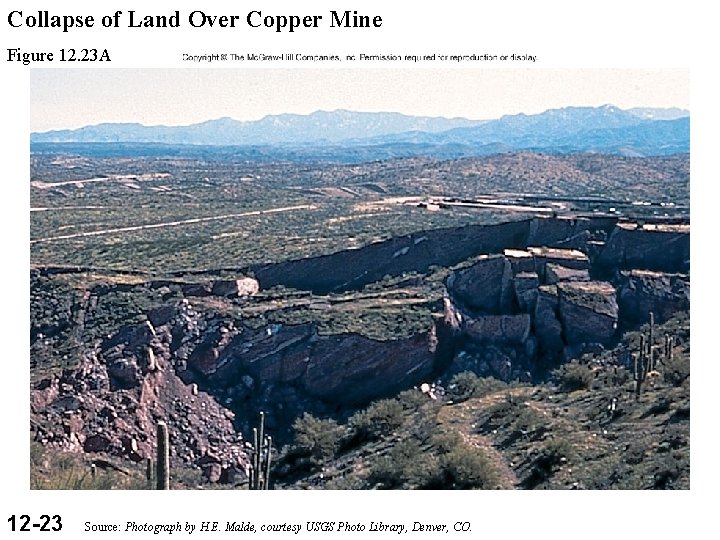
Collapse of Land Over Copper Mine Figure 12. 23 A 12 -23 Source: Photograph by H. E. Malde, courtesy USGS Photo Library, Denver, CO.
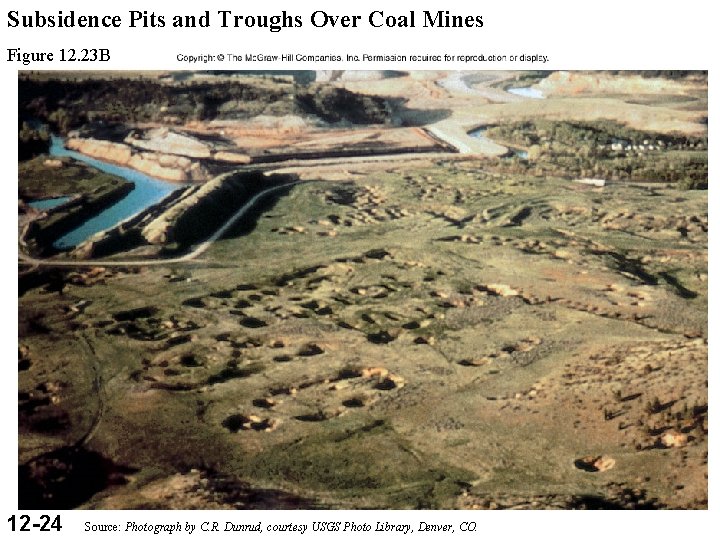
Subsidence Pits and Troughs Over Coal Mines Figure 12. 23 B 12 -24 Source: Photograph by C. R. Dunrud, courtesy USGS Photo Library, Denver, CO.
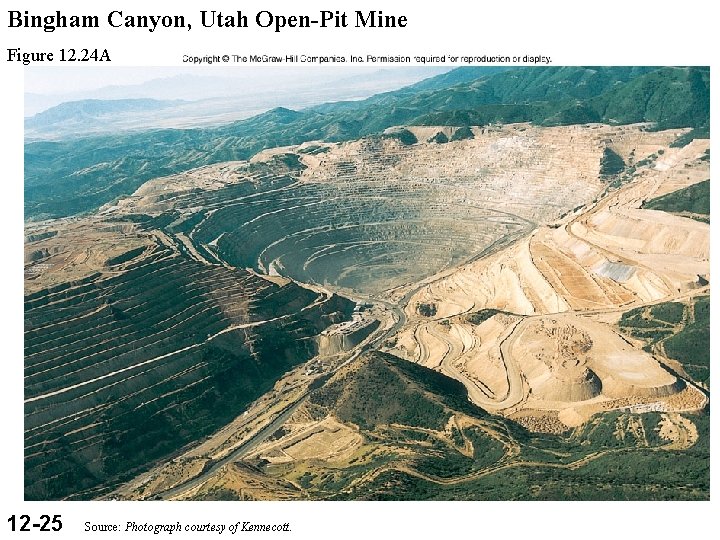
Bingham Canyon, Utah Open-Pit Mine Figure 12. 24 A 12 -25 Source: Photograph courtesy of Kennecott.
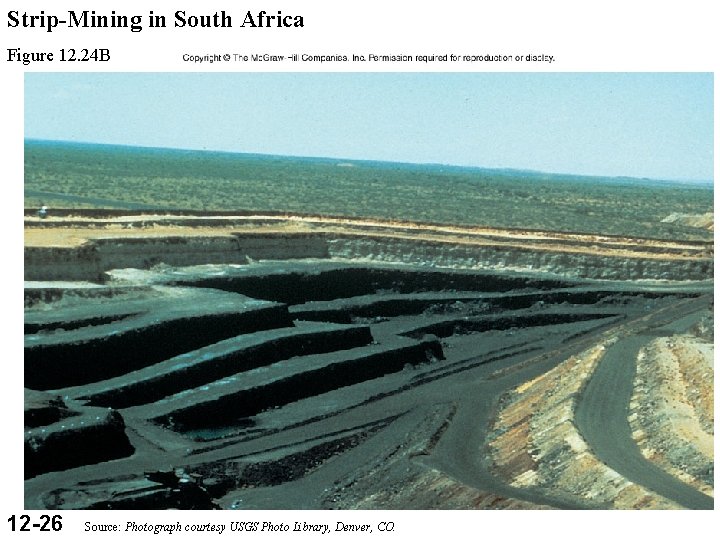
Strip-Mining in South Africa Figure 12. 24 B 12 -26 Source: Photograph courtesy USGS Photo Library, Denver, CO.
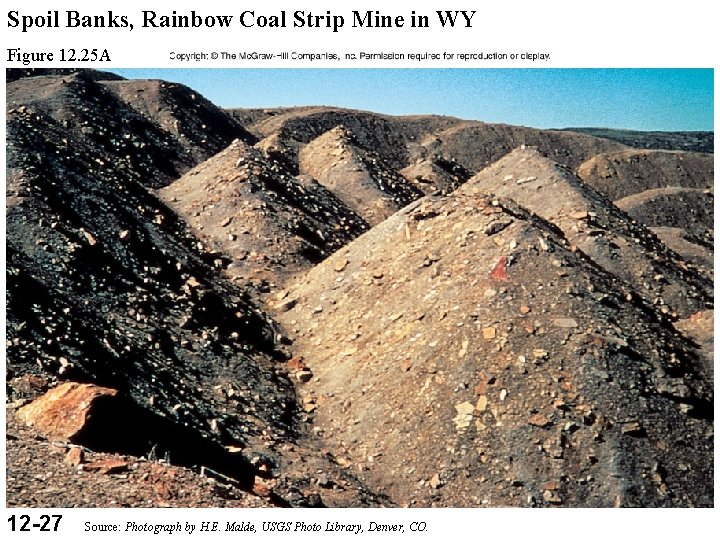
Spoil Banks, Rainbow Coal Strip Mine in WY Figure 12. 25 A 12 -27 Source: Photograph by H. E. Malde, USGS Photo Library, Denver, CO.
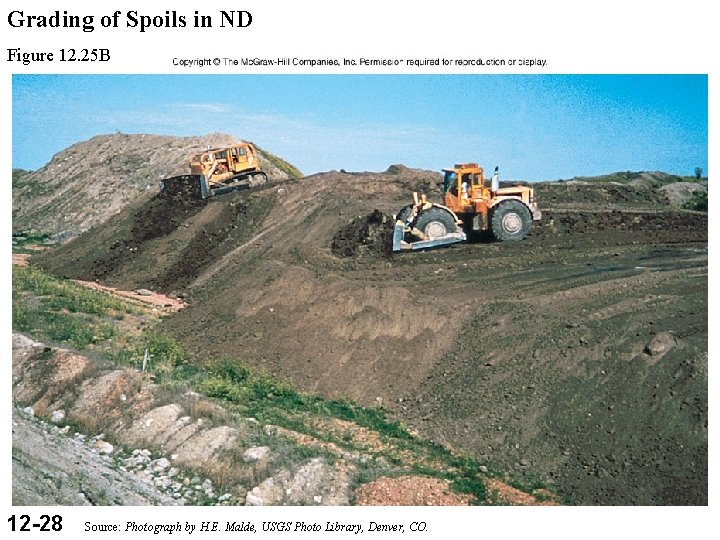
Grading of Spoils in ND Figure 12. 25 B 12 -28 Source: Photograph by H. E. Malde, USGS Photo Library, Denver, CO.
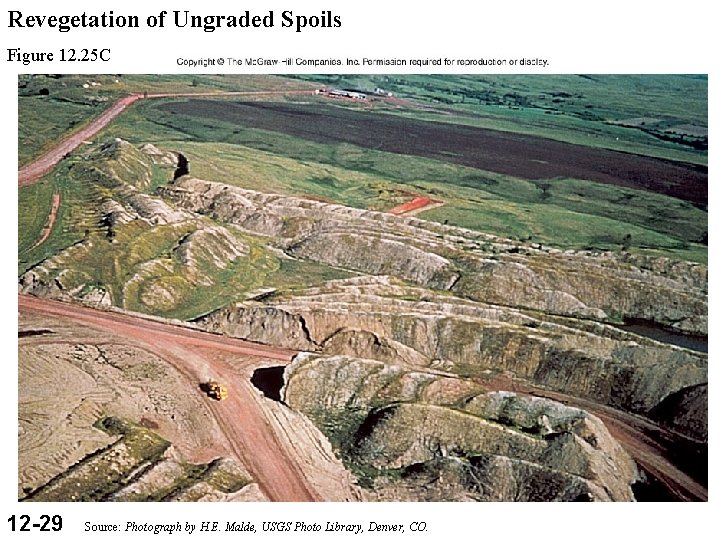
Revegetation of Ungraded Spoils Figure 12. 25 C 12 -29 Source: Photograph by H. E. Malde, USGS Photo Library, Denver, CO.
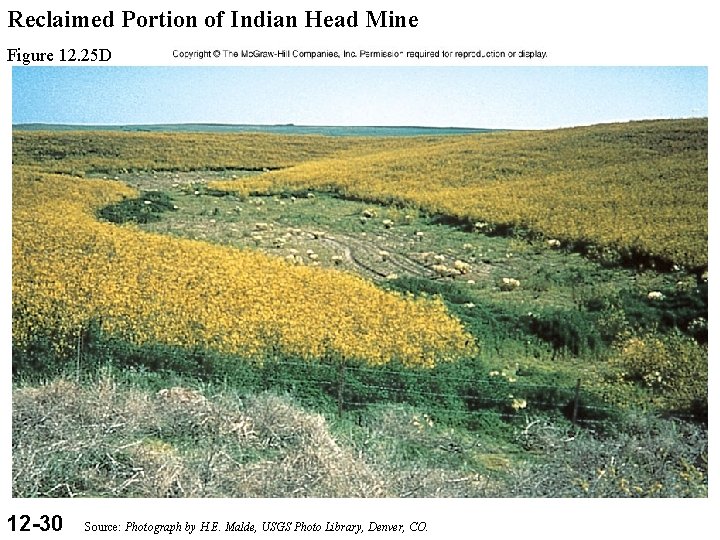
Reclaimed Portion of Indian Head Mine Figure 12. 25 D 12 -30 Source: Photograph by H. E. Malde, USGS Photo Library, Denver, CO.
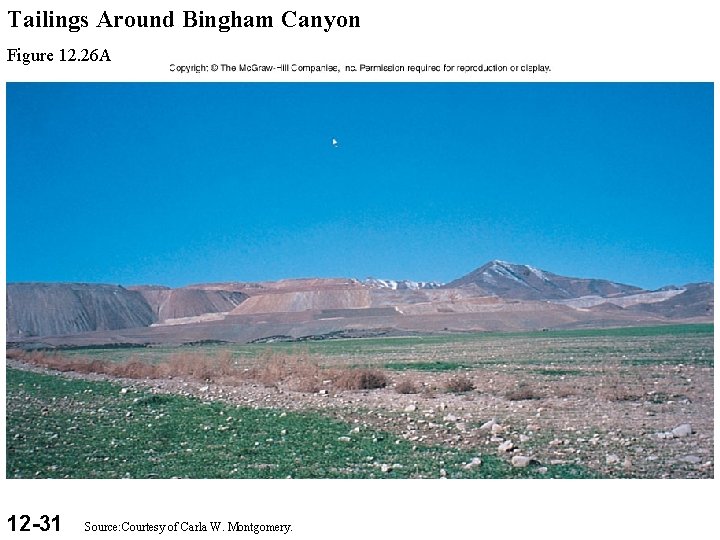
Tailings Around Bingham Canyon Figure 12. 26 A 12 -31 Source: Courtesy of Carla W. Montgomery.
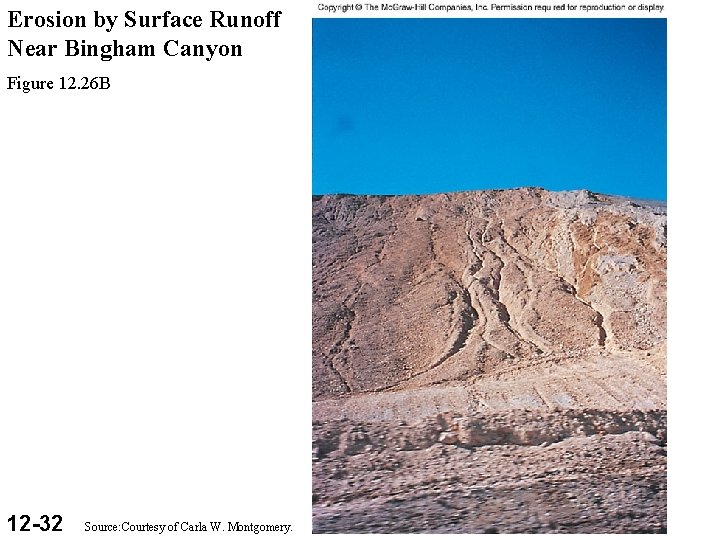
Erosion by Surface Runoff Near Bingham Canyon Figure 12. 26 B 12 -32 Source: Courtesy of Carla W. Montgomery.
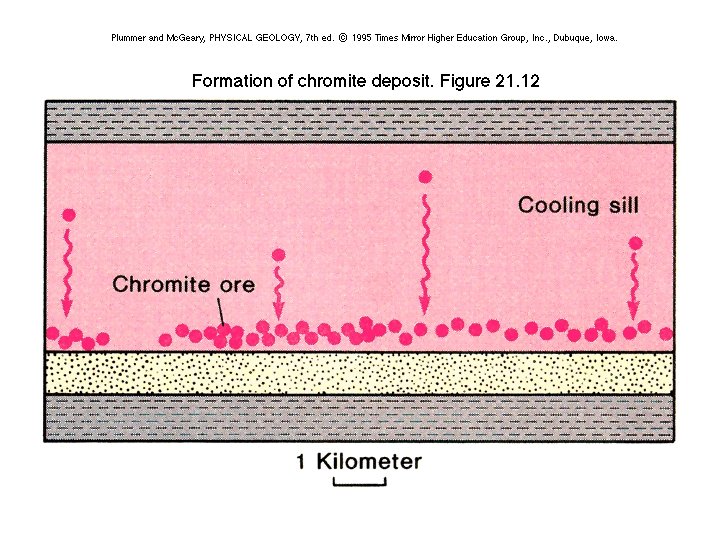
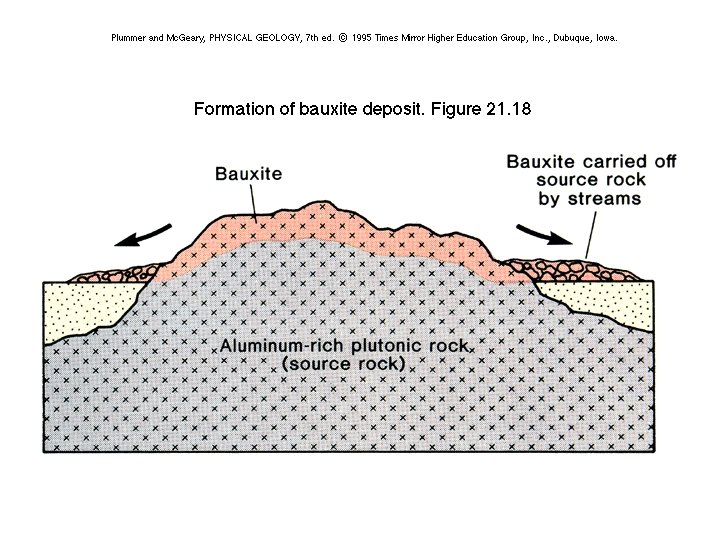
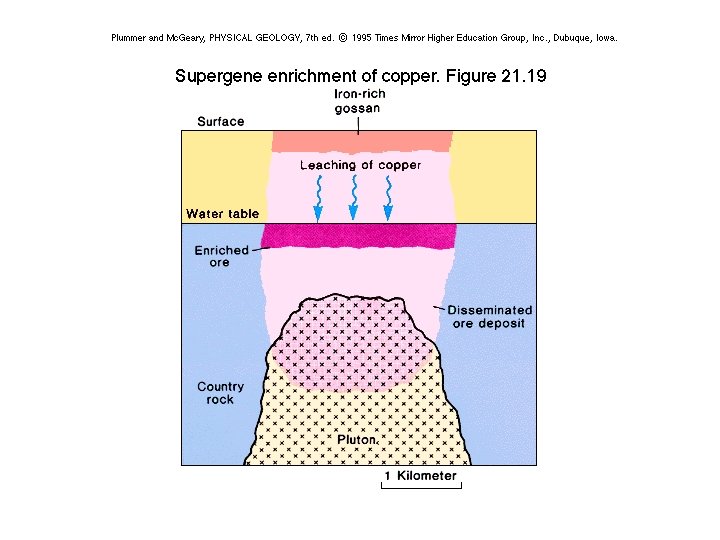
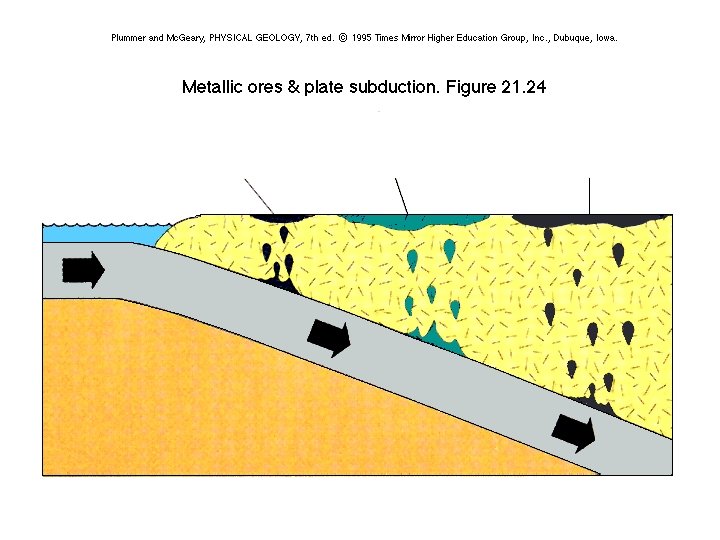
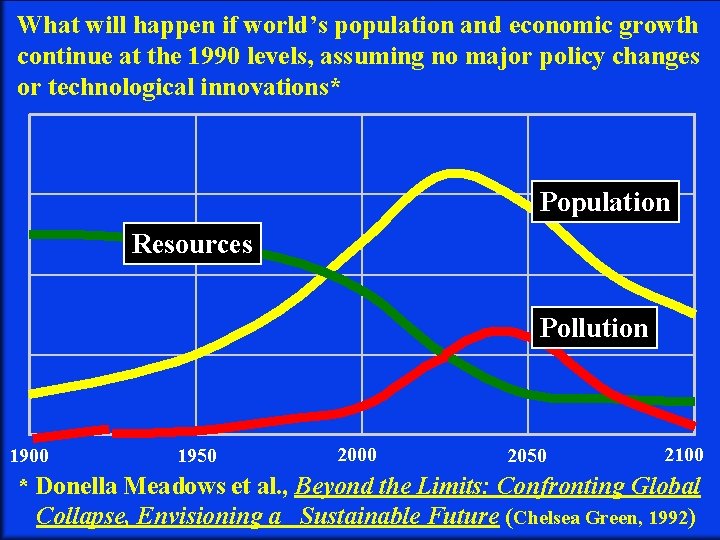
What will happen if world’s population and economic growth continue at the 1990 levels, assuming no major policy changes or technological innovations* Population Resources Pollution 1900 1950 2000 2050 2100 * Donella Meadows et al. , Beyond the Limits: Confronting Global Collapse, Envisioning a Sustainable Future (Chelsea Green, 1992)
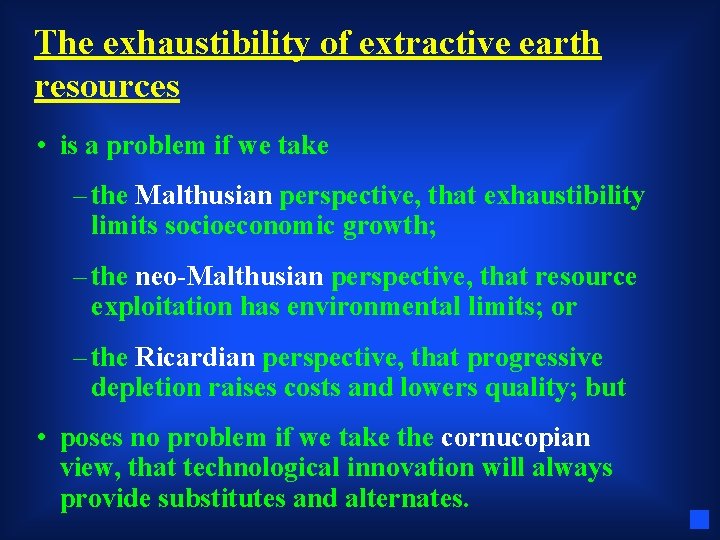
The exhaustibility of extractive earth resources • is a problem if we take – the Malthusian perspective, that exhaustibility limits socioeconomic growth; – the neo-Malthusian perspective, that resource exploitation has environmental limits; or – the Ricardian perspective, that progressive depletion raises costs and lowers quality; but • poses no problem if we take the cornucopian view, that technological innovation will always provide substitutes and alternates.
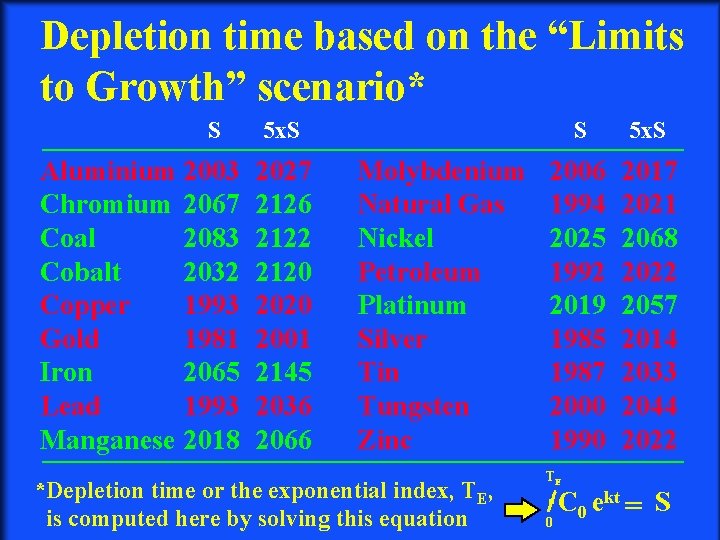
Depletion time based on the “Limits to Growth” scenario* S Aluminium 2003 Chromium 2067 Coal 2083 Cobalt 2032 Copper 1993 Gold 1981 Iron 2065 Lead 1993 Manganese 2018 5 x. S 2027 2126 2122 2120 2001 2145 2036 2066 Molybdenium Natural Gas Nickel Petroleum Platinum Silver Tin Tungsten Zinc *Depletion time or the exponential index, TE, is computed here by solving this equation S 5 x. S 2006 1994 2025 1992 2019 1985 1987 2000 1990 2017 2021 2068 2022 2057 2014 2033 2044 2022 TE 0 C 0 ekt = S
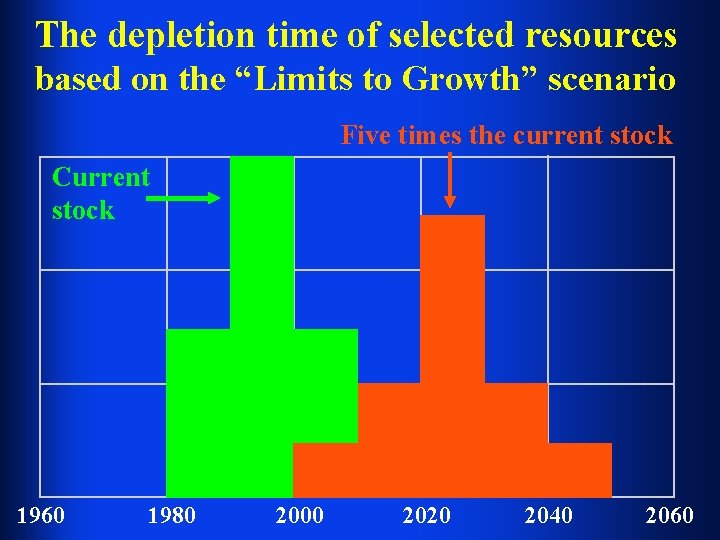
The depletion time of selected resources based on the “Limits to Growth” scenario Five times the current stock Current stock 1960 1980 2000 2020 2040 2060
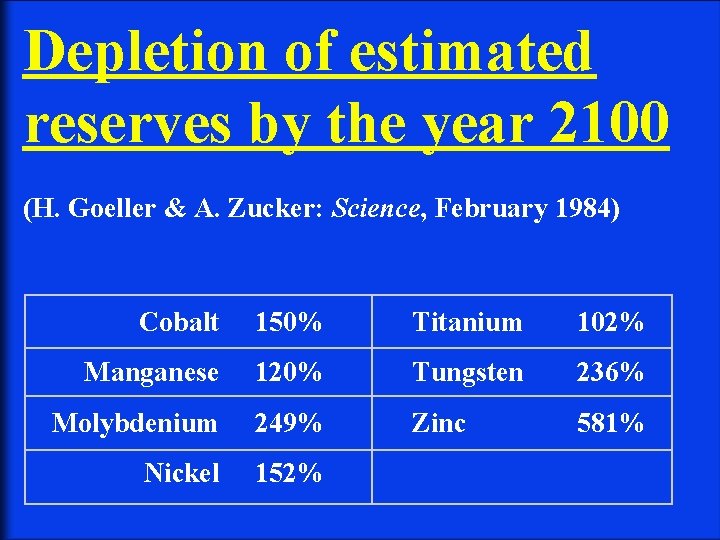
Depletion of estimated reserves by the year 2100 (H. Goeller & A. Zucker: Science, February 1984) Cobalt 150% Titanium 102% Manganese 120% Tungsten 236% Molybdenium 249% Zinc 581% Nickel 152%
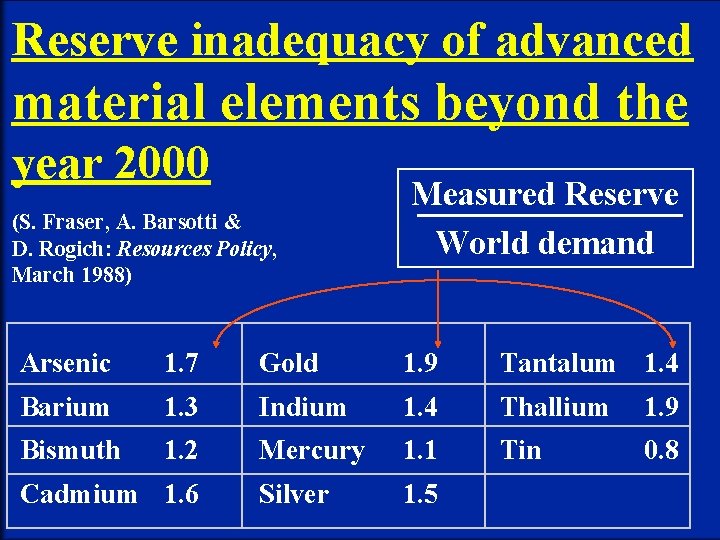
Reserve inadequacy of advanced material elements beyond the year 2000 (S. Fraser, A. Barsotti & D. Rogich: Resources Policy, March 1988) Measured Reserve World demand Arsenic 1. 7 Gold 1. 9 Tantalum 1. 4 Barium 1. 3 Indium 1. 4 Thallium 1. 9 Bismuth 1. 2 Mercury 1. 1 Tin 0. 8 Silver 1. 5 Cadmium 1. 6
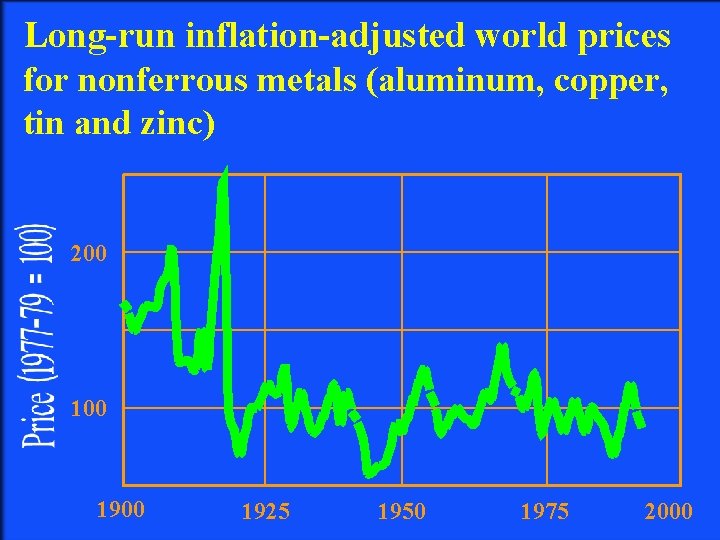
Long-run inflation-adjusted world prices for nonferrous metals (aluminum, copper, tin and zinc) 200 1900 1925 1950 1975 2000
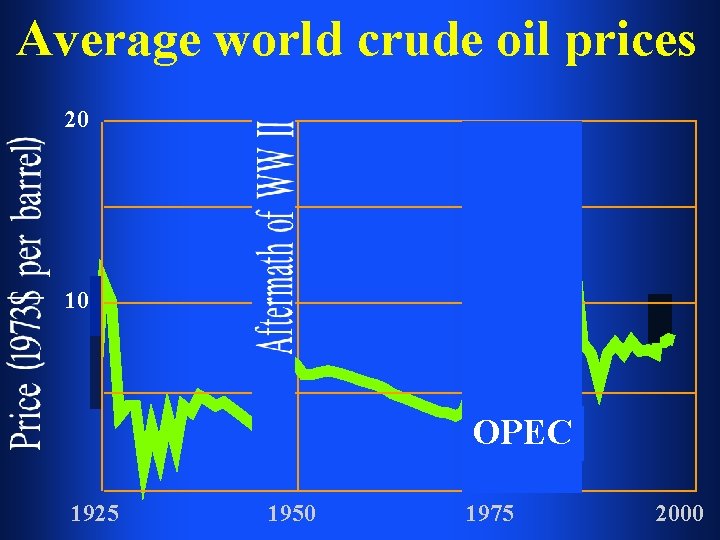
Average world crude oil prices 20 10 OPEC 1925 1950 1975 2000
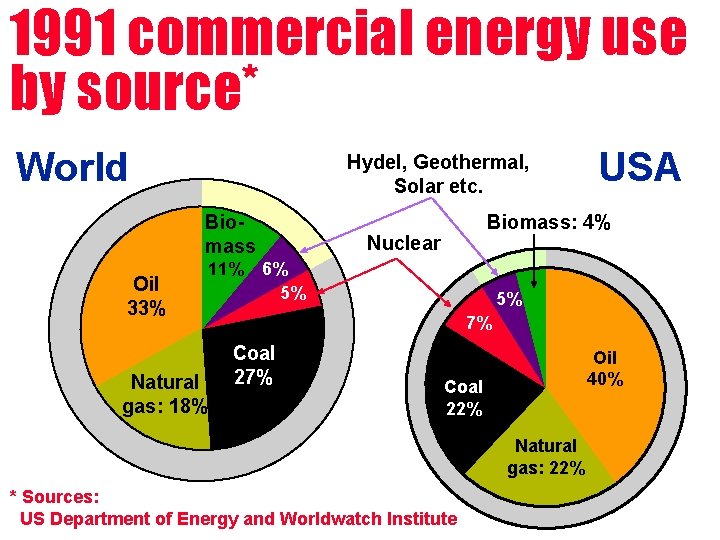
1991 commercial energy use by source* World Hydel, Geothermal, Solar etc. Biomass Oil 33% Biomass: 4% Nuclear 11% 6% 5% Natural gas: 18% USA 5% 7% Coal 27% Oil 40% Coal 22% Natural gas: 22% * Sources: US Department of Energy and Worldwatch Institute
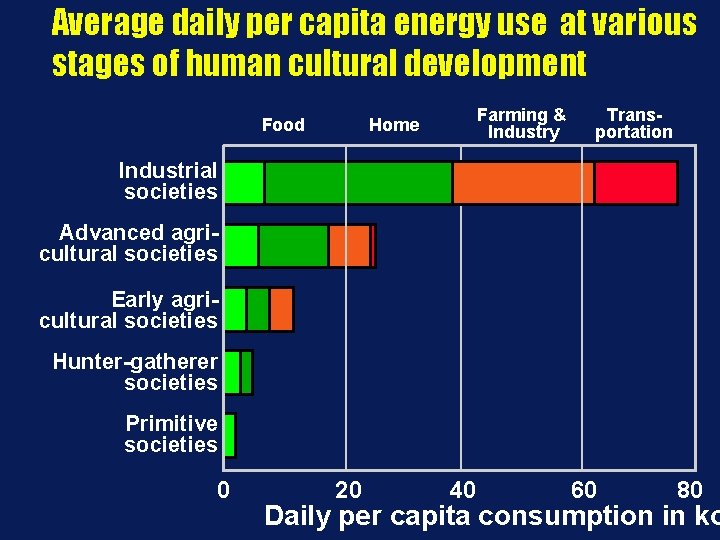
Average daily per capita energy use at various stages of human cultural development Food Farming & Industry Home Transportation Industrial societies Advanced agricultural societies Early agricultural societies Hunter-gatherer societies Primitive societies 0 20 40 60 80 Daily per capita consumption in kc
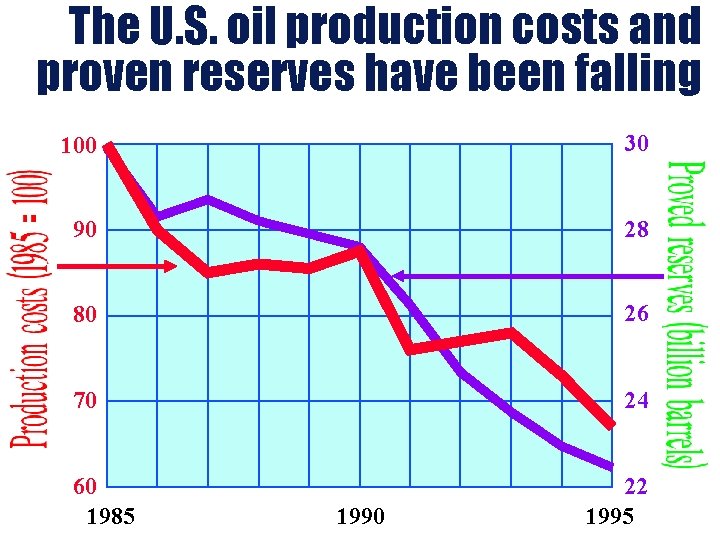
The U. S. oil production costs and proven reserves have been falling 100 30 90 28 80 26 70 24 60 1985 1990 22 1995
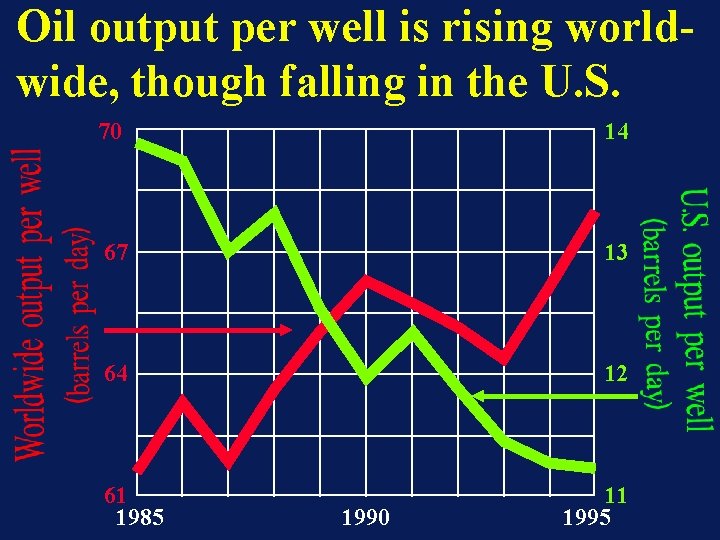
Oil output per well is rising worldwide, though falling in the U. S. 70 14 67 13 64 12 61 1985 1990 11 1995
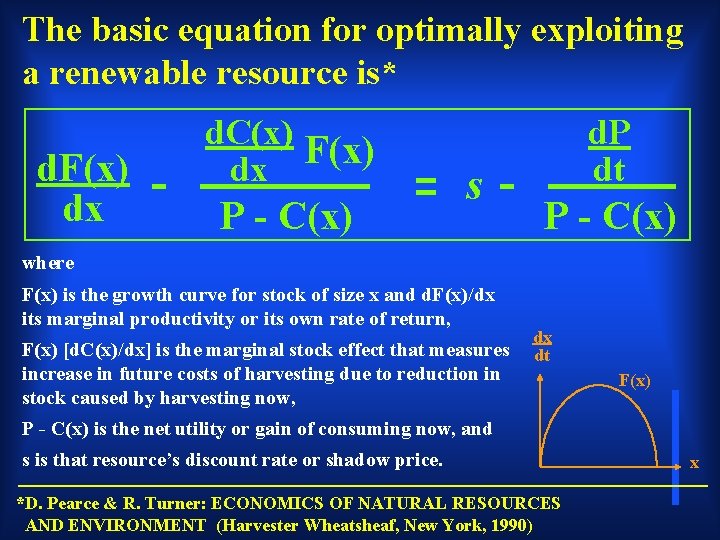
The basic equation for optimally exploiting a renewable resource is* d. F(x) dx d. C(x) F(x) dx P - C(x) s d. P dt P - C(x) where F(x) is the growth curve for stock of size x and d. F(x)/dx its marginal productivity or its own rate of return, F(x) [d. C(x)/dx] is the marginal stock effect that measures increase in future costs of harvesting due to reduction in stock caused by harvesting now, dx dt F(x) P - C(x) is the net utility or gain of consuming now, and s is that resource’s discount rate or shadow price. *D. Pearce & R. Turner: ECONOMICS OF NATURAL RESOURCES AND ENVIRONMENT (Harvester Wheatsheaf, New York, 1990) x
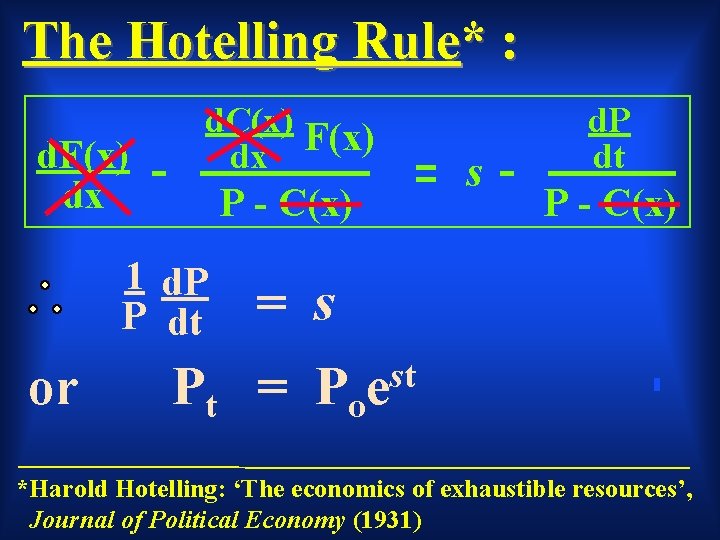
The Hotelling Rule* : d. F(x) dx d. C(x) F(x) dx P - C(x) 1 d. P P dt or s d. P dt P - C(x) = s Pt = Po st e *Harold Hotelling: ‘The economics of exhaustible resources’, Journal of Political Economy (1931)
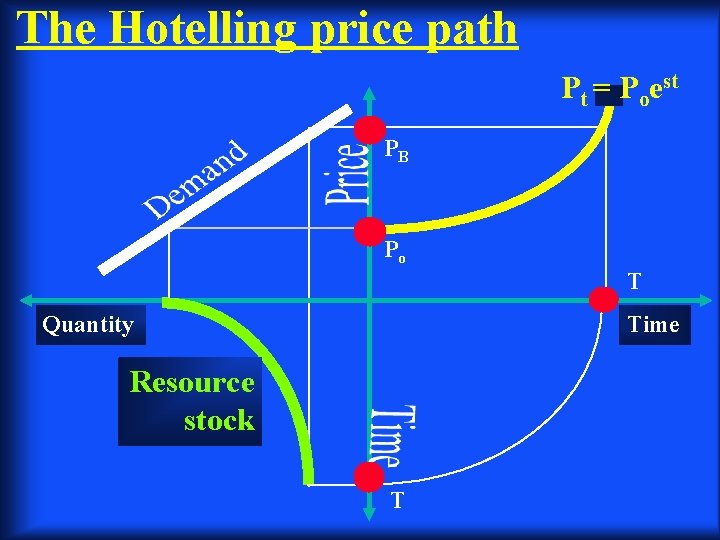
The Hotelling price path Pt = Poest PB Po T Quantity Time Resource stock T
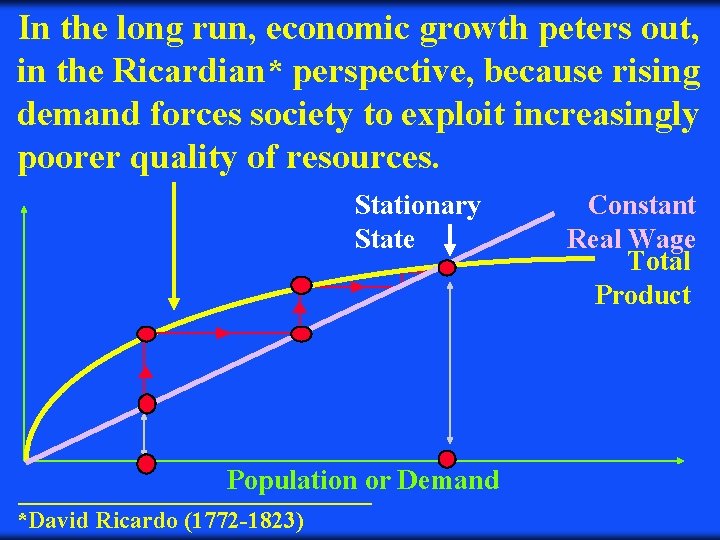
In the long run, economic growth peters out, in the Ricardian* perspective, because rising demand forces society to exploit increasingly poorer quality of resources. Stationary State Population or Demand *David Ricardo (1772 -1823) Constant Real Wage Total Product
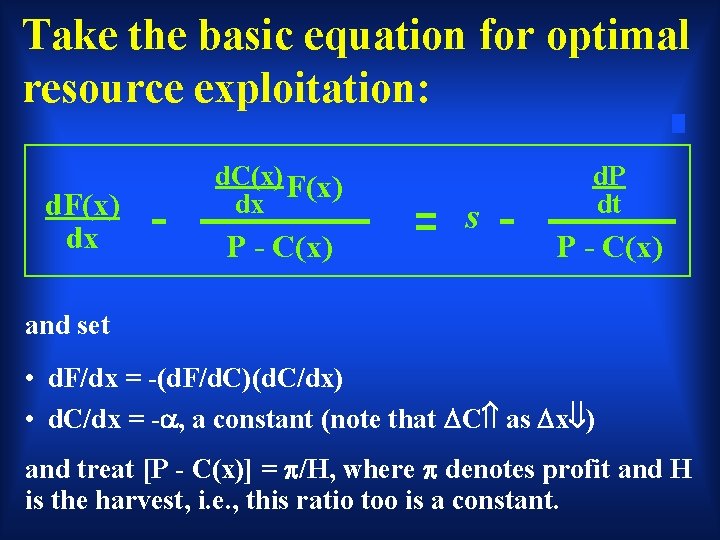
Take the basic equation for optimal resource exploitation: d. F(x) dx d. C(x) F(x) dx P - C(x) s d. P dt P - C(x) and set • d. F/dx = -(d. F/d. C)(d. C/dx) • d. C/dx = - , a constant (note that C as x ) and treat [P - C(x)] = /H, where denotes profit and H is the harvest, i. e. , this ratio too is a constant.
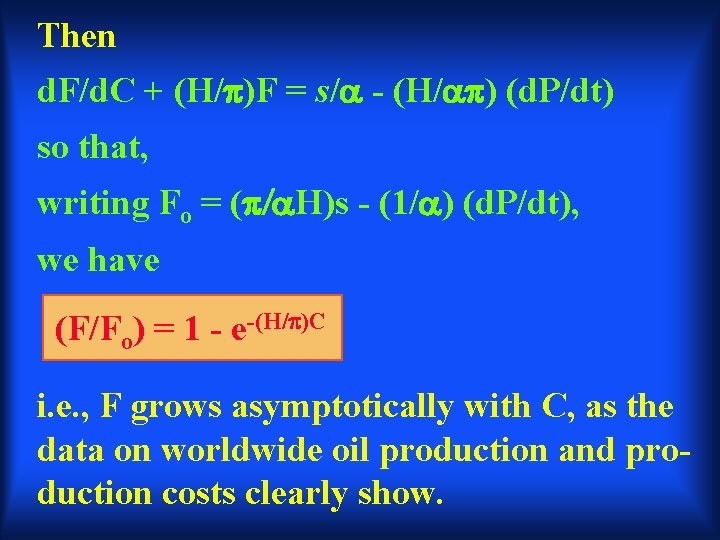
Then d. F/d. C + (H/ )F = s/ - (H/ ) (d. P/dt) so that, writing Fo = ( H)s - (1/ ) (d. P/dt), we have (F/Fo) = 1 - e-(H/ )C i. e. , F grows asymptotically with C, as the data on worldwide oil production and production costs clearly show.
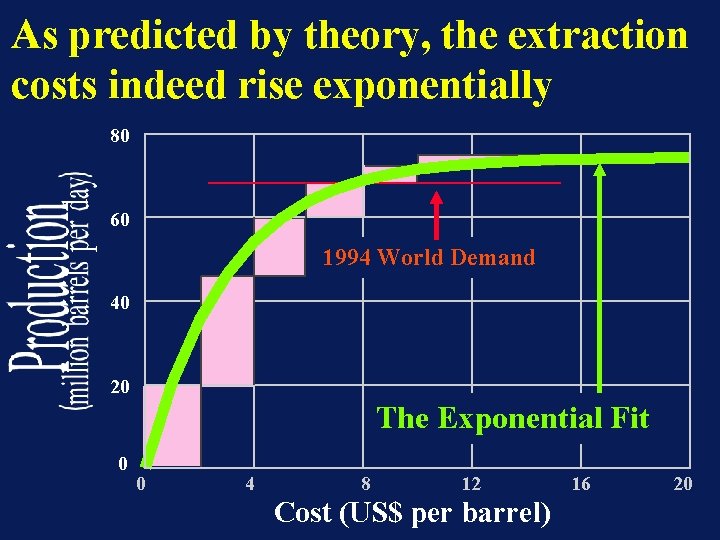
As predicted by theory, the extraction costs indeed rise exponentially 80 60 1994 World Demand 40 20 The Exponential Fit 0 0 4 8 12 Cost (US$ per barrel) 16 20
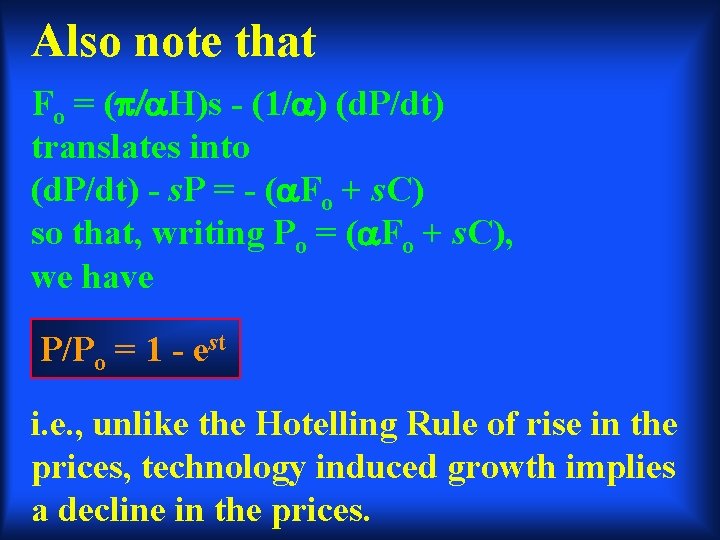
Also note that Fo = ( H)s - (1/ ) (d. P/dt) translates into (d. P/dt) - s. P = - ( Fo + s. C) so that, writing Po = ( Fo + s. C), we have P/Po = 1 - est i. e. , unlike the Hotelling Rule of rise in the prices, technology induced growth implies a decline in the prices.
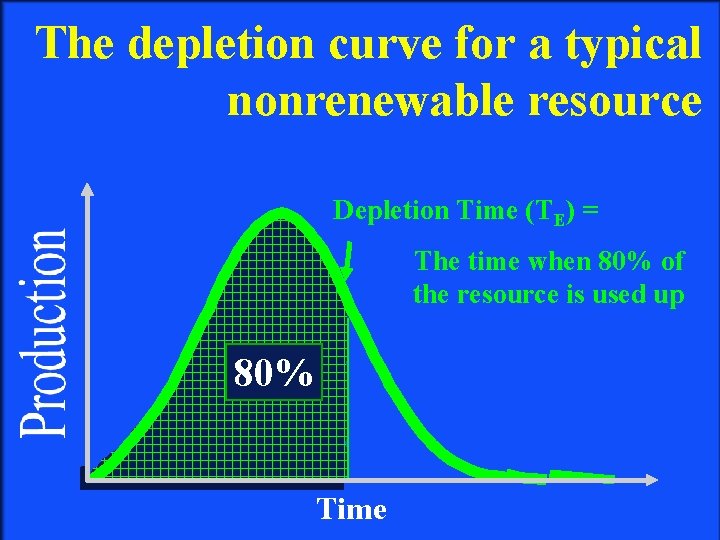
The depletion curve for a typical nonrenewable resource Depletion Time (TE) = The time when 80% of the resource is used up 80% Time
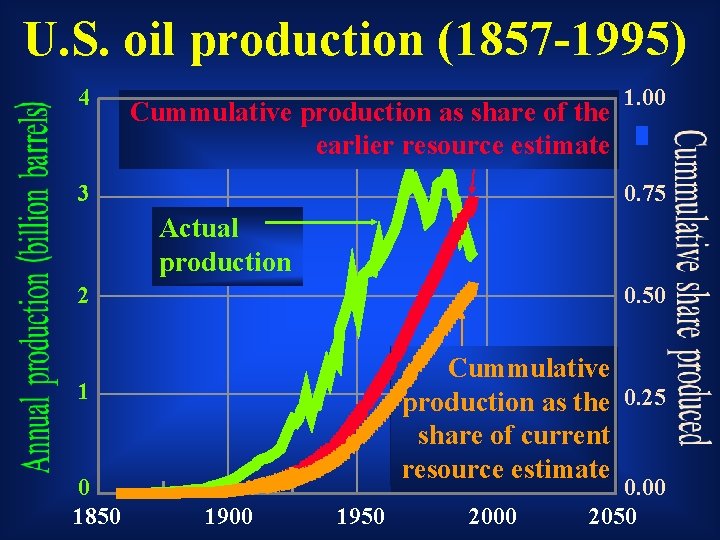
U. S. oil production (1857 -1995) 4 Cummulative production as share of the earlier resource estimate 1. 00 0. 75 3 Actual production 0. 50 2 Cummulative production as the 0. 25 share of current resource estimate 1 0 1850 1900 1950 2000 0. 00 2050
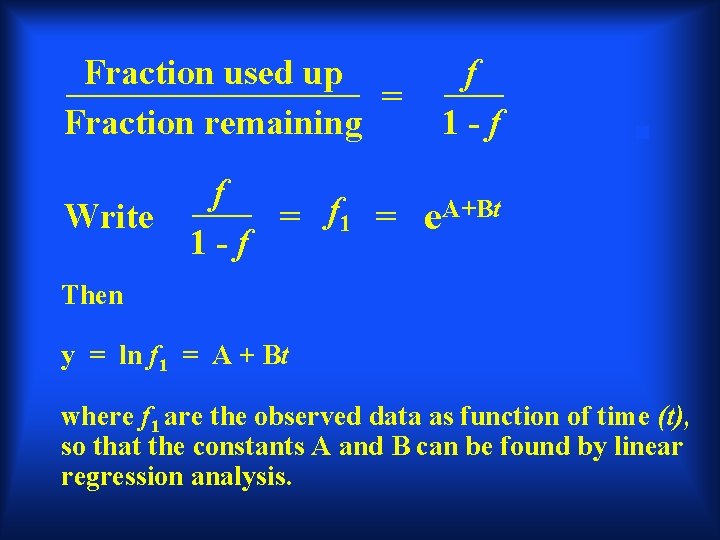
Fraction used up = Fraction remaining f 1 -f f Write = f 1 = e. A+Bt 1 -f Then y = ln f 1 = A + Bt where f 1 are the observed data as function of time (t), so that the constants A and B can be found by linear regression analysis.
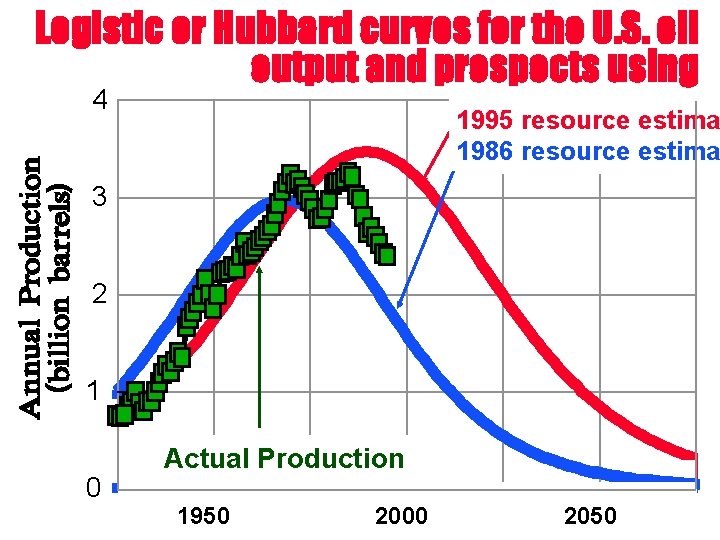
Logistic or Hubbard curves for the U. S. oil output and prospects using 4 1995 resource estima 1986 resource estima 3 2 1 0 Actual Production 1950 2000 2050
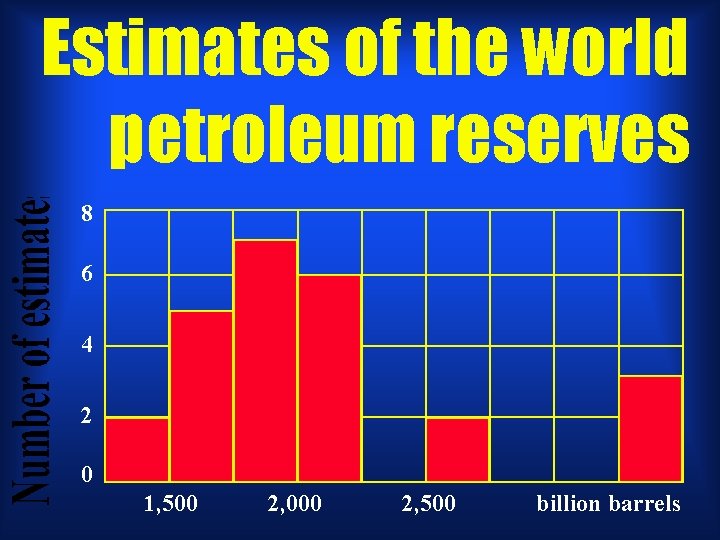
Estimates of the world petroleum reserves 8 6 4 2 0 1, 500 2, 000 2, 500 billion barrels
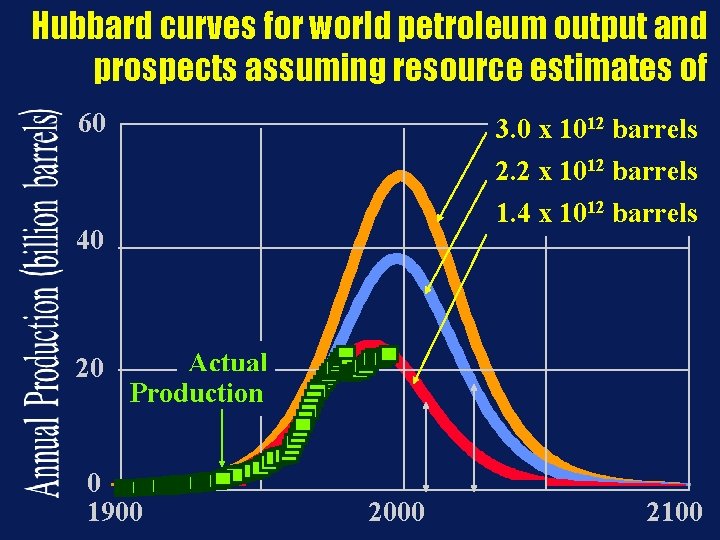
Hubbard curves for world petroleum output and prospects assuming resource estimates of 60 3. 0 x 1012 barrels 2. 2 x 10¹² barrels 1. 4 x 10¹² barrels 40 20 Actual Production 0 1900 2000 2100
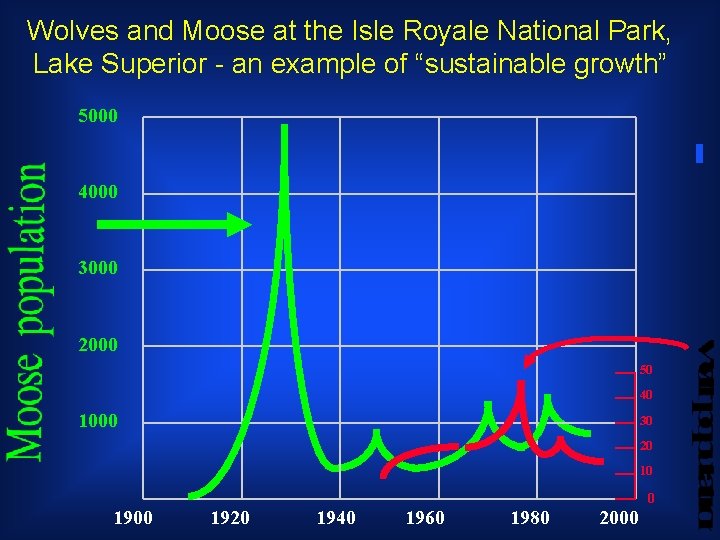
Wolves and Moose at the Isle Royale National Park, Lake Superior - an example of “sustainable growth” 5000 4000 3000 2000 50 40 1000 30 20 10 0 1900 1920 1940 1960 1980 2000
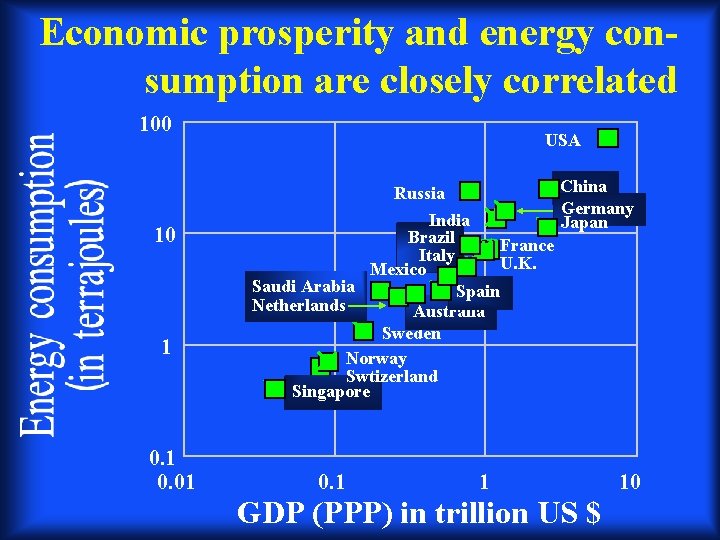
Economic prosperity and energy consumption are closely correlated 100 USA Russia 10 1 0. 01 India Brazil France Italy U. K. Mexico Saudi Arabia Spain Netherlands Australia Sweden Norway Swtizerland Singapore 0. 1 China Germany Japan 1 GDP (PPP) in trillion US $ 10
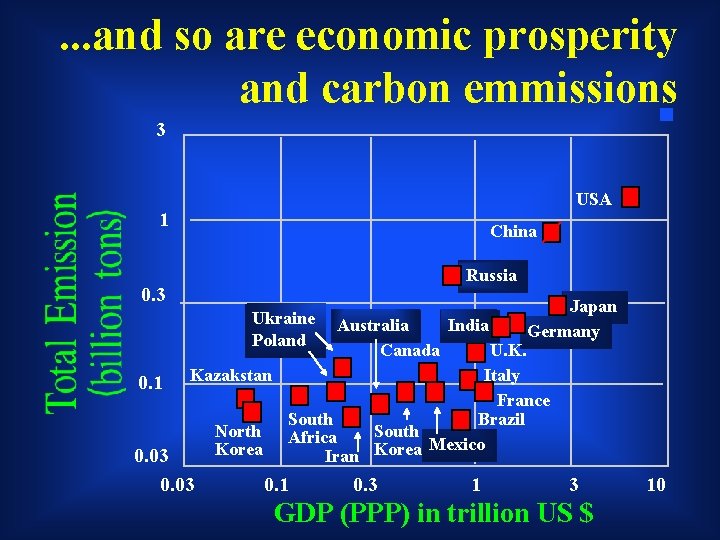
. . . and so are economic prosperity and carbon emmissions 3 USA 1 China Russia 0. 3 Japan Germany Ukraine Poland 0. 1 Australia India Canada U. K. Kazakstan Italy France South Brazil North South Africa Mexico Korea Iran Korea 0. 03 0. 1 0. 3 1 3 GDP (PPP) in trillion US $ 10

Thank You!
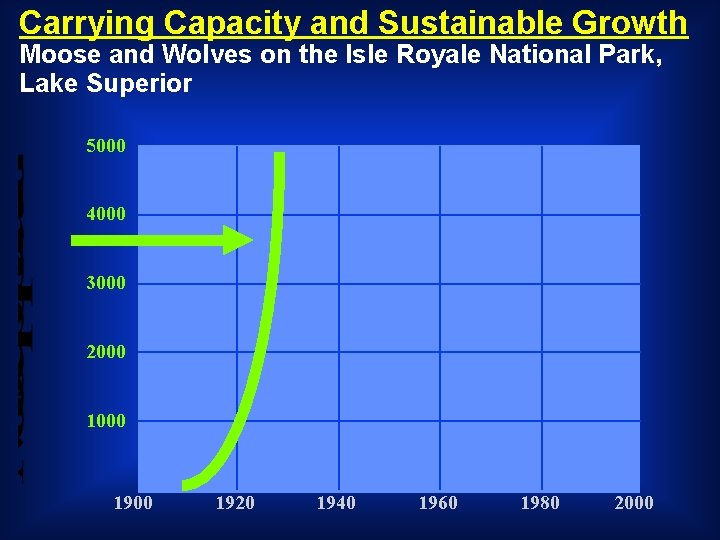
Carrying Capacity and Sustainable Growth Moose and Wolves on the Isle Royale National Park, Lake Superior 5000 4000 3000 2000 1900 1920 1940 1960 1980 2000
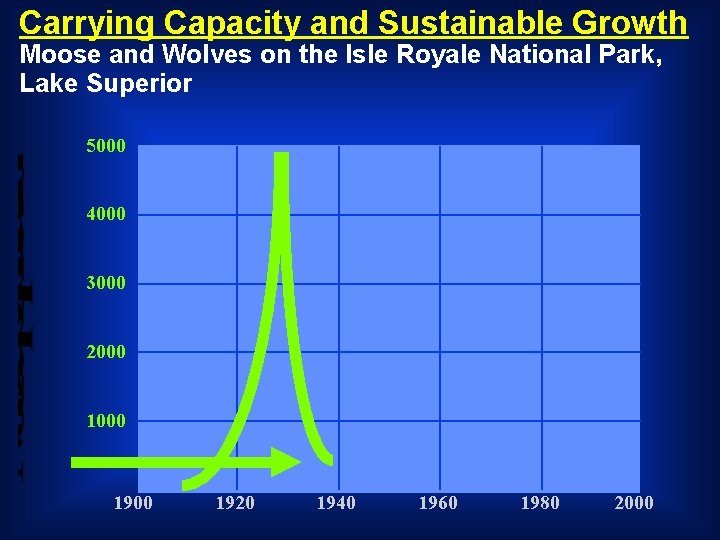
Carrying Capacity and Sustainable Growth Moose and Wolves on the Isle Royale National Park, Lake Superior 5000 4000 3000 2000 1900 1920 1940 1960 1980 2000
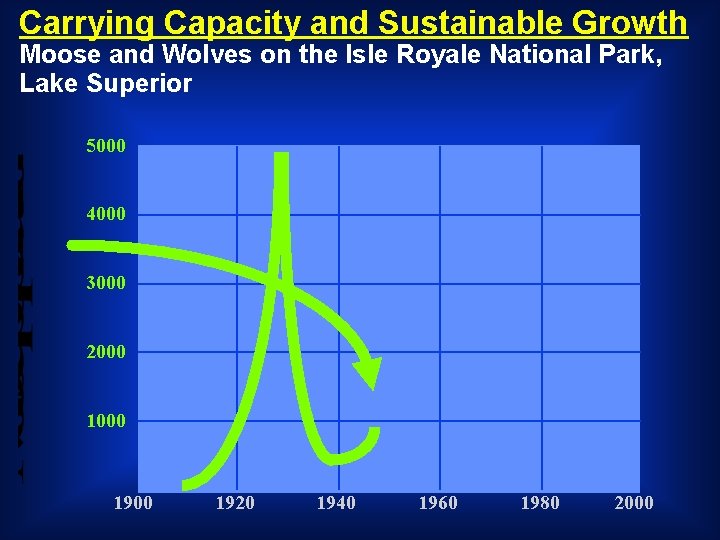
Carrying Capacity and Sustainable Growth Moose and Wolves on the Isle Royale National Park, Lake Superior 5000 4000 3000 2000 1900 1920 1940 1960 1980 2000
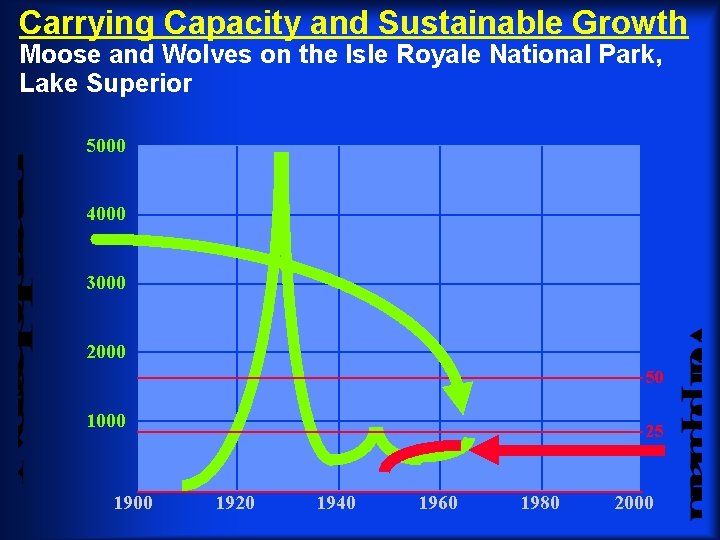
Carrying Capacity and Sustainable Growth Moose and Wolves on the Isle Royale National Park, Lake Superior 5000 4000 3000 2000 50 1000 1900 25 1920 1940 1960 1980 2000
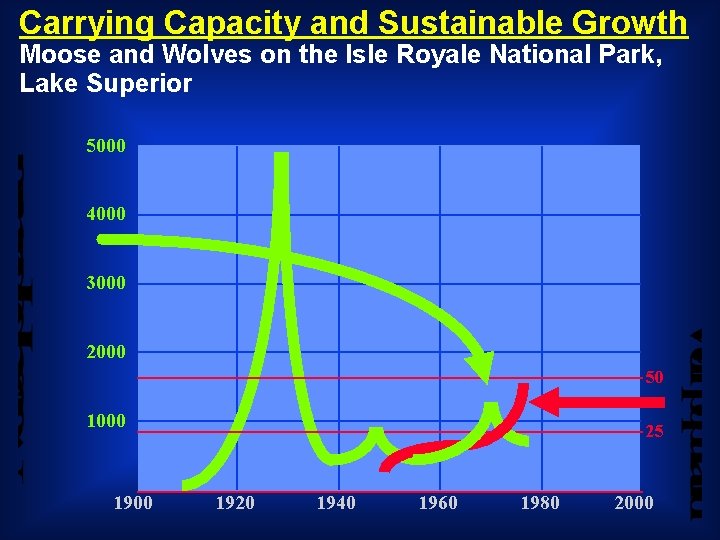
Carrying Capacity and Sustainable Growth Moose and Wolves on the Isle Royale National Park, Lake Superior 5000 4000 3000 2000 50 1000 1900 25 1920 1940 1960 1980 2000
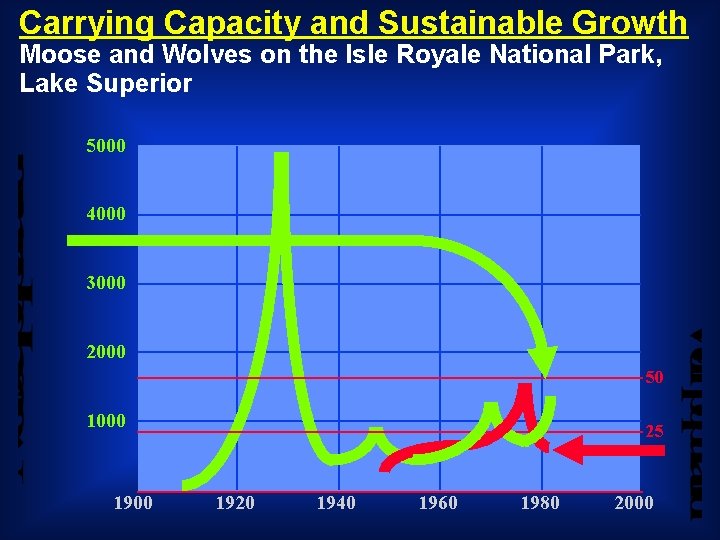
Carrying Capacity and Sustainable Growth Moose and Wolves on the Isle Royale National Park, Lake Superior 5000 4000 3000 2000 50 1000 1900 25 1920 1940 1960 1980 2000
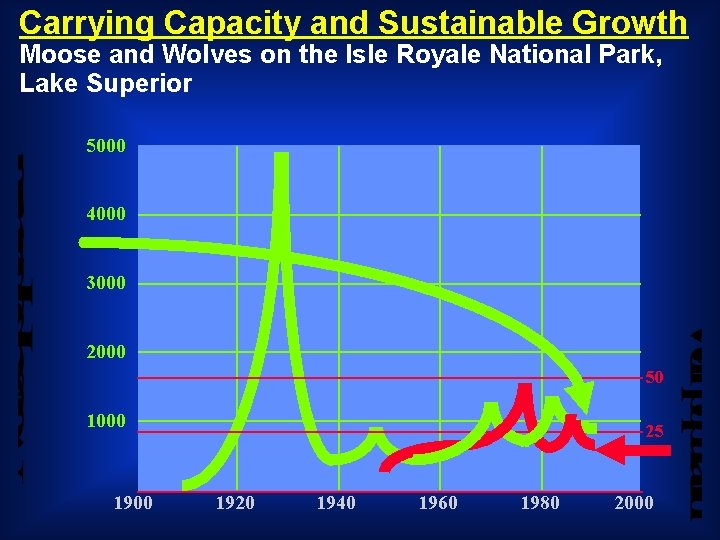
Carrying Capacity and Sustainable Growth Moose and Wolves on the Isle Royale National Park, Lake Superior 5000 4000 3000 2000 50 1000 1900 25 1920 1940 1960 1980 2000
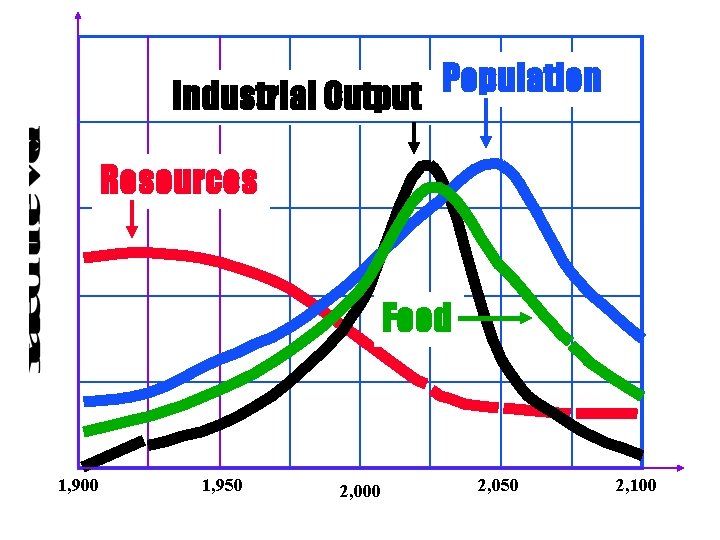
Population Industrial Output Resources Food 1, 900 1, 950 2, 000 2, 050 2, 100
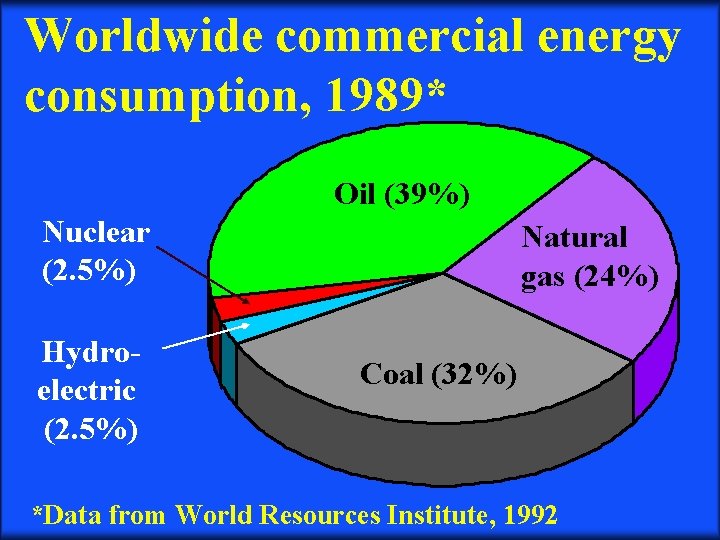
Worldwide commercial energy consumption, 1989* Oil (39%) Nuclear (2. 5%) Hydroelectric (2. 5%) Natural gas (24%) Coal (32%) *Data from World Resources Institute, 1992
- Slides: 101