EARLY PREDICTION OF POSTACUTE CARE DISCHARGE DISPOSITION USING

 are lengthier")


")


 ROC curve 1 LDA")

 Total")


- Slides: 20
EARLY PREDICTION OF POST-ACUTE CARE DISCHARGE DISPOSITION USING PREDICTIVE ANALYTICS -- An Opportunity to Minimize Inpatient Length of Stay
MOTIVATION • Hospital deferments for patients squared to post- acute care (PAC) are lengthier and expensive than routine discharges [1] [2]. • The underlying reasons for the extended stays and increased costs are influenced by complex medical conditions [6] [7] [8], and delayed PAC facility placement. • The Institute for Healthcare Improvement’s white paper suggests advance planning, coordination and development of partnership with AR and SNF to convalesce patient flow [9]. However, no significant research has been done to address advance PAC discharge planning.
MOTIVATION CONTINUED • Patient's medical insurance coverage plays a desperate role in determining their PAC discharge disposition. • At Unity. Point Health, retrieving a patient's insurance coverage information accedes the PAC discharge disposition process and inpatient length of stay by four days.
CONTRIBUTION • In this study, we focus on developing a prediction model using machine learning algorithm that can be deployed as a CDSS for advance PAC discharge disposition planning as suggested by the Institute for Healthcare Improvement. Advance PAC discharge disposition planning will identify patients eligible for postacute services (AR or SNF) based on their initial nursing assessment. • At present, 6 -Clicks is the only effective and user-friendly tool developed by the Cleveland Clinic Health System [13] that helps in PAC discharge disposition planning [14]. However, 6 -Clicks does not focus on advance PAC discharge planning and fails to effectively classify patients requiring AR and SNF. • At Unity. Point Health, 6 -Click’s classification accuracy was found to be twenty percent.
METHODOLOGY • Group discussion / Survey and problem identification, (25 PACFs and 2 RN) • Data collection, (Manual chart abstraction) • Data preprocessing, and • Model selection and measuring its impact.
DATA VISUALIZATION • Age • Gender • Braden Scale Score • Hester Davis Fall Risk • Discharge Type
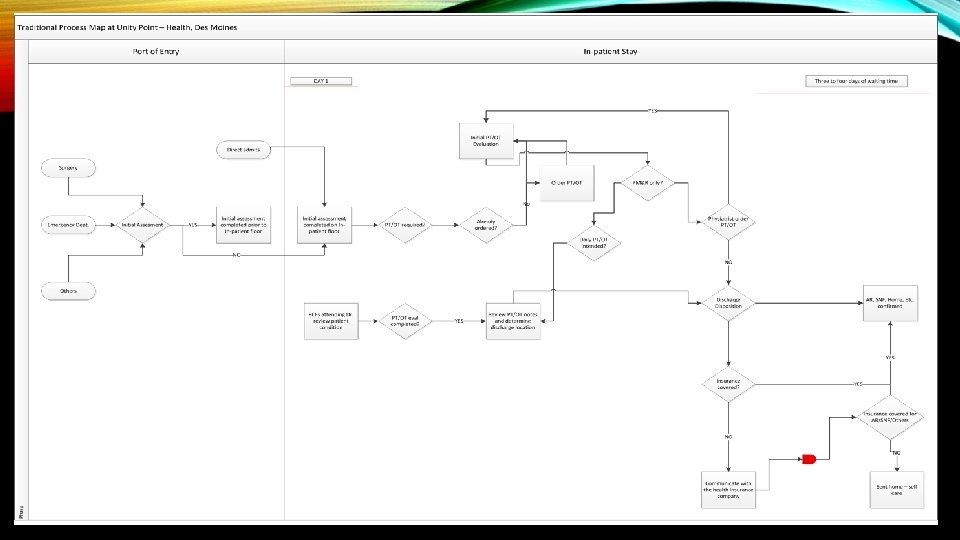
FINDINGS – TRADITIONAL METHOD The department lacks any defined process map The figure was developed based on information gathered from the group discussion and might not include all detailed steps involved in actual practice.
FINDINGS – AGE DISTRIBUTION • Distribution of Age against Discharge type. The blue histogram illustrates the age of patients discharged to AR and the red histogram shows the age of patients discharged to SNF. It can be observed that elder people were more likely to be discharged to SNF. This is due to the likelihood of younger patient’s ability tolerate three hours of therapy
FINDINGS- AGE VS GENDER • This is a pictorial representation of age versus gender. The blue histogram shows the age of the female patients and the red histogram represents the age distribution of male patients.
FINDINGS-AGE VS BRADEN SCALE • This represents the relationship between patient's age and their Braden scale score. The blue surface shows the Braden scale score for AR patients and the red surface shows the same for SNF patients. The patients discharged to SNF has higher Braden Scale score than that of AR patients.
FINDINGS-AGE VS HESTERDAVIS RISK • This shows the relationship between Hester-Davis fall risk and patient's age. The blue surface shows the Hester-Davis fall risk for AR patients and the red surface depicts the same for SNF patients have higher Hester-Davis fall risk than that of AR patients
Sl. Model Number COMPARATIVE ANALYSIS Overall Area under accuracy (%) ROC curve 1 LDA 83. 33 0. 79 2 CHAID 84. 16 0. 81 3 RT 72. 50 0. 68 4 LSVM 76. 66 0. 70 5 CART 80. 00 0. 51
CHI-SQUARED AUTOMATIC INTERACTION DETECTOR ALGORITHM • CHAID tree. It takes: “Hester-Davis fall risk score”, “Hypertension”, “Scalp laceration”, “Abnormality of gait”, “Osteoarthritis”, and “none” (no neurological condition) as the top six significant input variables with the p-value less than 0. 05
IMPACT OF CHAID Medical insurance confirmation PAC discharge method PAC service (average time) Total time (average) (average time) Traditional method 5 days 4 days 9 days 0 days 5 days After implementing CHAID (PAC service: day 1 through day 5) Medical insurance confirmation (day 1 through day 4) Total reduction in time (average) 4 days (44. 44%)
IMPACT OF CHAID CONTINUED • The CHAID model is able to identify eligible AR and NSF patients during the initial nursing assessment phase and thus enables the hospital to initiate communication with the insurance company from the very first day of Inpatient stay which initial was left for the end. Thus PT/OT evaluations, continued nursing assessments, and all other essential clinical activities can be processed meanwhile the medical insurance company confirms the patient’s insurance coverage. Thus, the patient will not have to wait extra four days to get insurance confirmation from the insurance provider after the doctor recommends the discharge location. Moreover, this model does not interfere with any medical and clinical process rather, encourages and enables advanced PAC discharge planning by parallelly and proactively gauging medical insurance coverage.
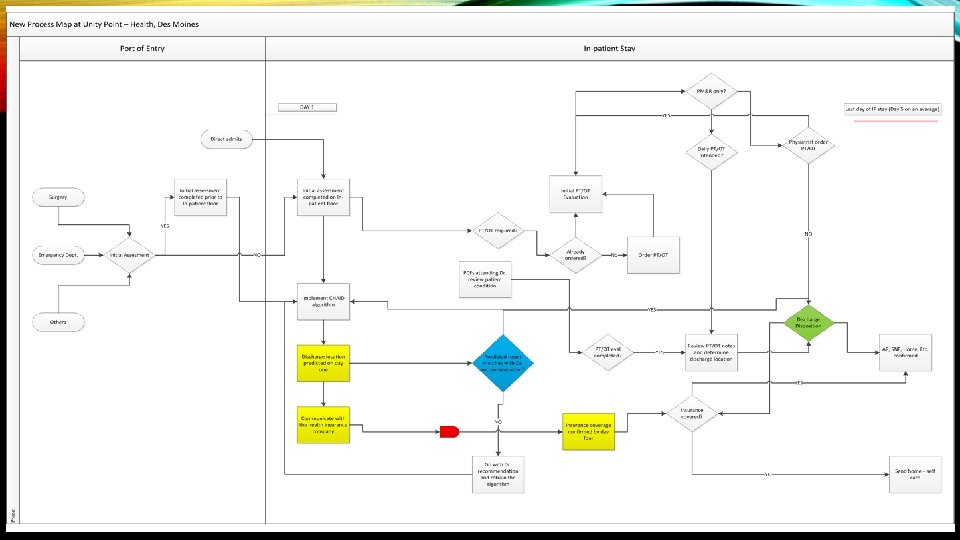
ADVANCED PAC DISCHARGE • New process map showing the advantage of implementing CHAID model removes the extra four days of waiting time and improves patient flow.
CONCLUSION • CHAID is the best fit model with an overall accuracy of 84. 16%. This model at Unity Point Health can reduces the PAC discharge disposition and inpatient length of stay by forty-four percent and also encourages advanced PAC discharge planning as suggested by the Institute for Healthcare Improvement’s white paper. • This approach is a good fit as it does not interfere with any clinical or medical procedures and it easy to deploy as a CDSS. Moreover, the proposed CHAID model outperforms 6 -Clicks classification accuracy and is free of user bias. The results obtained using CHAID is repeatable and reproducible. Additionally, application of prediction modeling in PAC discharge has not been well established in any published literature.
THANK YOU Ms. Vanessa Calderon Mrs. Shelby Neel