
EAL and educational achievement in England An analysis

- Slides: 22
EAL and educational achievement in England: An analysis of the NPD Keynote to National EAL Conference, Jeffrey Hall, UCL-Institute of Education, London 23 February 2017 Professor Steve Strand University of Oxford, Department of Education steve. strand@education. ox. ac. uk 01865 611071 1
Research reports https: //educationendowmentfoundation. org. uk/uploads/pdf/EAL_and_educational_achievement 2. pdf 2
Overview of this presentation • Brief overview of the main points from the summary report: – Demographics of EAL (size & distribution) – Achievement profile by age 5 -16 – Focus on Key Stage 2 – Risk factors for low attainment of EAL pupils – Implications for policy & practice 3
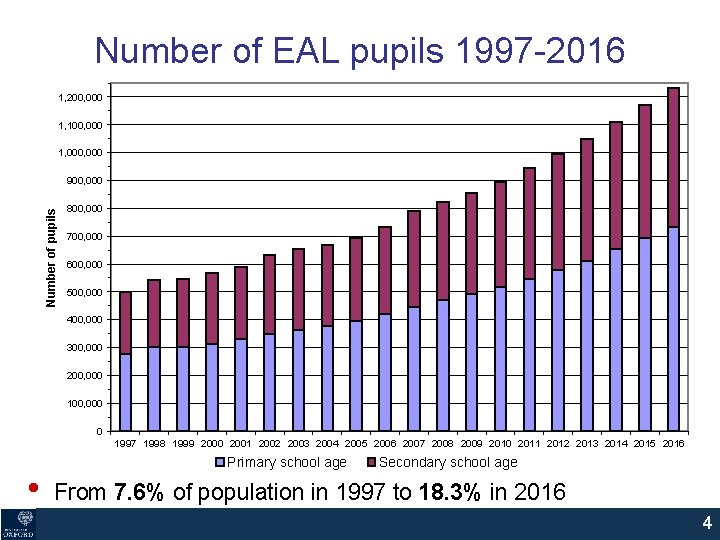
Number of EAL pupils 1997 -2016 1, 200, 000 1, 100, 000 1, 000 Number of pupils 900, 000 800, 000 700, 000 600, 000 500, 000 400, 000 300, 000 200, 000 100, 000 0 1997 1998 1999 2000 2001 2002 2003 2004 2005 2006 2007 2008 2009 2010 2011 2012 2013 2014 2015 2016 • Primary school age Secondary school age From 7. 6% of population in 1997 to 18. 3% in 2016 4
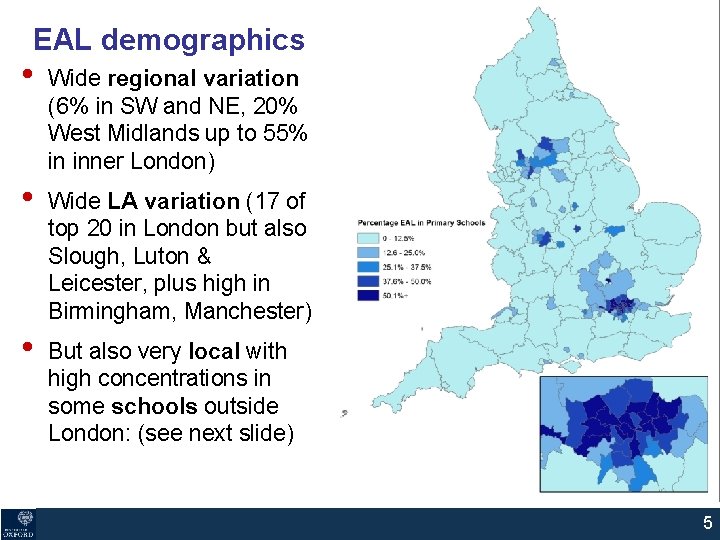
EAL demographics • Wide regional variation (6% in SW and NE, 20% West Midlands up to 55% in inner London) • Wide LA variation (17 of top 20 in London but also Slough, Luton & Leicester, plus high in Birmingham, Manchester) • But also very local with high concentrations in some schools outside London: (see next slide) 5
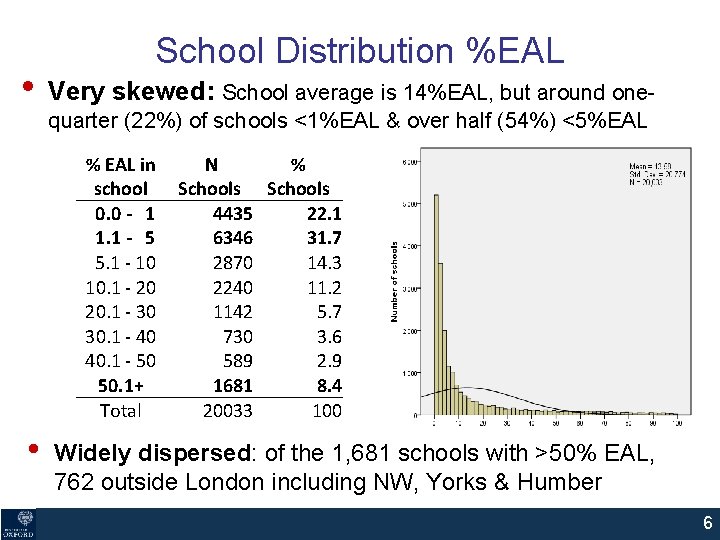
• School Distribution %EAL Very skewed: School average is 14%EAL, but around onequarter (22%) of schools <1%EAL & over half (54%) <5%EAL % EAL in school 0. 0 - 1 1. 1 - 5 5. 1 - 10 10. 1 - 20 20. 1 - 30 30. 1 - 40 40. 1 - 50 50. 1+ Total • N % Schools 4435 22. 1 6346 31. 7 2870 14. 3 2240 11. 2 1142 5. 7 730 3. 6 589 2. 9 1681 8. 4 20033 100 Widely dispersed: of the 1, 681 schools with >50% EAL, 762 outside London including NW, Yorks & Humber 6
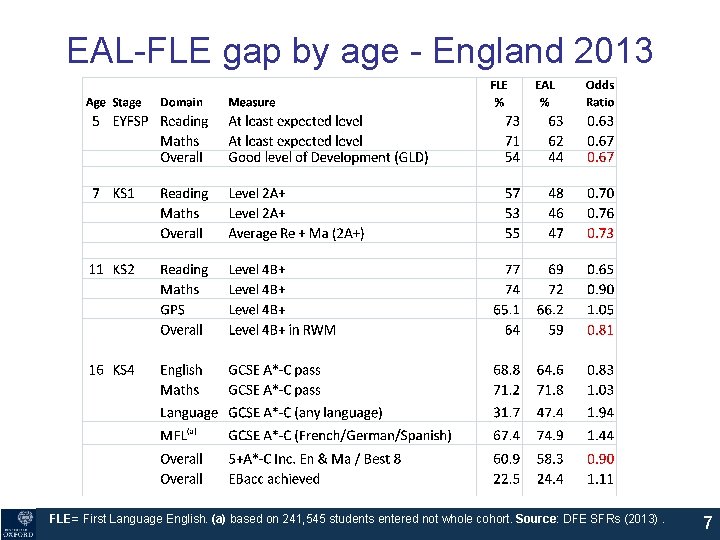
EAL-FLE gap by age - England 2013 FLE= First Language English. (a) based on 241, 545 students entered not whole cohort. Source: DFE SFRs (2013). 7
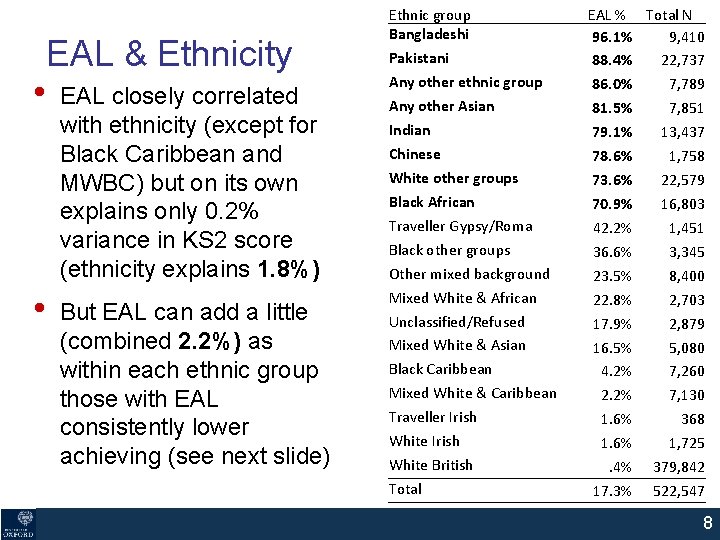
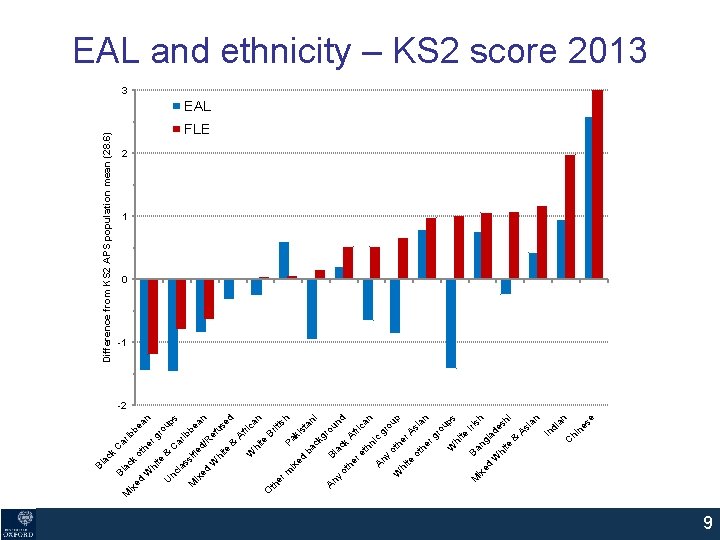
• • EAL & Ethnicity EAL closely correlated with ethnicity (except for Black Caribbean and MWBC) but on its own explains only 0. 2% variance in KS 2 score (ethnicity explains 1. 8%) But EAL can add a little (combined 2. 2%) as within each ethnic group those with EAL consistently lower achieving (see next slide) Ethnic group Bangladeshi Pakistani Any other ethnic group Any other Asian Indian Chinese White other groups Black African Traveller Gypsy/Roma Black other groups Other mixed background Mixed White & African Unclassified/Refused Mixed White & Asian Black Caribbean Mixed White & Caribbean Traveller Irish White British Total EAL % Total N 96. 1% 9, 410 88. 4% 22, 737 86. 0% 7, 789 81. 5% 7, 851 79. 1% 13, 437 78. 6% 1, 758 73. 6% 22, 579 70. 9% 16, 803 42. 2% 1, 451 36. 6% 3, 345 23. 5% 8, 400 22. 8% 2, 703 17. 9% 2, 879 16. 5% 5, 080 4. 2% 7, 260 2. 2% 7, 130 1. 6% 368 1. 6% 1, 725. 4% 379, 842 17. 3% 522, 547 8
ot k ac ib ar C ac k W be an he r g hi te ro & up U C nc s a la rib ss be M ifi ed ix an ed /R W ef us hi te ed & A fri W ca hi n te B O th rit er is h m Pa ix ki ed st b an ac i kg r ou An Bl nd ac y ot k he Af ric r e an th ni c An gr y ou o W th p er hi te A o si th an er g ro up W s hi te Ba Iris M h ix ng ed la W de hi sh te i & A si an In di an C hi ne se ed M ix Bl Bl Difference from KS 2 APS population mean (28. 6) EAL and ethnicity – KS 2 score 2013 3 EAL FLE 2 1 0 -1 -2 9
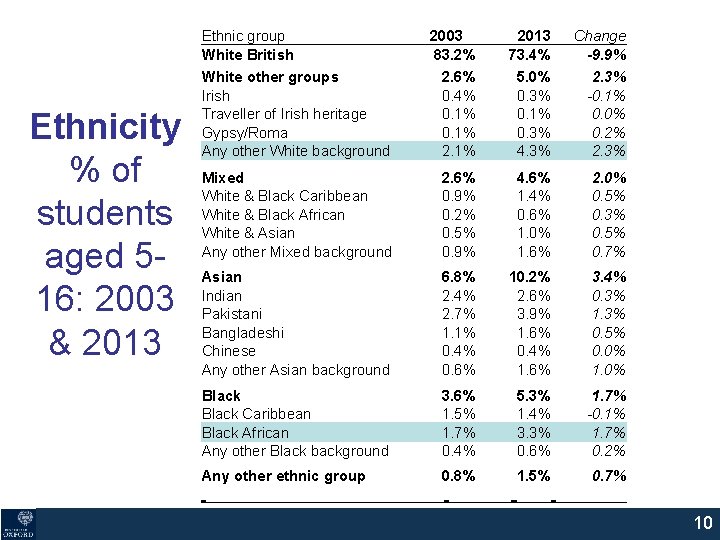
Ethnicity % of students aged 516: 2003 & 2013 Ethnic group White British White other groups Irish Traveller of Irish heritage Gypsy/Roma Any other White background 2003 83. 2% 2. 6% 0. 4% 0. 1% 2013 73. 4% 5. 0% 0. 3% 0. 1% 0. 3% 4. 3% Change -9. 9% 2. 3% -0. 1% 0. 0% 0. 2% 2. 3% Mixed White & Black Caribbean White & Black African White & Asian Any other Mixed background 2. 6% 0. 9% 0. 2% 0. 5% 0. 9% 4. 6% 1. 4% 0. 6% 1. 0% 1. 6% 2. 0% 0. 5% 0. 3% 0. 5% 0. 7% Asian Indian Pakistani Bangladeshi Chinese Any other Asian background 6. 8% 2. 4% 2. 7% 1. 1% 0. 4% 0. 6% 10. 2% 2. 6% 3. 9% 1. 6% 0. 4% 1. 6% 3. 4% 0. 3% 1. 3% 0. 5% 0. 0% 1. 0% Black Caribbean Black African Any other Black background 3. 6% 1. 5% 1. 7% 0. 4% 5. 3% 1. 4% 3. 3% 0. 6% 1. 7% -0. 1% 1. 7% 0. 2% Any other ethnic group 0. 8% 1. 5% 0. 7% 10
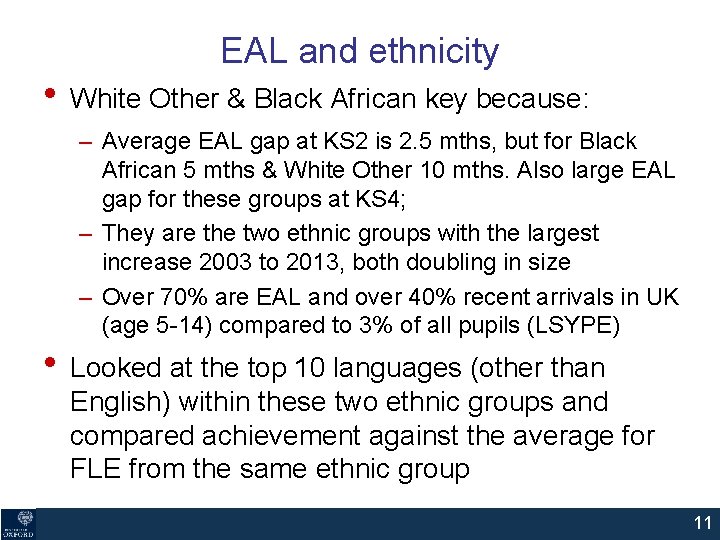
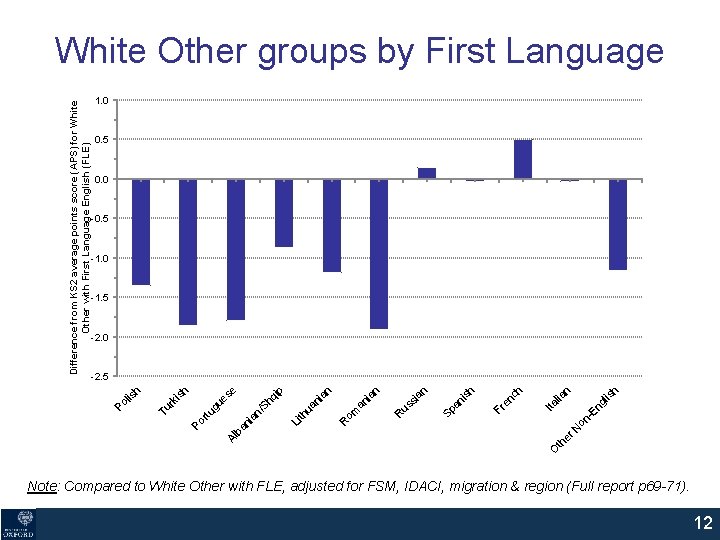
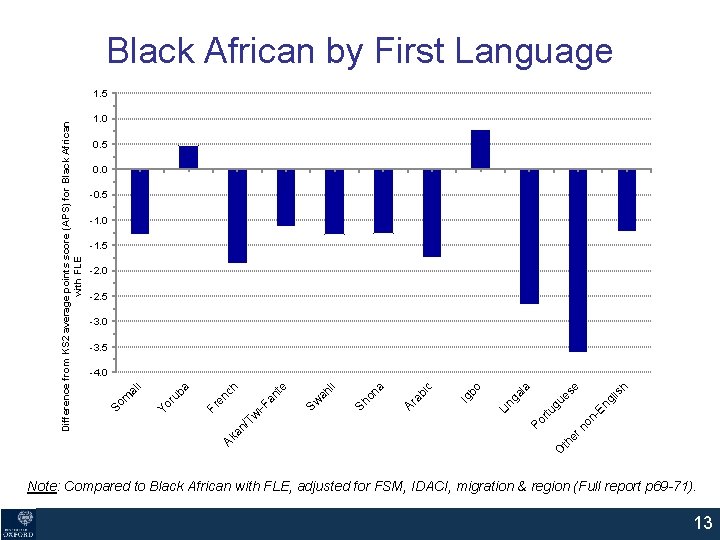
EAL and ethnicity • White Other & Black African key because: – Average EAL gap at KS 2 is 2. 5 mths, but for Black African 5 mths & White Other 10 mths. Also large EAL gap for these groups at KS 4; – They are the two ethnic groups with the largest increase 2003 to 2013, both doubling in size – Over 70% are EAL and over 40% recent arrivals in UK (age 5 -14) compared to 3% of all pupils (LSYPE) • Looked at the top 10 languages (other than English) within these two ethnic groups and compared achievement against the average for FLE from the same ethnic group 11
er N th O h lis ng on -E lia n Ita nc h Fr e sh an i Sp an si us R an an i om R n ia ua n th Li e p hq i n/ S ia ba n Al gu es Po rtu sh ki Tu r h lis Po Difference from KS 2 average points score (APS) for White Other with First Language English (FLE) White Other groups by First Language 1. 0 0. 5 0. 0 -0. 5 -1. 0 -1. 5 -2. 0 -2. 5 Note: Compared to White Other with FLE, adjusted for FSM, IDACI, migration & region (Full report p 69 -71). 12
Black African by First Language 1. 0 0. 5 0. 0 -0. 5 -1. 0 -1. 5 -2. 0 -2. 5 -3. 0 -3. 5 is h En gl th er n on - tu gu es e a Po r ng al Li o Ig b c ab i Ar on a Sh li ah Sw te an O Ak an /T w i-F en ch Fr ru ba Yo m al i -4. 0 So Difference from KS 2 average points score (APS) for Black African with FLE 1. 5 Note: Compared to Black African with FLE, adjusted for FSM, IDACI, migration & region (Full report p 69 -71). 13
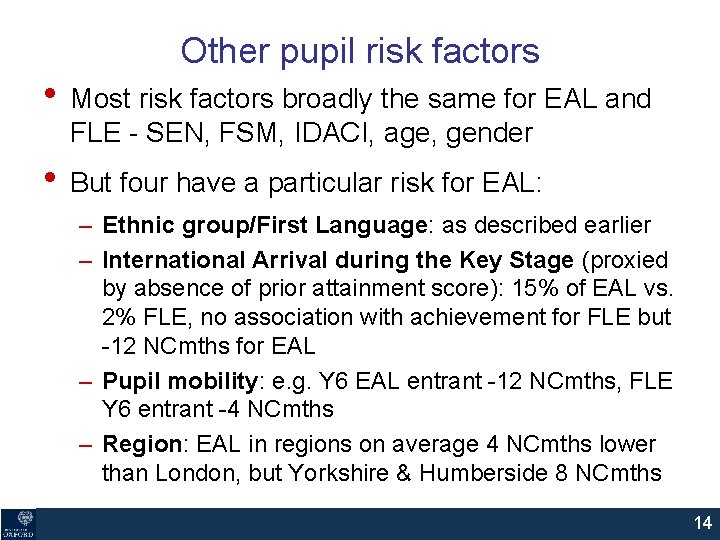
Other pupil risk factors • Most risk factors broadly the same for EAL and FLE - SEN, FSM, IDACI, age, gender • But four have a particular risk for EAL: – Ethnic group/First Language: as described earlier – International Arrival during the Key Stage (proxied by absence of prior attainment score): 15% of EAL vs. 2% FLE, no association with achievement for FLE but -12 NCmths for EAL – Pupil mobility: e. g. Y 6 EAL entrant -12 NCmths, FLE Y 6 entrant -4 NCmths – Region: EAL in regions on average 4 NCmths lower than London, but Yorkshire & Humberside 8 NCmths 14
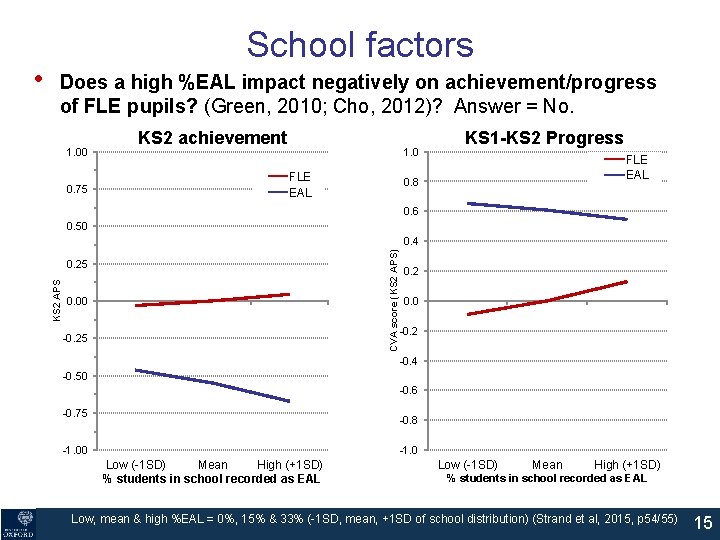
Does a high %EAL impact negatively on achievement/progress of FLE pupils? (Green, 2010; Cho, 2012)? Answer = No. 1. 00 0. 75 KS 2 achievement 1. 0 FLE EAL KS 1 -KS 2 Progress FLE EAL 0. 8 0. 6 0. 50 CVA score (KS 2 APS) 0. 4 0. 25 KS 2 APS • School factors 0. 00 -0. 25 0. 2 0. 0 -0. 2 -0. 4 -0. 50 -0. 6 -0. 75 -0. 8 -1. 00 Low (-1 SD) Mean High (+1 SD) % students in school recorded as EAL Low, mean & high %EAL = 0%, 15% & 33% (-1 SD, mean, +1 SD of school distribution) (Strand et al, 2015, p 54/55) 15
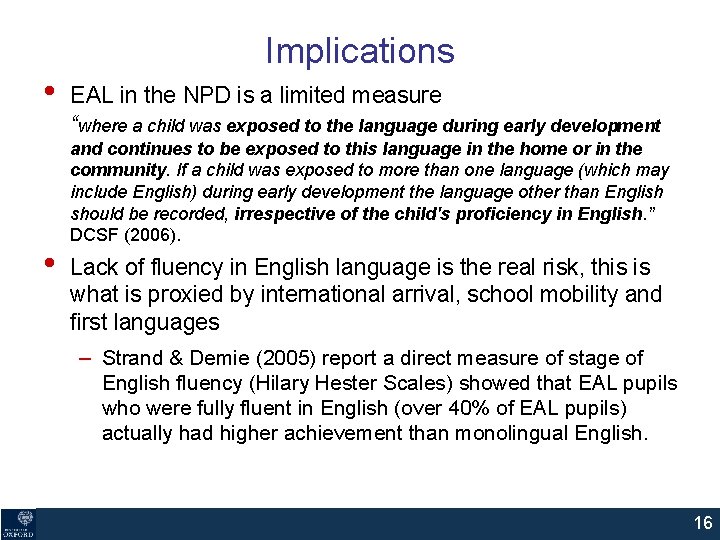
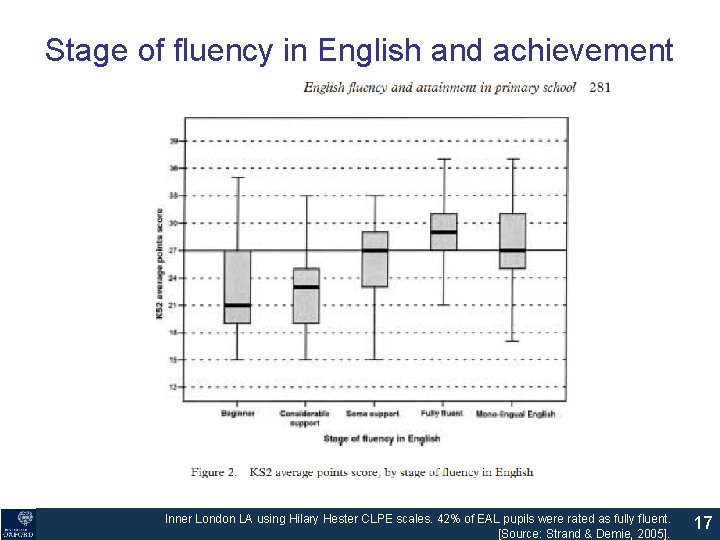
Implications • • EAL in the NPD is a limited measure “where a child was exposed to the language during early development and continues to be exposed to this language in the home or in the community. If a child was exposed to more than one language (which may include English) during early development the language other than English should be recorded, irrespective of the child's proficiency in English. ” DCSF (2006). Lack of fluency in English language is the real risk, this is what is proxied by international arrival, school mobility and first languages – Strand & Demie (2005) report a direct measure of stage of English fluency (Hilary Hester Scales) showed that EAL pupils who were fully fluent in English (over 40% of EAL pupils) actually had higher achievement than monolingual English. 16
Stage of fluency in English and achievement Inner London LA using Hilary Hester CLPE scales. 42% of EAL pupils were rated as fully fluent. [Source: Strand & Demie, 2005]. 17
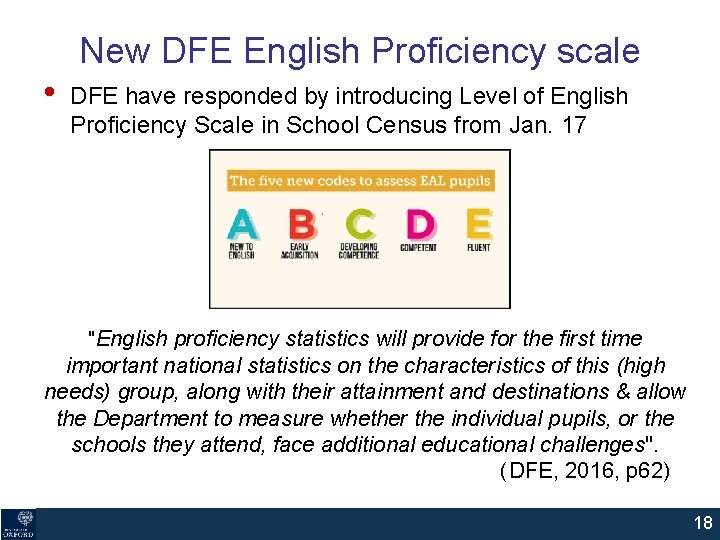
New DFE English Proficiency scale • DFE have responded by introducing Level of English Proficiency Scale in School Census from Jan. 17 "English proficiency statistics will provide for the first time important national statistics on the characteristics of this (high needs) group, along with their attainment and destinations & allow the Department to measure whether the individual pupils, or the schools they attend, face additional educational challenges". (DFE, 2016, p 62) 18
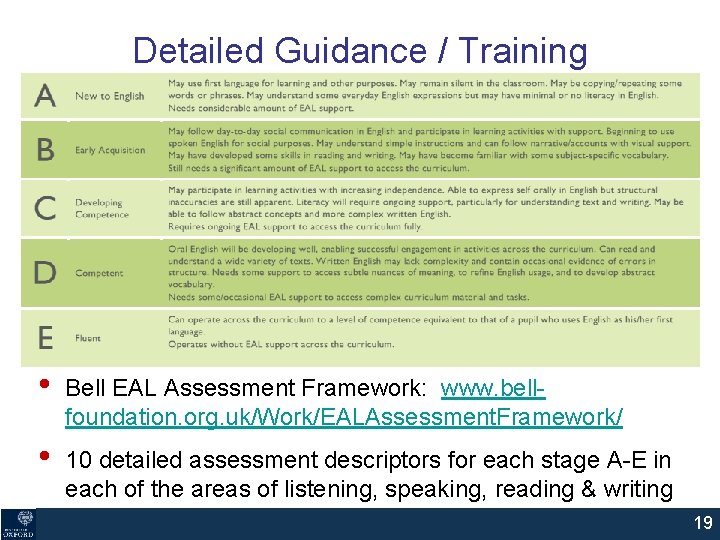
Detailed Guidance / Training • Bell EAL Assessment Framework: www. bellfoundation. org. uk/Work/EALAssessment. Framework/ • 10 detailed assessment descriptors for each stage A-E in each of the areas of listening, speaking, reading & writing 19
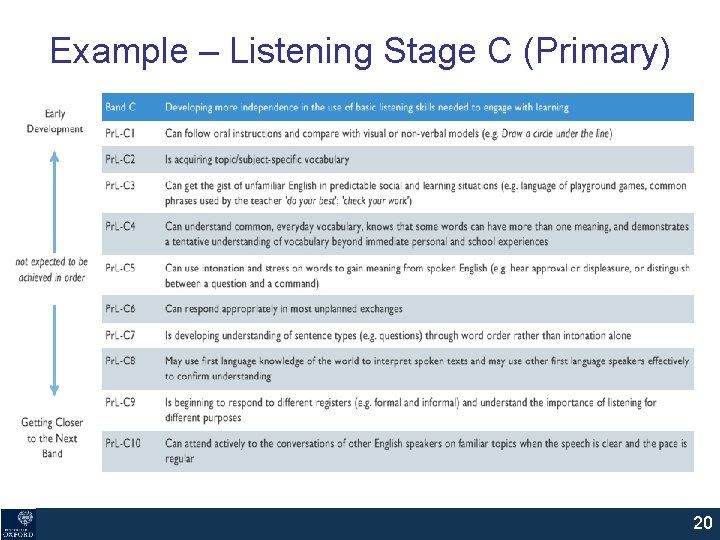
Example – Listening Stage C (Primary) 20
Other Implications (Cont. ) • Teaching / Support materials - excellent resources from National Strategies e. g. Supporting pupils learning EAL (2002); New Arrivals Excellence Programme (2007); PNS Learning & teaching bilingual children in the primary years (2007) • Continued funding needed - Educational progress of EAL is high, but cannot be complacent as it reflects historically high levels of investment (Section 11, EMAG until 2012) • Current funding arrangements broadly well targeted on first three years at school or after international arrival (though literature suggests may take 5 -7 years to acquire full fluency / academic writing) • Evaluate new Proficiency Scale: how is it working in practice (Funding being sort by Oxford) 21
References Cho, R. M. (2012). Are there peer effects associated with having English Language Learner (ELL) classmates? Evidence from the Early Childhood Longitudinal Study Kindergarten Cohort (ECLS-K). Economics of Education Review, 31(5), 629 -643. DCSF (2006). Pupil Language Data: Guidance for local authorities on schools' collection and recording of data on pupils languages. London: DCSF. Demie, F. & Strand, S. (2006). English language acquisition and educational attainment at the end of secondary school. Educational Studies, 32, (2), 215 -231. http: //dx. doi. org/10. 1080/03055690701423184 DFES. (2007). Learning and teaching for bilingual children in the primary years: Teaching units to support guided sessions for writing in EAL (Ref 00068 -2007). London: Department for Education and Skills. Geay, C. , Mc. Nally, S. , & Telhaj, S. (2012). Non-native speakers of English in the classroom: What are the effects on pupil performance? Centre for the Economics of Education (CEE). London School of Economics, London. http: //www. nuffieldfoundation. org/sites/default/files/ceedp 137. pdf Strand, S. (2010). Do some schools narrow the gap? Differential school effectiveness by ethnicity, gender, poverty and prior attainment. School Effectiveness and School Improvement, 21(3), 289 -314. http: //dx. doi. org/10. 1080/09243451003732651 Strand, S. , & Demie, F. (2005). English language acquisition and educational attainment at the end of primary school. Educational Studies, 31, (3), 275 -291. http: //dx. doi. org/10. 1080/03055690500236613 Strand, S. , Malmberg, L. , & Hall, J. (2015). English as an additional language and educational achievement in England: An analysis of the National Pupil Database. London: Educational Endowment Fund. http: //educationendowmentfoundation. org. uk/uploads/pdf/EAL_and_educational_achievement 2. pdf 22