Eagle Sat Flight Operations Mo Sabliny Subsystem Organization

Eagle. Sat Flight Operations Mo Sabliny

Subsystem Organization Flight Operations Team Lead: Mo Sabliny Flight Dynamics Team Members: Alex Benz Christina Halverson Hunter Mc. Craw Walker Herring Zachary Henney Ground Software Team Members: Adrienne Rector Madison Padilla

Flight Dynamics • From NASA: • • Altitude at apogee: 810 km Altitude at perigee: 450 km Inclination: 99. 72 degrees Mean Local Time of Ascending Node: 13: 25 • Analysis in Systems Tool Kit 10 (STK)
 • 3")
STK Analysis - Coverage • Passes over Ground Station (located in AXFAB) • 3 to 6 passes per day • 2 -3 passes within ~1 -2 hours, separated by ~8 -10 hours • Mean Coverage Time: Approx. 10 minutes

STK – Coverage for Eagle. Sat-1 • Example of STK coverage generation file Access Start (UTCG) Access End (UTCG) --------------- Duration (sec) Asset Full Name --------------- 1 16 Nov 2016 20: 24: 18. 001 16 Nov 2016 20: 35: 08. 306 650. 304 Facility 1 2 16 Nov 2016 22: 04: 43. 822 16 Nov 2016 22: 07: 50. 969 187. 148 Facility 1 3 17 Nov 2016 08: 14: 33. 840 17 Nov 2016 08: 27: 12. 472 758. 632 Facility 1 4 17 Nov 2016 09: 50: 15. 444 17 Nov 2016 10: 03: 37. 207 801. 764 Facility 1 5 17 Nov 2016 11: 30: 26. 896 17 Nov 2016 11: 32: 48. 717 141. 821 Facility 1 6 17 Nov 2016 19: 09: 18. 971 17 Nov 2016 19: 17: 30. 867 491. 896 Facility 1

STK Analysis – Eclipse Summary • Eclipse Analysis • Orbital Period of 97 min 15 sec • Eclipse duration: 70 sec - 36 min • Example of STK eclipse summary: Eclipse Start Time (UTCG) Eclipse End Time (UTCG) Duration (sec) ----------------- --------- 13 Dec 2016 18: 13: 38. 405 13 Dec 2016 18: 49: 31. 167 2152. 762 20 Feb 2017 16: 39: 13. 579 70. 298 … 20 Feb 2017 16: 38: 03. 280
 with")
Ground Software • A ground system to provide a Graphical User Interface (GUI) with Eagle. Sat through a serial connection to the Terminal Node Controller (TNC) • View, save, observe and process data from Eagle. Sat • Send commands to Eagle. Sat • Transformational and Interactive Software Architecture • Matrix Laboratories (MATLAB) chosen for all ground station software

High Level Flowchart

Use Case – Real Time

Use Case – Playback

Data Flow Diagram
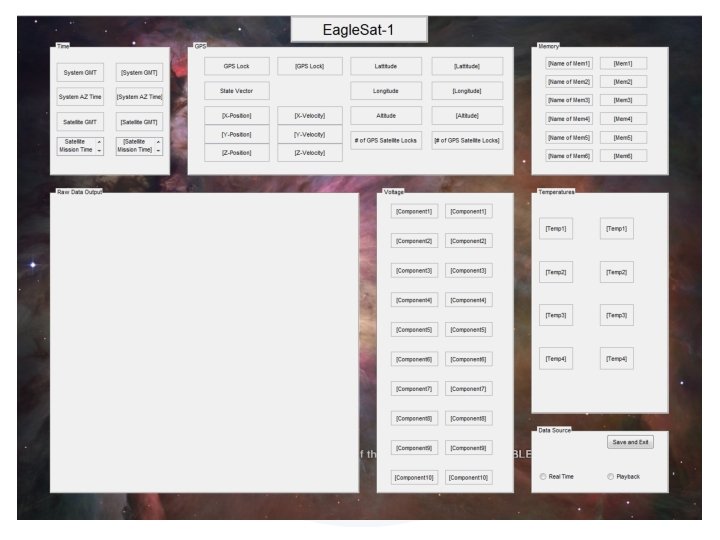

Progress Report • Progress Made: • GUI prototype completed • Parsed the packet format currently available • High level design • Unified Modeling Language (UML) Models • Verified the serial connection interface with Arduino to MATLAB • To Be Completed: • Code Construction • Data Parsing • Data Analysis • Function Callbacks • Integration of code within the GUI • Test runs of GUI with completed code • Verify the serial connection interface with TNC to MATLAB

Stretch Goals • Map memory error locations • Generate trend reports • Graphs of data over time (e. g. weekly, monthly, quarterly, yearly) • Model/map of orbital decay

Questions?
- Slides: 15