
Dyspnea in COPD New Insights Denis E ODonnell


![Exercise Responses in COPD [O’Donnell et al. AJRCCM 1997] Operational Lung Volumes Respiratory Effort](https://slidetodoc.com/presentation_image_h2/772a2a0513ab432879eeeb0fd54f3cbc/image-18.jpg "Exercise Responses in COPD [O’Donnell et al. AJRCCM 1997] Operational Lung Volumes Respiratory Effort")
![[Sinderby et al. AJRCCM 2001]](https://slidetodoc.com/presentation_image_h2/772a2a0513ab432879eeeb0fd54f3cbc/image-20.jpg "[Sinderby et al. AJRCCM 2001]")

![Proportional Assist Ventilation [O’Donnell et al. AJRCCM 1997] Control * PAV *p<0. 05 significant](https://slidetodoc.com/presentation_image_h2/772a2a0513ab432879eeeb0fd54f3cbc/image-32.jpg "Proportional Assist Ventilation [O’Donnell et al. AJRCCM 1997] Control * PAV *p<0. 05 significant")
![CPAP during Exercise in COPD [O’Donnell et al. Am Rev Respir Dis 1988] C](https://slidetodoc.com/presentation_image_h2/772a2a0513ab432879eeeb0fd54f3cbc/image-35.jpg "CPAP during Exercise in COPD [O’Donnell et al. Am Rev Respir Dis 1988] C")
![Acute Bronchoconstriction in Asthma [Lougheed et al. AJRCCM 1995] Maximal Bronchoprovocation Flow (L/s) Baseline](https://slidetodoc.com/presentation_image_h2/772a2a0513ab432879eeeb0fd54f3cbc/image-36.jpg "Acute Bronchoconstriction in Asthma [Lougheed et al. AJRCCM 1995] Maximal Bronchoprovocation Flow (L/s) Baseline")
![Ventilatory Assistance during Bronchoconstriction [Lougheed et al. AJRCCM 1995] Pes = -7 %PImax PEEPi](https://slidetodoc.com/presentation_image_h2/772a2a0513ab432879eeeb0fd54f3cbc/image-37.jpg "Ventilatory Assistance during Bronchoconstriction [Lougheed et al. AJRCCM 1995] Pes = -7 %PImax PEEPi")
![Dyspnea Relief in Response to Bronchodilators [O'Donnell et al. AJRCCM 1998] *p<0. 05 pre](https://slidetodoc.com/presentation_image_h2/772a2a0513ab432879eeeb0fd54f3cbc/image-46.jpg "Dyspnea Relief in Response to Bronchodilators [O'Donnell et al. AJRCCM 1998] *p<0. 05 pre")
![Responses to Oxygen during Exercise [O'Donnell et al. AJRCCM 2001] RA O 2 **](https://slidetodoc.com/presentation_image_h2/772a2a0513ab432879eeeb0fd54f3cbc/image-58.jpg "Responses to Oxygen during Exercise [O'Donnell et al. AJRCCM 2001] RA O 2 **")
![Responses to Oxygen during Exercise [O'Donnell et al. AJRCCM 2001] TLC IRV* RA EILV*](https://slidetodoc.com/presentation_image_h2/772a2a0513ab432879eeeb0fd54f3cbc/image-59.jpg "Responses to Oxygen during Exercise [O'Donnell et al. AJRCCM 2001] TLC IRV* RA EILV*")

- Slides: 79
Dyspnea in COPD : New Insights Denis E. O’Donnell Respiratory Investigation Unit Queen’s University Kingston, Ontario Canada
Outline • • • Mechanics in COPD during exercise Correlations with dyspnea Qualitative aspects Interactions between Mechanics and Drive Neuro-mechanical Dissociation
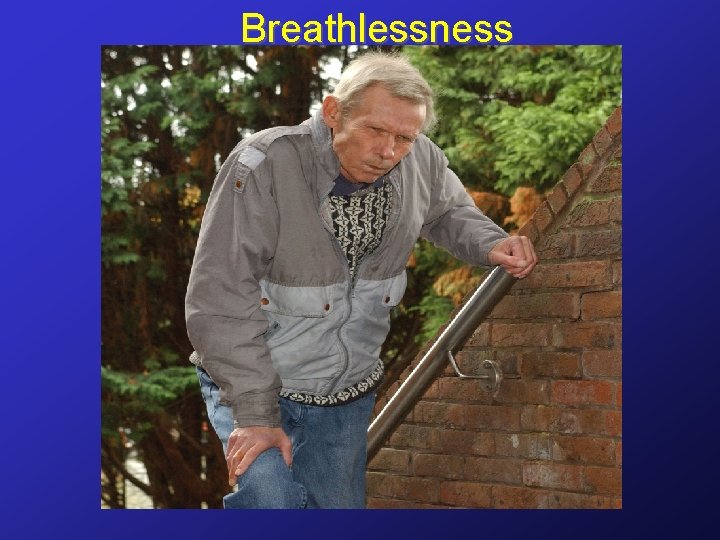
Breathlessness
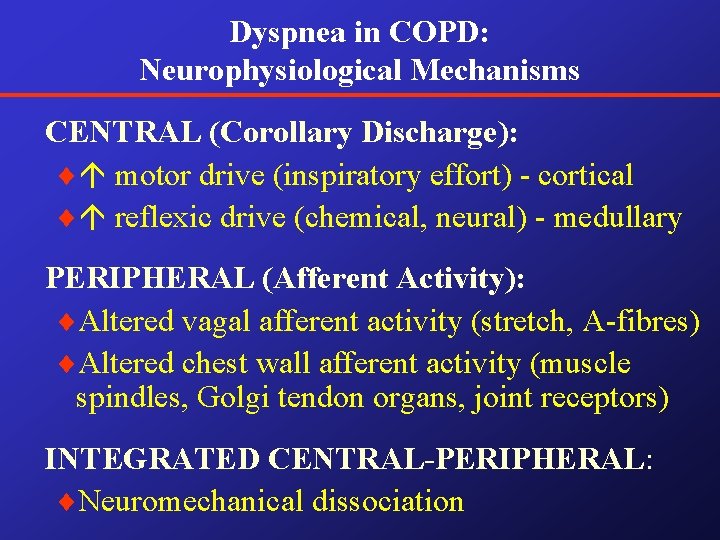
Dyspnea in COPD: Neurophysiological Mechanisms CENTRAL (Corollary Discharge): ¨ motor drive (inspiratory effort) - cortical ¨ reflexic drive (chemical, neural) - medullary PERIPHERAL (Afferent Activity): ¨Altered vagal afferent activity (stretch, A-fibres) ¨Altered chest wall afferent activity (muscle spindles, Golgi tendon organs, joint receptors) INTEGRATED CENTRAL-PERIPHERAL: ¨Neuromechanical dissociation
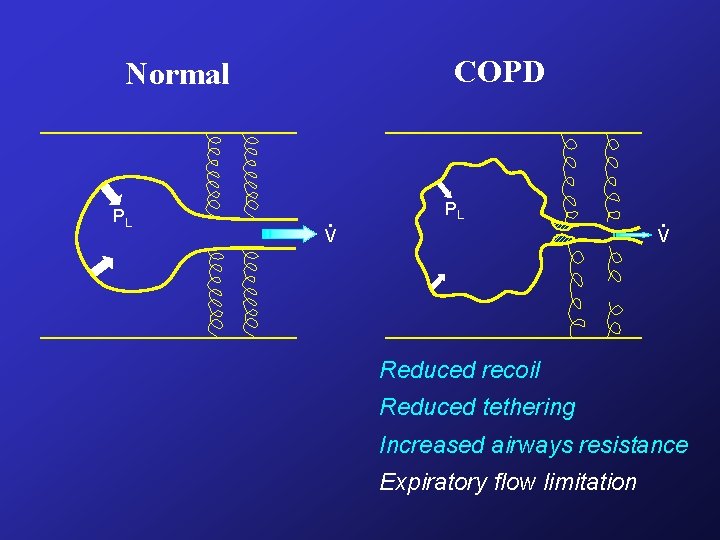
COPD Normal PL . V Reduced recoil Reduced tethering Increased airways resistance Expiratory flow limitation
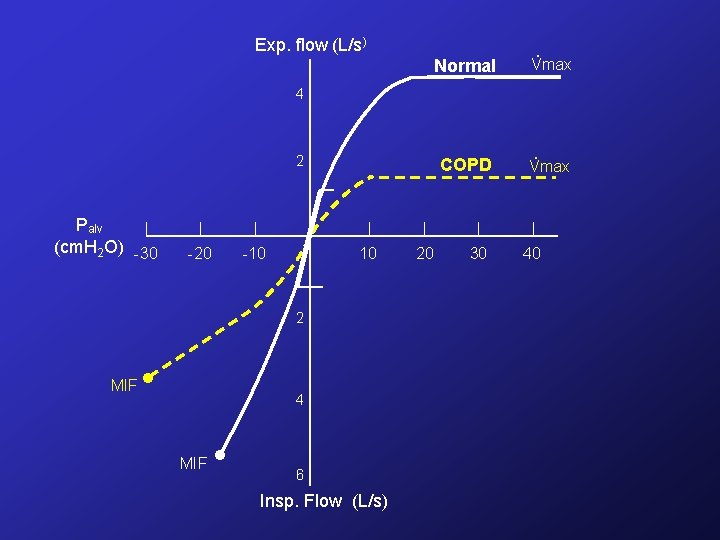
Exp. flow (L/s) . Normal Vmax COPD . Vmax 4 2 Palv (cm. H 2 O) -30 -20 . -10 10 2 MIF . 4 6 Insp. Flow (L/s) 20 30 40
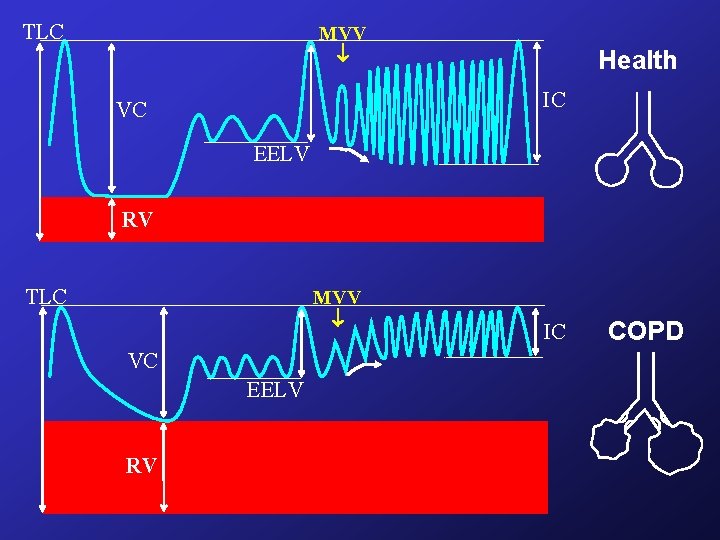
TLC MVV Health IC VC EELV RV TLC MVV VC EELV RV IC COPD
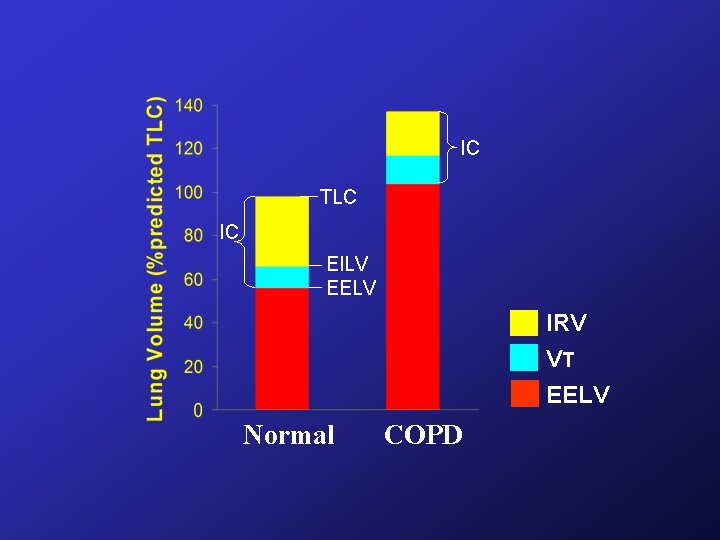
IC TLC IC EILV EELV IRV VT EELV Normal COPD
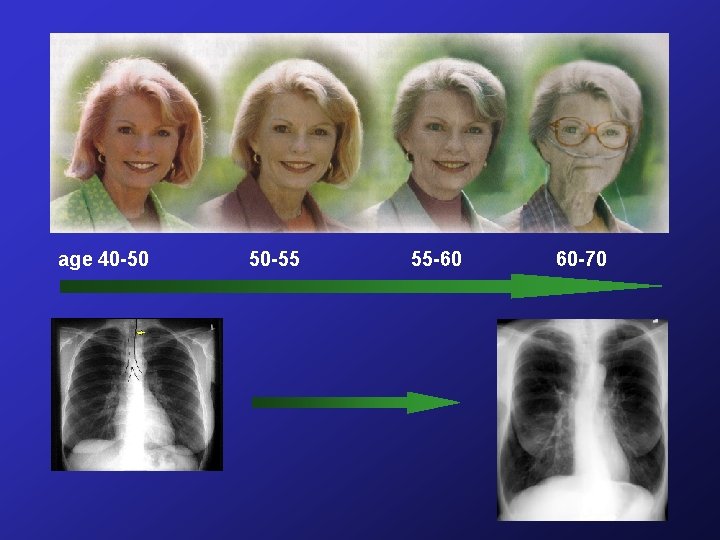
age 40 -50 50 -55 55 -60 60 -70
To the COPD patient, this is a breathtaking view.
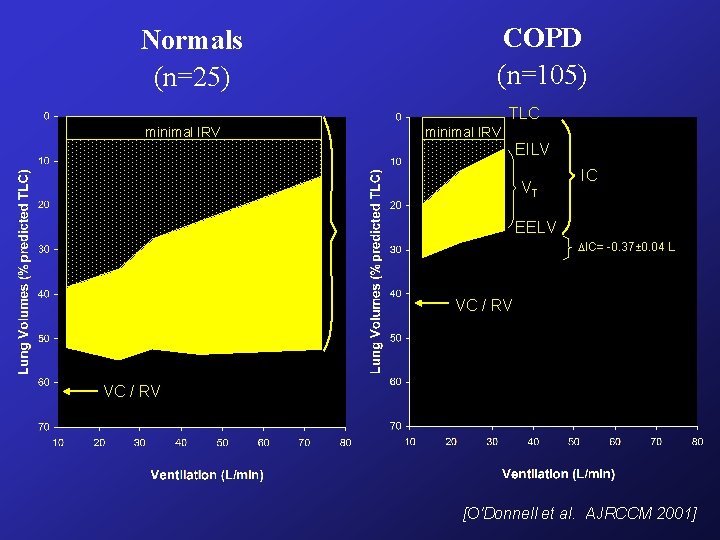
Normals (n=25) COPD (n=105) TLC minimal IRV EILV VT IC EELV IC= -0. 37± 0. 04 L VC / RV [O'Donnell et al. AJRCCM 2001]
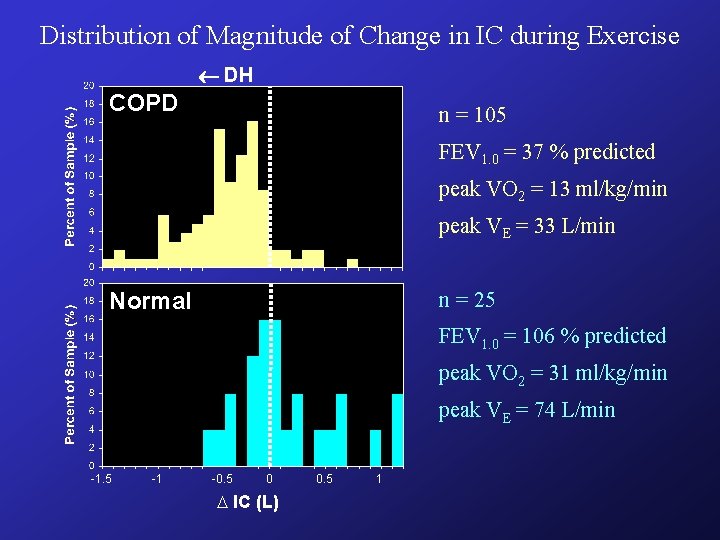
Distribution of Magnitude of Change in IC during Exercise DH COPD n = 105 FEV 1. 0 = 37 % predicted peak VO 2 = 13 ml/kg/min peak VE = 33 L/min n = 25 Normal FEV 1. 0 = 106 % predicted peak VO 2 = 31 ml/kg/min peak VE = 74 L/min -1. 5 -1 -0. 5 0 IC (L) 0. 5 1
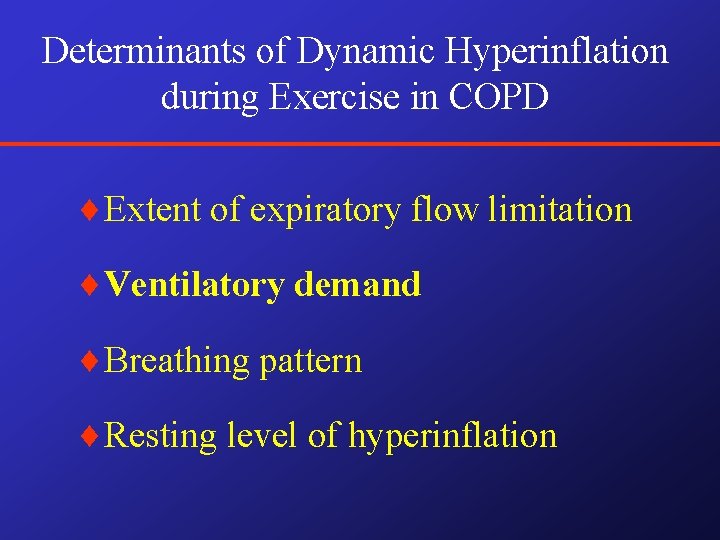
Determinants of Dynamic Hyperinflation during Exercise in COPD ¨Extent of expiratory flow limitation ¨Ventilatory demand ¨Breathing pattern ¨Resting level of hyperinflation
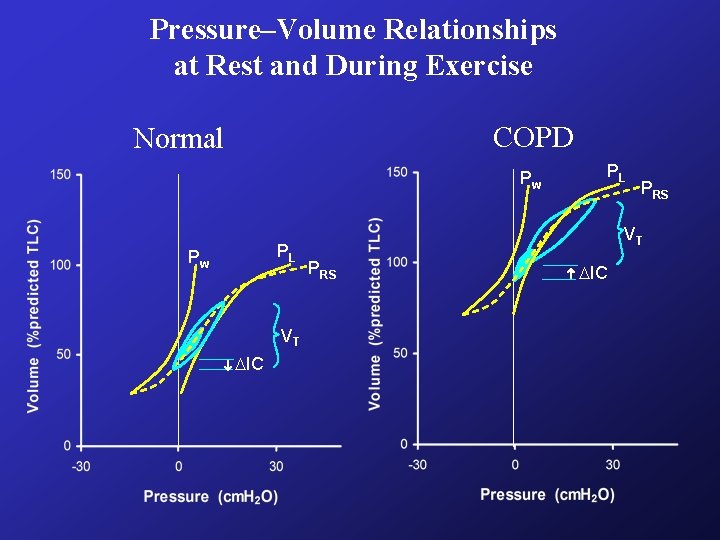
Pressure–Volume Relationships at Rest and During Exercise COPD Normal PL Pw VT IC PRS VT PRS IC
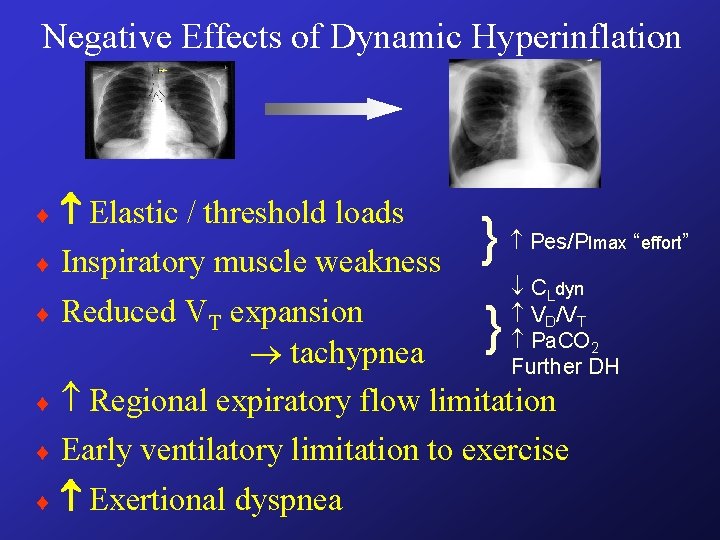
Negative Effects of Dynamic Hyperinflation Elastic / threshold loads ¨ Inspiratory muscle weakness ¨ } Pes/P CLdyn VD/VT Pa. CO 2 Further DH Reduced VT expansion tachypnea ¨ Regional expiratory flow limitation } ¨ Imax “effort” ¨ Early ventilatory limitation to exercise ¨ Exertional dyspnea
Dyspnea & Unsatisfied Inspiration.
Exercise Responses in COPD [O’Donnell et al. AJRCCM 1997] Operational Lung Volumes Respiratory Effort 60 TLC COPD 50 120 IC COPD 100 IC 80 Normal 60 40 Pes / Plmax (%) Long Volume (% pred TLC) 140 Normal 40 30 20 10 0 20 40 60 Ventilation (L/min) 80
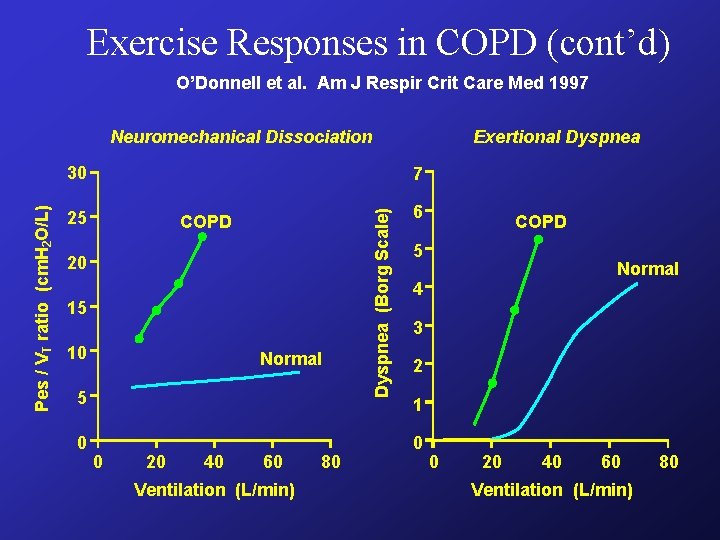
Exercise Responses in COPD (cont’d) O’Donnell et al. Am J Respir Crit Care Med 1997 Neuromechanical Dissociation 7 25 COPD 20 15 10 Normal 5 0 0 20 40 60 Ventilation (L/min) 80 Dyspnea (Borg Scale) Pes / VT ratio (cm. H 2 O/L) 30 Exertional Dyspnea 6 COPD 5 Normal 4 3 2 1 0 0 20 40 60 Ventilation (L/min) 80
[Sinderby et al. AJRCCM 2001]
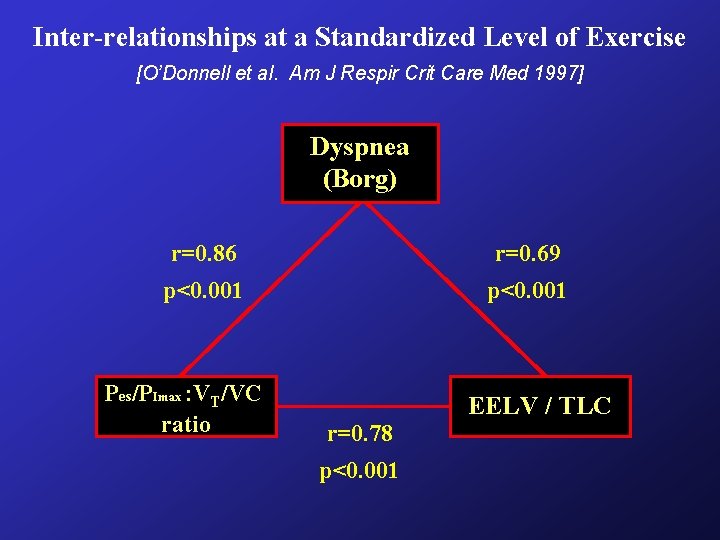
Inter-relationships at a Standardized Level of Exercise [O’Donnell et al. Am J Respir Crit Care Med 1997] Dyspnea (Borg) r=0. 86 r=0. 69 p<0. 001 Pes/PImax : VT/VC ratio r=0. 78 p<0. 001 EELV / TLC
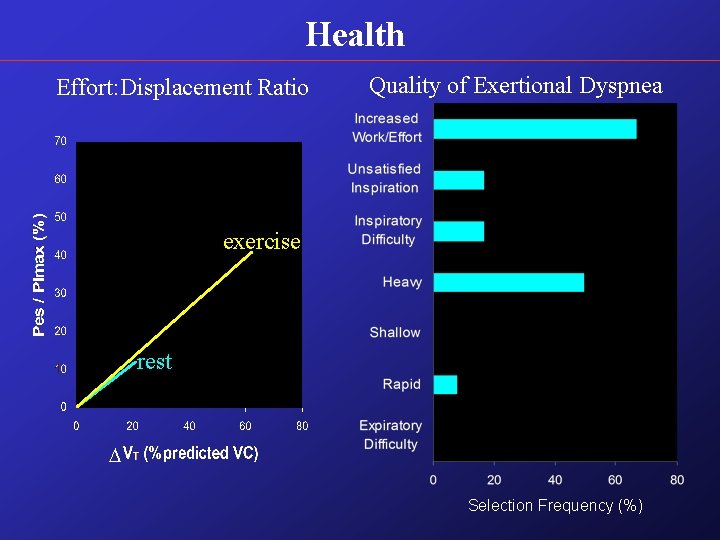
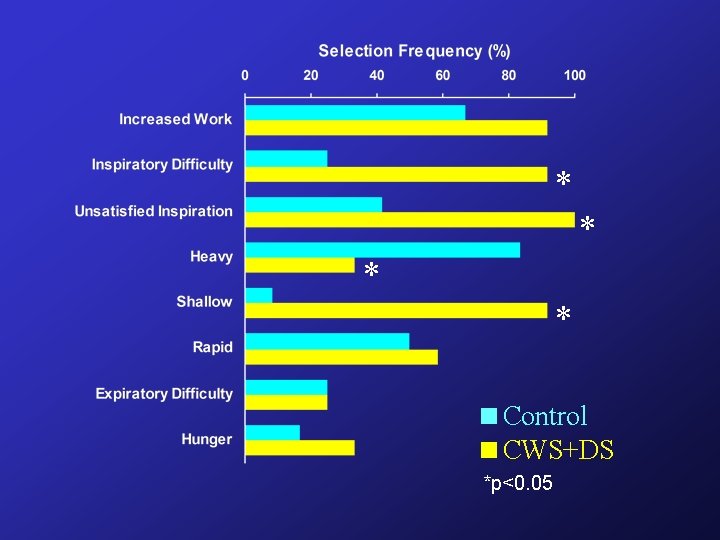
Health Effort: Displacement Ratio Quality of Exertional Dyspnea exercise rest Selection Frequency (%)
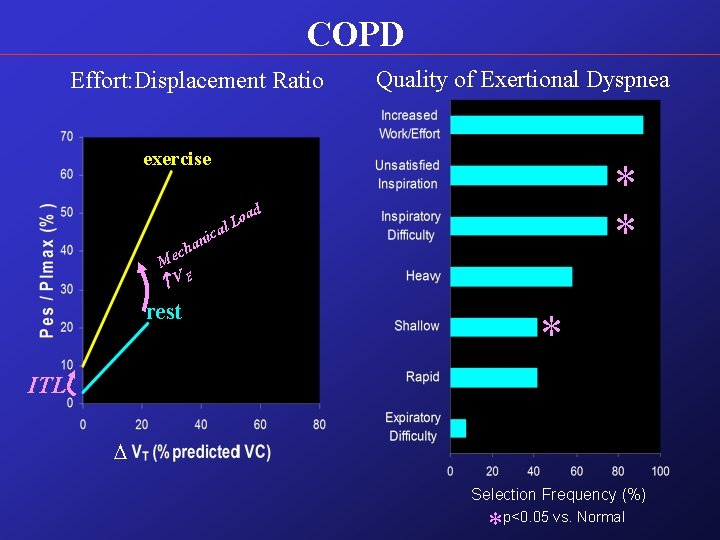
COPD Effort: Displacement Ratio Quality of Exertional Dyspnea exercise * * oad l. L ica an ch Me VE rest * ITL Selection Frequency (%) *p<0. 05 vs. Normal
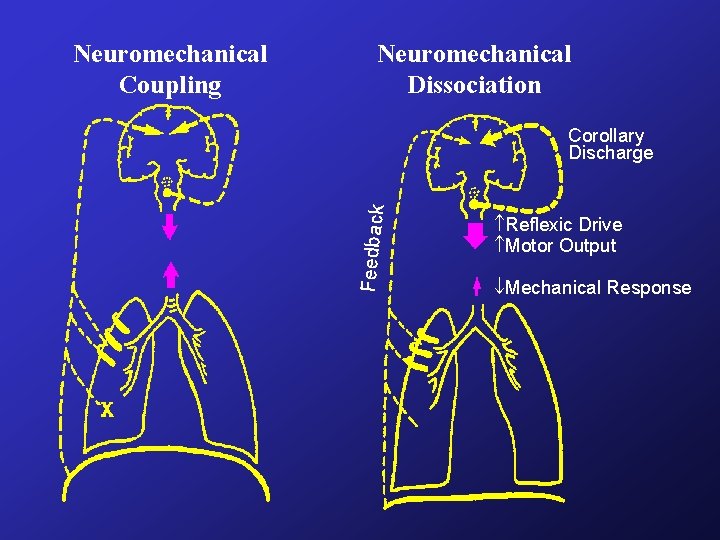
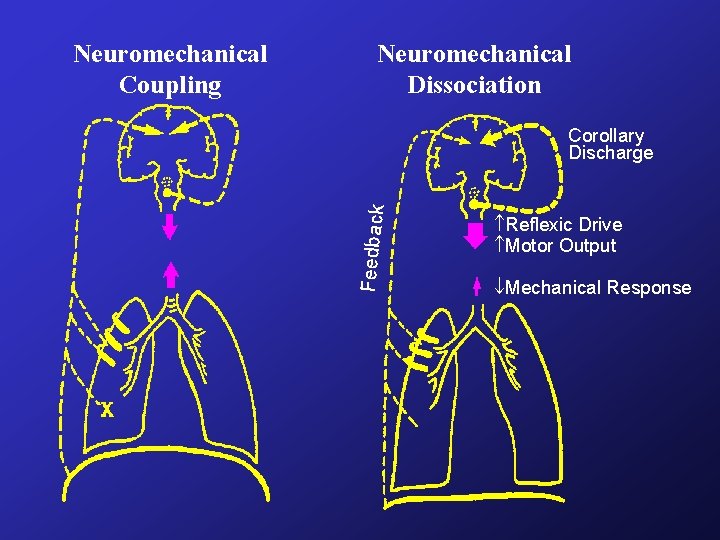
Neuromechanical Dissociation Corollary Discharge Feedback Neuromechanical Coupling Reflexic Drive Motor Output Mechanical Response
Purpose Ø To partition the effects of changes in IC (EELV) and IRV (EILV) on dyspnea during acute hyperinflation induced by exercise or by a breathing circuit which allows us to examine the effects of IC in relative isolation.
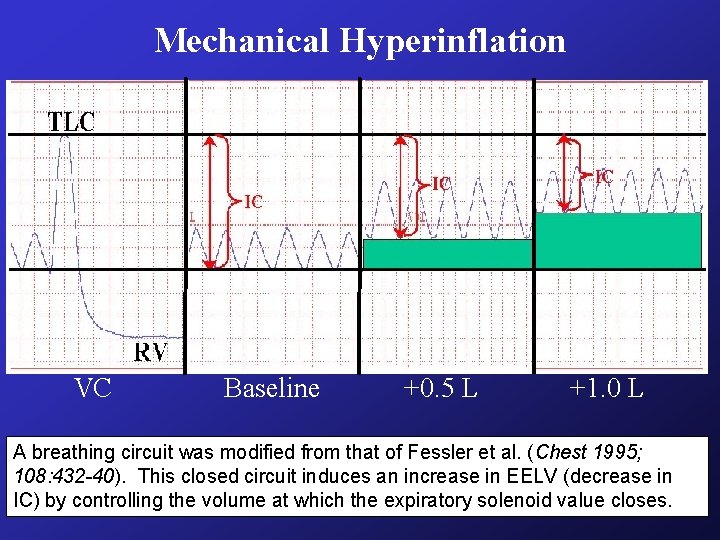
Mechanical Hyperinflation VC Baseline +0. 5 L +1. 0 L A breathing circuit was modified from that of Fessler et al. (Chest 1995; 108: 432 -40). This closed circuit induces an increase in EELV (decrease in IC) by controlling the volume at which the expiratory solenoid value closes.
Dyspnea & Effort
Demand-Capacity Imbalance
Load- Capacity Imbalance: Dyspnea Correlations in COPD • • Ve/MVV Pes/PI max Vt / IC Pes/PImax: Vt/IC ratio
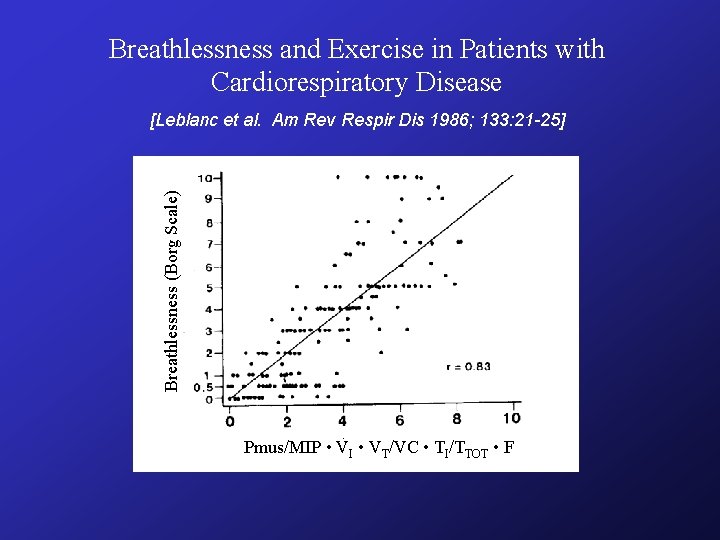
Breathlessness and Exercise in Patients with Cardiorespiratory Disease Breathlessness (Borg Scale) [Leblanc et al. Am Rev Respir Dis 1986; 133: 21 -25] . Pmus/MIP • VI • VT/VC • TI/TTOT • F
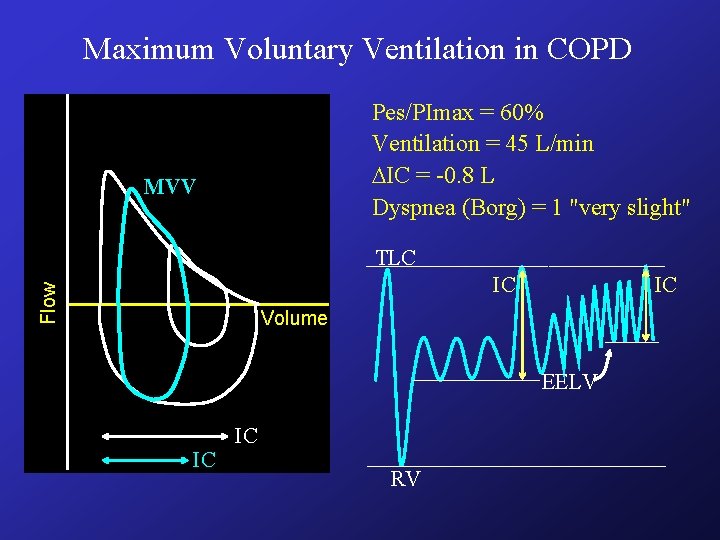
Maximum Voluntary Ventilation in COPD Pes/PImax = 60% Ventilation = 45 L/min IC = -0. 8 L Dyspnea (Borg) = 1 "very slight" MVV TLC Flow IC IC Volume EELV IC IC RV
Proportional Assist Ventilation [O’Donnell et al. AJRCCM 1997] Control * PAV *p<0. 05 significant difference at isotime * PAV
Dyspnea & the Inspiratory Threshold Load
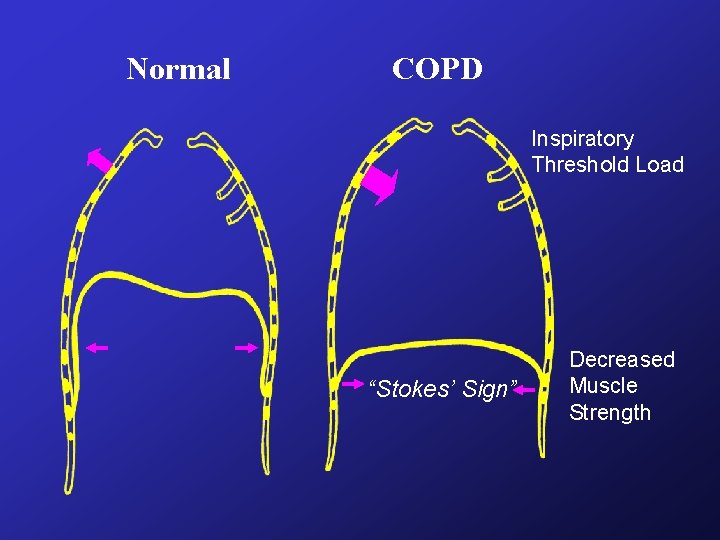
Normal COPD Inspiratory Threshold Load “Stokes’ Sign” Decreased Muscle Strength
CPAP during Exercise in COPD [O’Donnell et al. Am Rev Respir Dis 1988] C 1 C 2 CPAP
Acute Bronchoconstriction in Asthma [Lougheed et al. AJRCCM 1995] Maximal Bronchoprovocation Flow (L/s) Baseline IC Volume (L) FEV 1 = 97 % predicted Dyspnea = Borg 0 "none" IC Volume (L) FEV 1 = 44 %predicted Dyspnea = Borg 5 "severe" IC = - 1. 4 L ITL = + 7 cm. H 2 O Pes = + 24 % PImax
Ventilatory Assistance during Bronchoconstriction [Lougheed et al. AJRCCM 1995] Pes = -7 %PImax PEEPi = -7. 9 cm. H 2 O PEEPi = -1. 6 cm. H 2 O Reduction in Dyspnea ( Borg Scale) CPAP IPAP * * *
Dyspnea, Mechanical Restriction & Increased Drive
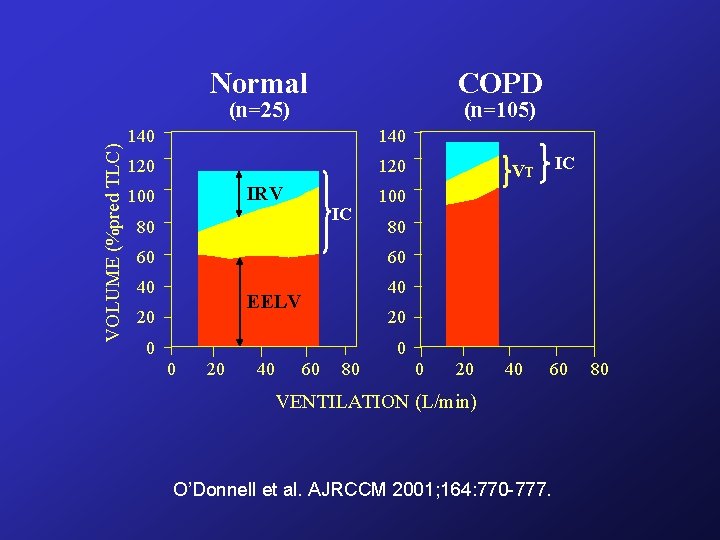
Normal COPD VOLUME (%pred TLC) (n=25) (n=105) 140 120 IRV 100 IC 80 60 IC VT 100 80 60 40 40 EELV 20 20 40 60 80 0 20 40 60 VENTILATION (L/min) O’Donnell et al. AJRCCM 2001; 164: 770 -777. 80
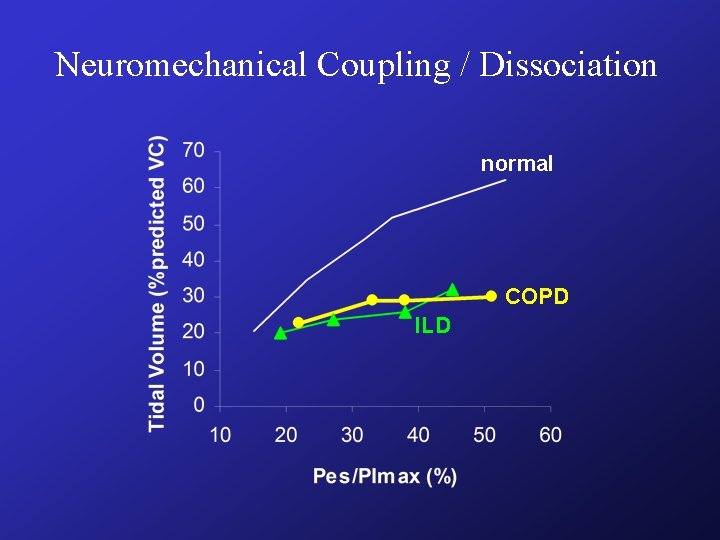
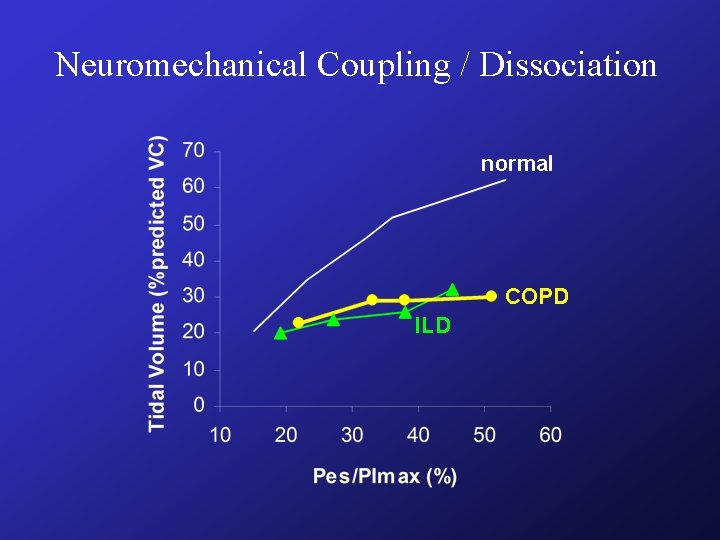
Neuromechanical Coupling / Dissociation normal COPD ILD
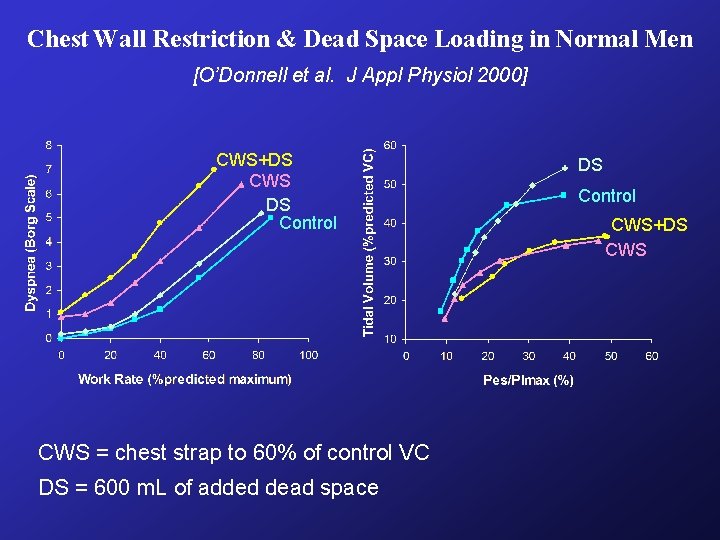
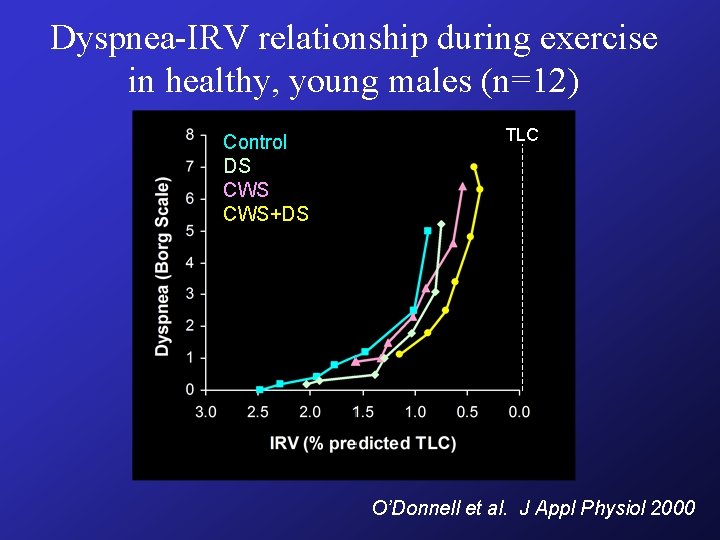
Chest Wall Restriction & Dead Space Loading in Normal Men [O’Donnell et al. J Appl Physiol 2000] CWS+DS CWS DS Control CWS = chest strap to 60% of control VC DS = 600 m. L of added dead space DS Control CWS+DS CWS
* * Control CWS+DS *p<0. 05
Dyspnea-IRV relationship during exercise in healthy, young males (n=12) Control DS CWS+DS TLC O’Donnell et al. J Appl Physiol 2000
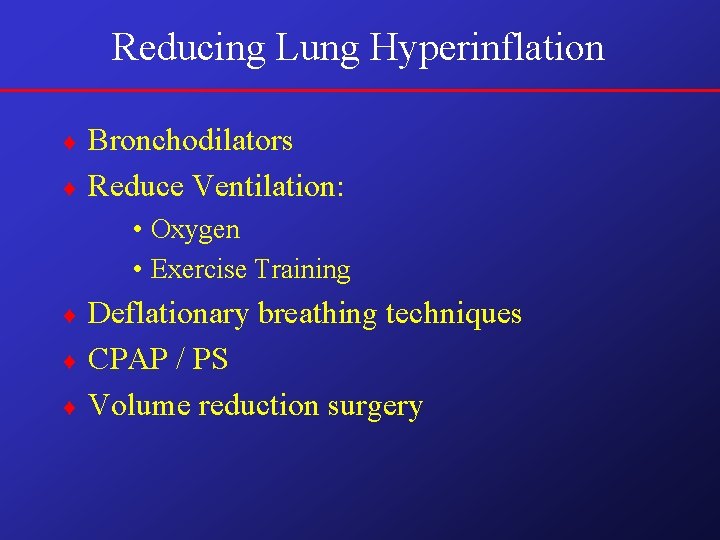
Reducing Lung Hyperinflation Bronchodilators ¨ Reduce Ventilation: ¨ • Oxygen • Exercise Training Deflationary breathing techniques ¨ CPAP / PS ¨ Volume reduction surgery ¨
Treatment Strategies Bronchodilators
Dyspnea Relief in Response to Bronchodilators [O'Donnell et al. AJRCCM 1998] *p<0. 05 pre vs. post-ipratropium bromide (IB)
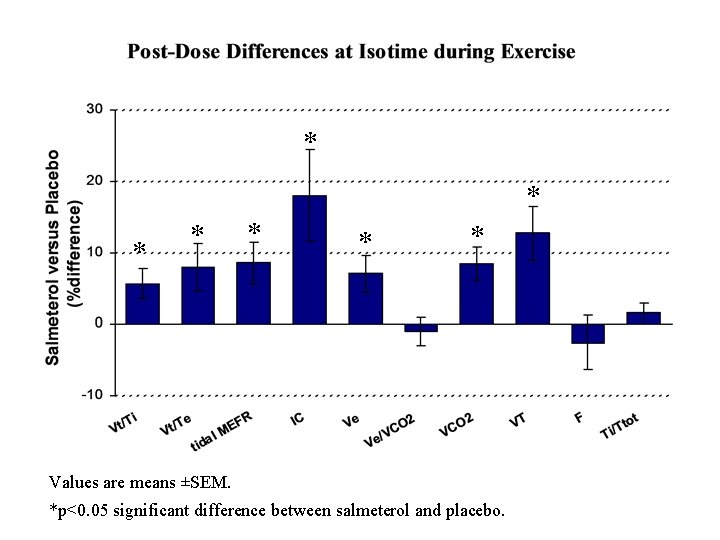
Effects of Salmeterol 50 g on the "Dyspnea Threshold"
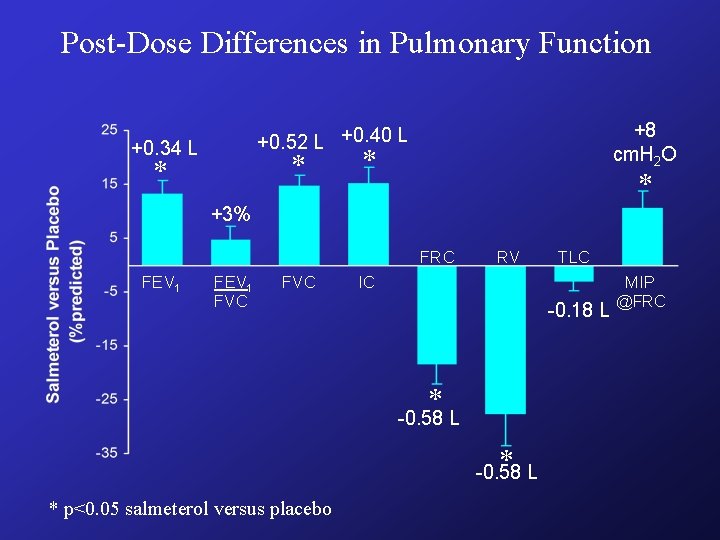
Post-Dose Differences in Pulmonary Function +8 cm. H 2 O +0. 52 L +0. 40 L +0. 34 L * * +3% FRC FEV 1 FVC RV IC MIP -0. 18 L * -0. 58 L * L -0. 58 * p<0. 05 salmeterol versus placebo TLC @FRC
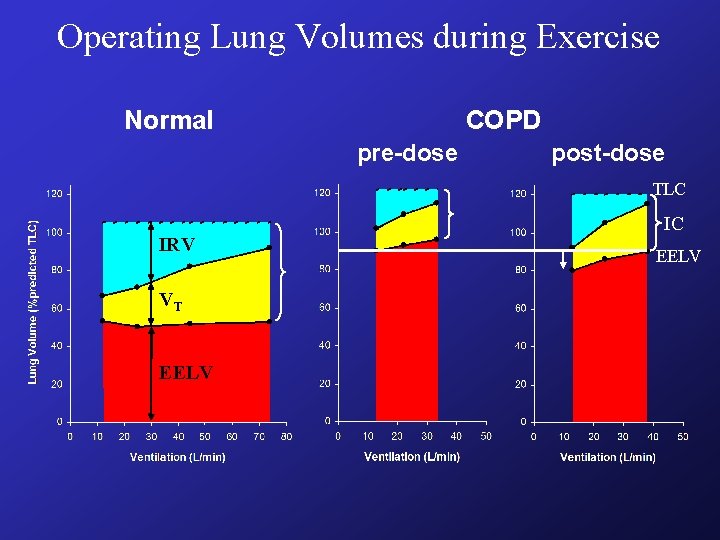
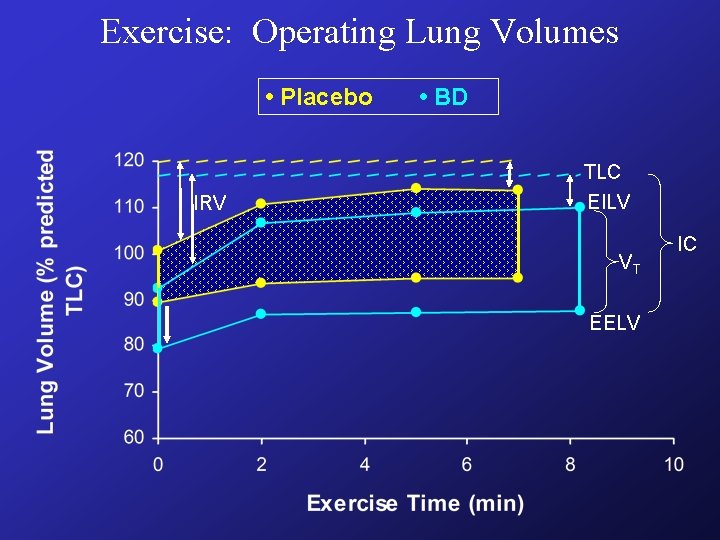
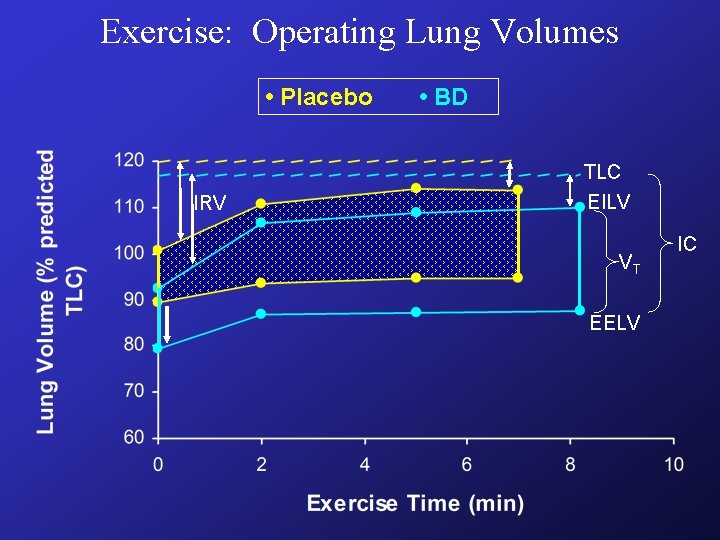
Operating Lung Volumes during Exercise Normal COPD pre-dose post-dose TLC IRV VT EELV IC EELV
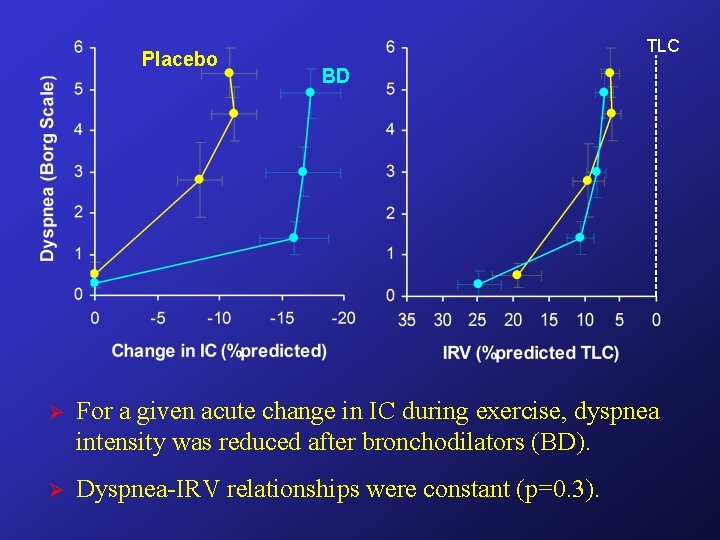
Placebo TLC BD Ø For a given acute change in IC during exercise, dyspnea intensity was reduced after bronchodilators (BD). Ø Dyspnea-IRV relationships were constant (p=0. 3).
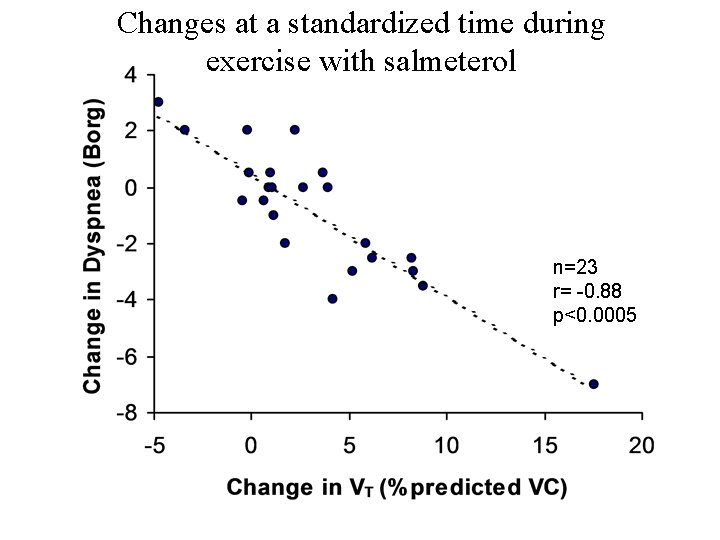
Changes at a standardized time during exercise with salmeterol n=23 r= -0. 88 p<0. 0005
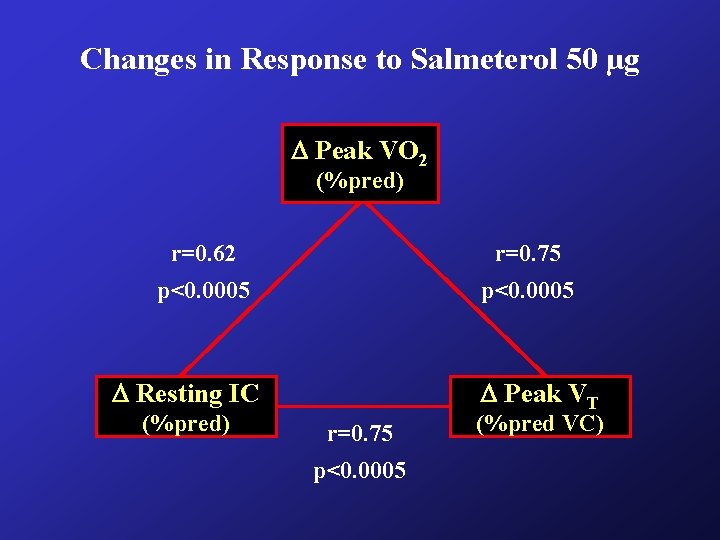
Changes in Response to Salmeterol 50 µg Peak VO 2 (%pred) r=0. 62 r=0. 75 p<0. 0005 Resting IC (%pred) Peak VT r=0. 75 p<0. 0005 (%pred VC)
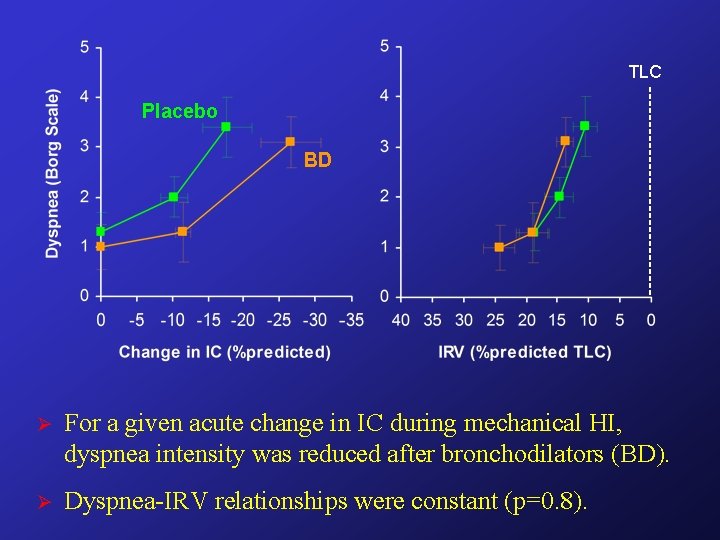
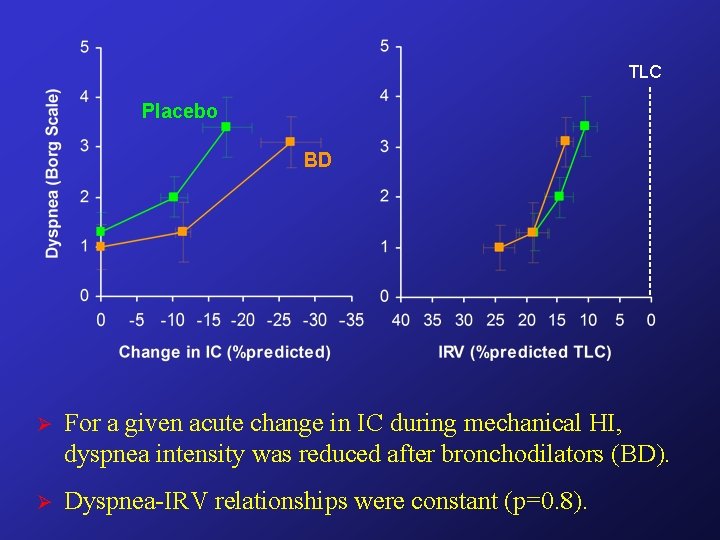
TLC Placebo BD Ø For a given acute change in IC during mechanical HI, dyspnea intensity was reduced after bronchodilators (BD). Ø Dyspnea-IRV relationships were constant (p=0. 8).
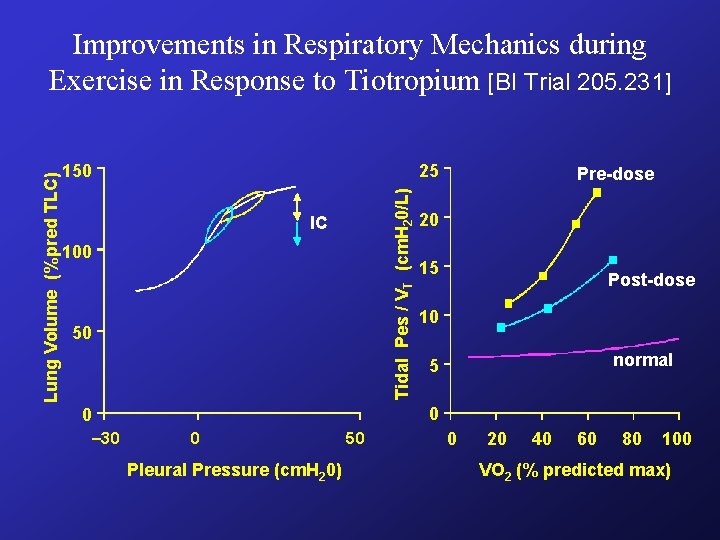
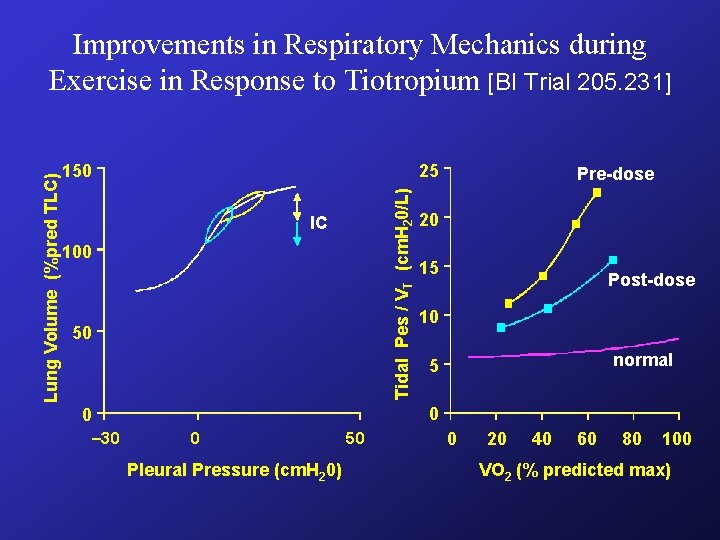
150 25 Tidal Pes / VT (cm. H 20/L) Lung Volume (%pred TLC) Improvements in Respiratory Mechanics during Exercise in Response to Tiotropium [BI Trial 205. 231] IC 100 50 20 15 Post-dose 10 normal 5 0 0 – 30 Pre-dose 0 Pleural Pressure (cm. H 20) 50 0 20 40 60 80 100 VO 2 (% predicted max)
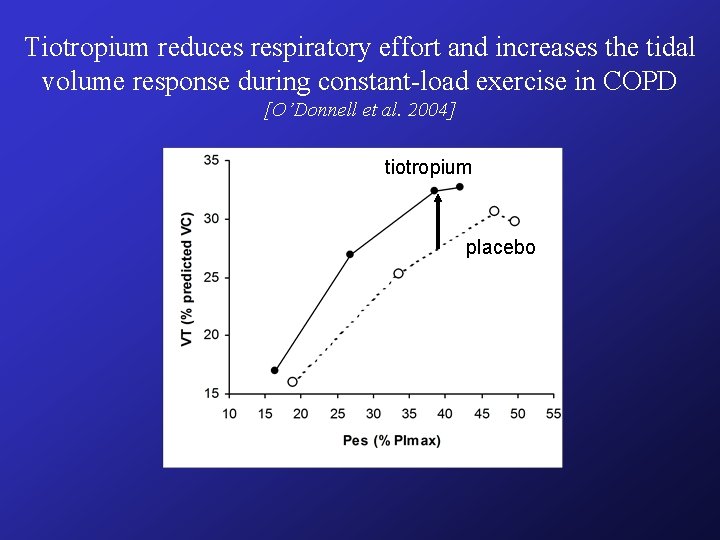
Tiotropium reduces respiratory effort and increases the tidal volume response during constant-load exercise in COPD [O’Donnell et al. 2004] tiotropium placebo
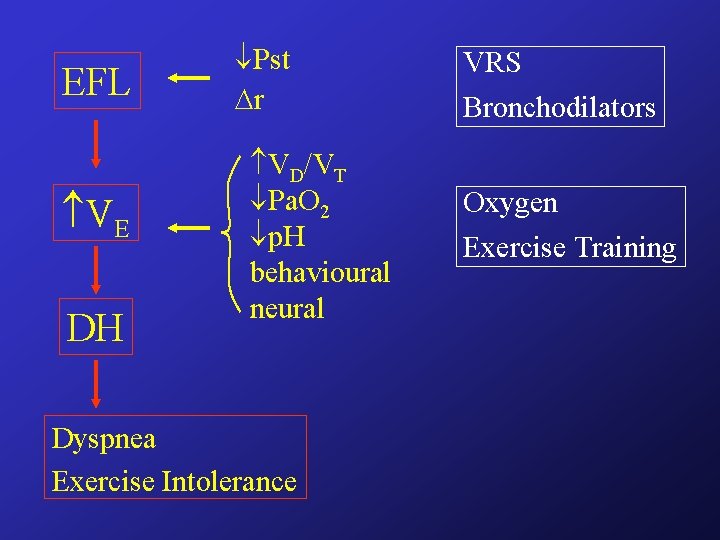
EFL VE DH Pst r VD/VT Pa. O 2 p. H behavioural neural Dyspnea Exercise Intolerance VRS Bronchodilators Oxygen Exercise Training
Treatment Strategies O 2 Therapy
Responses to Oxygen during Exercise [O'Donnell et al. AJRCCM 2001] RA O 2 ** isotime Exercise time (min) *p<0. 05, **p<0. 01 difference at isotime
Responses to Oxygen during Exercise [O'Donnell et al. AJRCCM 2001] TLC IRV* RA EILV* O 2 RA VT EELV* *p<0. 05 significant difference at isotime * O 2
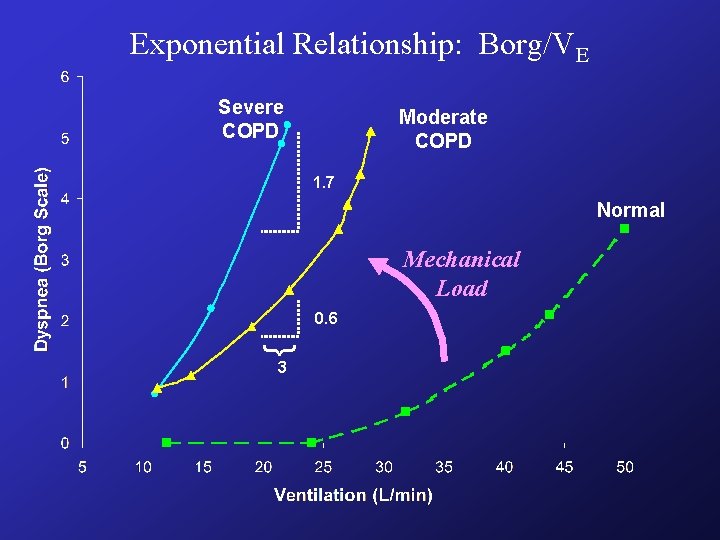
Exponential Relationship: Borg/VE Severe COPD Moderate COPD 1. 7 Normal Mechanical Load 0. 6 } 3
Summary • Exertional dyspnea in COPD is associated with acute-on-chronic Hyperinflation • Unsatisfied inspiration is an important qualitative dimension • Acute mechanical DH, not associated with volume restriction, or increased drive, is well tolerated in COPD
Summary (ctd). • The dyspnea-IRV relation remains constant despite large variation in pa. O 2, pa. CO 2, Ve breathing pattern, Pes/PI max or shifts in baseline mechanics. • • Inability to appropriately expand Vt in response to increased central drive may lead to the perception of “unsatisfied inspiration”
Clinical Implications • Measures that delay the attenuation of IRV during exercise will relieve dyspnea by enhancing Neuro-mechanical coupling.
Neuromechanical Dissociation Corollary Discharge Feedback Neuromechanical Coupling Reflexic Drive Motor Output Mechanical Response
Effects of Salmeterol 50 g on the "Dyspnea Threshold"
Exercise: Operating Lung Volumes • Placebo IRV • BD TLC EILV VT EELV IC
TLC Placebo BD Ø For a given acute change in IC during mechanical HI, dyspnea intensity was reduced after bronchodilators (BD). Ø Dyspnea-IRV relationships were constant (p=0. 8).
Neuromechanical Coupling / Dissociation normal COPD ILD
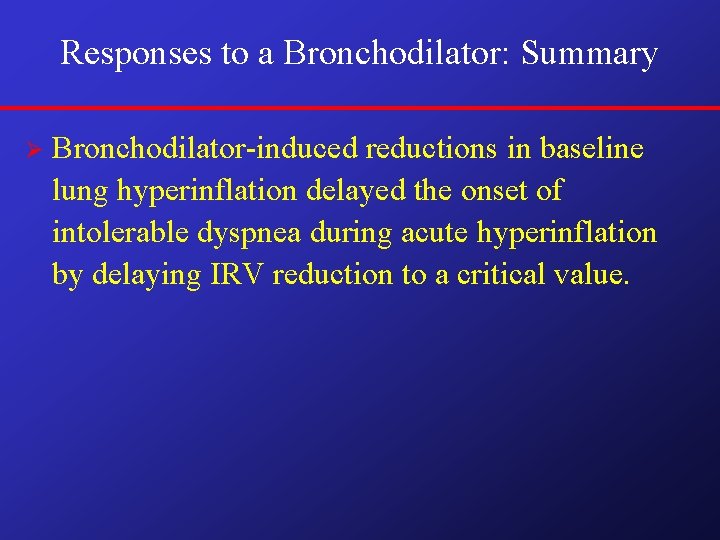
Responses to a Bronchodilator: Summary Ø Bronchodilator-induced reductions in baseline lung hyperinflation delayed the onset of intolerable dyspnea during acute hyperinflation by delaying IRV reduction to a critical value.
* * * * Values are means ±SEM. *p<0. 05 significant difference between salmeterol and placebo.
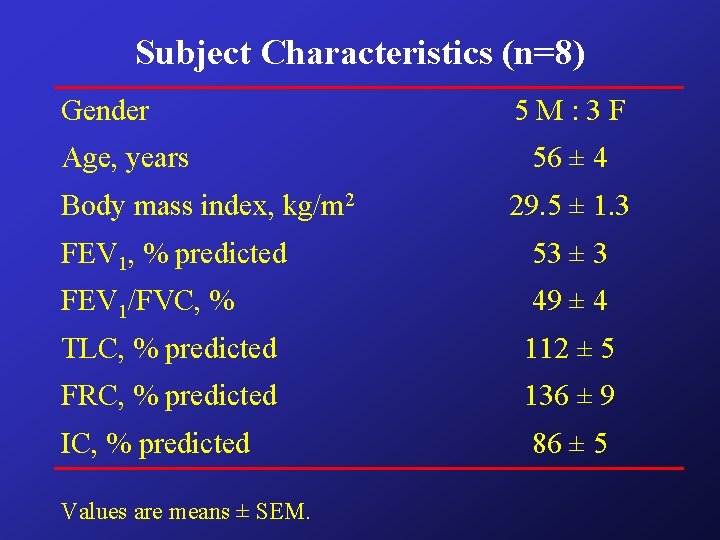
Subject Characteristics (n=8) Gender Age, years Body mass index, kg/m 2 5 M: 3 F 56 ± 4 29. 5 ± 1. 3 FEV 1, % predicted 53 ± 3 FEV 1/FVC, % 49 ± 4 TLC, % predicted 112 ± 5 FRC, % predicted 136 ± 9 IC, % predicted 86 ± 5 Values are means ± SEM.
150 25 Tidal Pes / VT (cm. H 20/L) Lung Volume (%pred TLC) Improvements in Respiratory Mechanics during Exercise in Response to Tiotropium [BI Trial 205. 231] IC 100 50 20 15 Post-dose 10 normal 5 0 0 – 30 Pre-dose 0 Pleural Pressure (cm. H 20) 50 0 20 40 60 80 100 VO 2 (% predicted max)
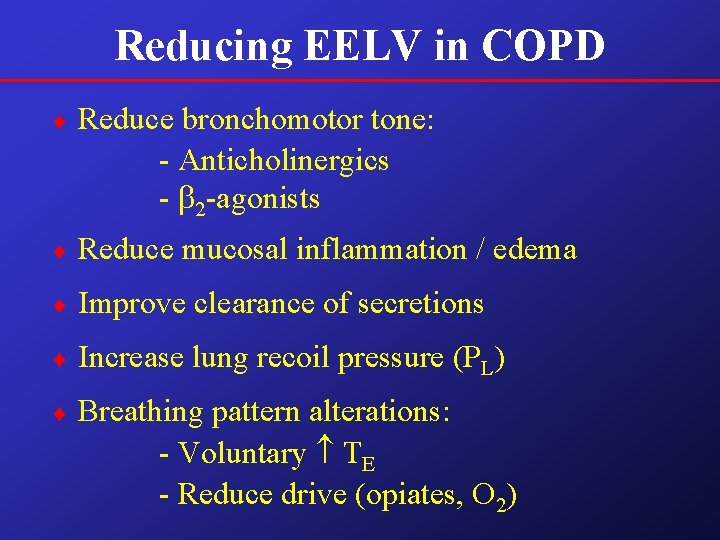
Reducing EELV in COPD ¨ Reduce bronchomotor tone: - Anticholinergics - 2 -agonists ¨ Reduce mucosal inflammation / edema ¨ Improve clearance of secretions ¨ Increase lung recoil pressure (PL) ¨ Breathing pattern alterations: - Voluntary TE - Reduce drive (opiates, O 2)
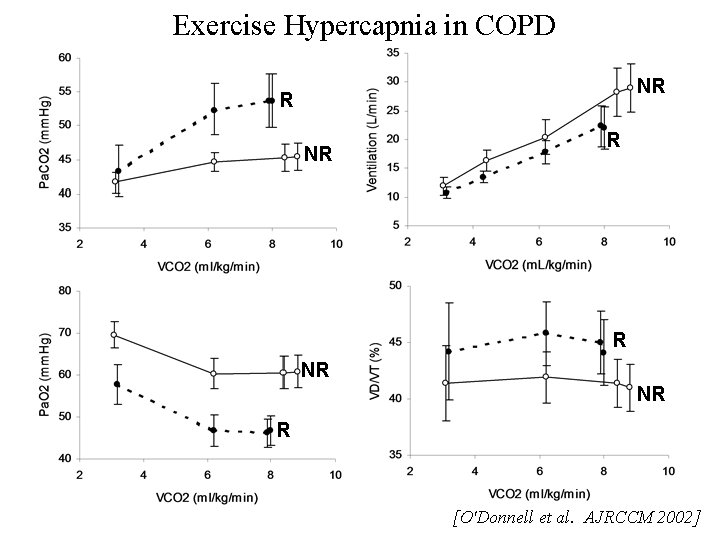
Exercise Hypercapnia in COPD NR R R NR NR R [O'Donnell et al. AJRCCM 2002]
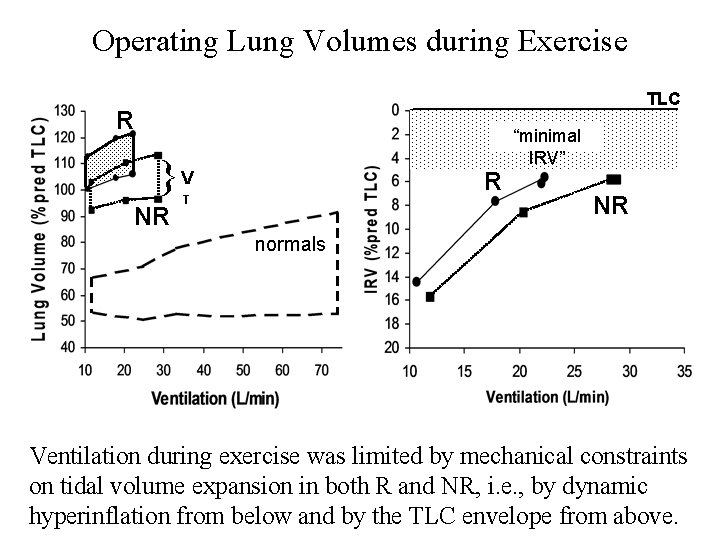
Operating Lung Volumes during Exercise TLC R }V NR R T “minimal IRV” NR normals Ventilation during exercise was limited by mechanical constraints on tidal volume expansion in both R and NR, i. e. , by dynamic hyperinflation from below and by the TLC envelope from above.
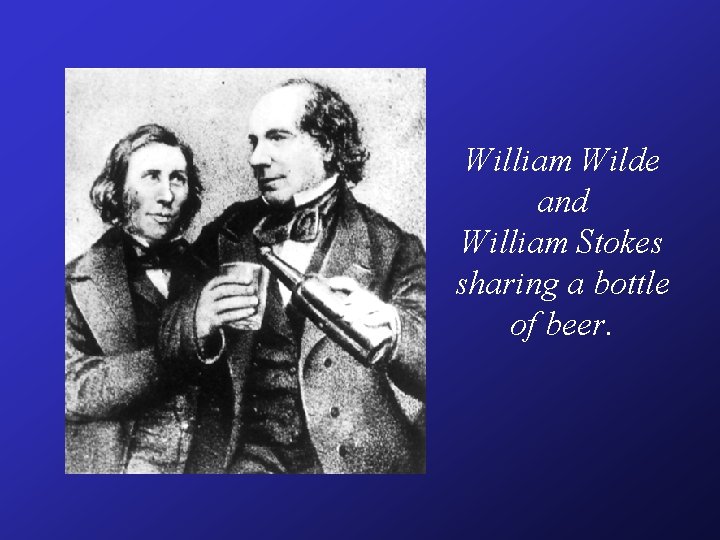
William Wilde and William Stokes sharing a bottle of beer.
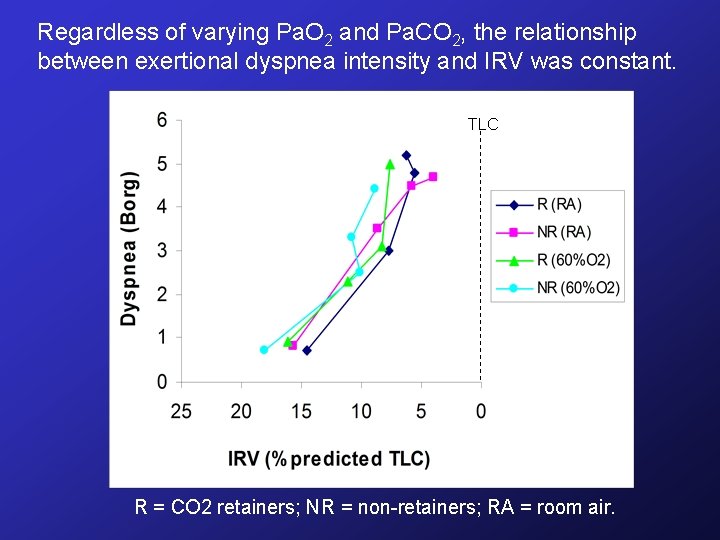
Regardless of varying Pa. O 2 and Pa. CO 2, the relationship between exertional dyspnea intensity and IRV was constant. TLC R = CO 2 retainers; NR = non-retainers; RA = room air.
Neuromechanical Dissociation Corollary Discharge Feedback Neuromechanical Coupling Reflexic Drive Motor Output Mechanical Response
Exercise: Operating Lung Volumes • Placebo IRV • BD TLC EILV VT EELV IC