Dynamic CT imaging DCECT in the antiangiogenic response
 in the anti-angiogenic response in Metastatic Renal Cell Carcinoma Prof.")


 over time 4 1 2 1 4 3 2 3")

 (for target selection) => Functional")


 Tissue response")
 (ml/min/100 ml) Fractional Blood")
 FT (ml/min/100 ml) BV (%) OUT IN Mean Transit")
 k(2, 3) Capillaire Q cap 1")

 -22. 9 [-27. 3; -5.")
 -22. 9 [-27. 3; -5. 7")


![Stable N=20 Progression N=2 P (S vs. R) 119. 5 [74. 1; 224. 3]](https://slidetodoc.com/presentation_image_h/30e14cb60cdb43d018fce65f6bf2c43c/image-29.jpg "Stable N=20 Progression N=2 P (S vs. R) 119. 5 [74. 1; 224. 3]")

 (N = 5, 10%)")


- Slides: 45
Dynamic CT imaging (DCE-CT) in the anti-angiogenic response in Metastatic Renal Cell Carcinoma Prof. C A Cuenod , L Fournier, G Frija Laboratoire de Recherche en Imagerie, Université Paris R Descartes. Radiology, Hôpital Européen Georges Pompidou, Paris ESUR Munich 2008
Tumour angiogenesis is a major topic in oncology 1971 Judah Folkman New England Journal of Medecine
Tumour neo-angiogenesis « Under the stimuli of malignant cells, the endothelial cells build a complete new network of capillaries » R Jain
Tumor angiogenesis IGF-1 PDGF EGF IL-8 Growth Factors H 2 O 2 VEGF release b. FGF Binding and activation of VEGF receptor Hypoxia COX-2 NO Oncogenes Increased expression (MMP, t. PA, u. PAr, e. NOS, etc. ) P– P– Survival –P –P Proliferation Angiogenesis Migration Permeability Folkman. NEJM 1971; 285: 1182 -1186
Avastin Sorafenib / Nexavar Endothelial Cell membrane Sunitinib /Sutent Sorafenib RAD 001 Anti-angiogenic treatment Patel Br J Cancer 2006
Surrogate markers reflecting treatment efficacy v Reference = tumour size RECIST = Response Evaluation RECIST Criteria in Solid Tumors Therasse P. et al, J Natl Cancer Inst 2000; 92: 205 -16 v Functional imaging = measuring tumour vascularisation, target of anti -angiogenic drugs
RECIST = Response Evaluation Criteria in Solid Tumors Therasse P. et al, J Natl Cancer Inst 2000; 92: 205 -16 Measuring (and adding) the longest diameters in targets
% variation of the sum Progressive disease PD +20% Stable Disease SD -30% Partial Response PR 0 BASELINE 1 2 3 4 5 Treatment cycles
% variation of the sum Progressive disease PD +20% -30% Time to progression 1 2 3 4 5 Treatment cycles
Size variation in RCC under anti-angiogenic treatment vs. placebo Groupe placebo Placebo Groupe sous traitement Treatment
DCE-Imaging Functional evaluation
precontrast 90 s postcontrast
Regions of interest (ROIs) over time 4 1 2 1 4 3 2 3
Patients v Patients: Metastatic RCC v April 2004 -May 2006 v Clinical trials: Sorafenib / Nexavar® vs. placebo Sunitinib / Sutent® vs. interferon
Acquisition 1 - First exam before IV (low dose) (for target selection) => Functional target selection 2 - Dynamic Acquisition low dose: 80 m. L contrast = 3 x 30 s-breathholds, 1 image/s for 90 s 3 - ‘Standard’ whole-body acquisition (+40 m. L) ---------Total injection 120 m. L (Xenetix®, 350 mg I/m. L) 80 k. V Radiation dose supplement 200/2000 m. Gy/cm
Choice of functional target v Size > 2 cm v Minimal movements Retroperitoneum > mediastinum > lung v Not liver or bone (medullary)
Results
ARTERY (Arterial Input Function) Tissue response
Main microvascular parameters Fractional intersitial volume Regional blood perfusion (%) (ml/min/100 ml) Fractional Blood volume (%) OUT IN Permeability x surface (ml/min/100 ml)
Main microvascular parameters Ve (%) FT (ml/min/100 ml) BV (%) OUT IN Mean Transit time TTM= VB/FT PS (ml/min/100 ml) Dependent on tracer
Modélisation Analyse compartimentale Artere q artere k(2, 1) k(2, 3) Capillaire Q cap 1 2 k(0, 2) Interstitium q inter k(3, 2) q Tumeur 3
Can we detect an effect on tumour vessels after a single cycle of treatment by antiangiogenic drugs?
Placebo N=8 Interferon N=5 Tissue Blood flow (ml/min/100 ml) -22. 9 [-27. 3; -5. 7 -6. 1 [-18. 8; 0. 8] Antiangiogenic N=25 -50 [-72; -3] Tissue Blood volume (%) -4. 2 [-22. 0; 5. 6] 2. 0 [-5. 5; 18. 0] -51 [-67; -24] Mean transit time (s) Permeability surface area product (m. L/min/100 ml) 17. 0 [7. 4; 28. 5] -2. 4 [-10. 2; 16. 6] 5 [-22; 73] -29. 2 [-47. 4; -14. 5] 16. 4 [-11. 9; 20. 9] -34* [-83 ; 8] 5. 5 [-1. 0; 11. 8] -3. 8 [-16. 5; -0. 7] -17 [-29. 0; -7. 0] Variable* (%) Sum of longest diameters (mm) * Significant for Nexavar, not Sutent
Placebo N=8 Interferon N=5 Blood flow (ml/min/100 ml) -22. 9 [-27. 3; -5. 7 -6. 1 [-18. 8; 0. 8] Antiangiogenic N=25 -50 [-72; -3] Blood volume (%) -4. 2 [-22. 0; 5. 6] 2. 0 [-5. 5; 18. 0] -51 [-67; -24] Mean transit time (s) Permeability surface area product (m. L/min/100 ml) 17. 0 [7. 4; 28. 5] -2. 4 [-10. 2; 16. 6] 5 [-22; 73] -29. 2 [-47. 4; -14. 5] 16. 4 [-11. 9; 20. 9] -34 [-83 ; 8] 5. 5 [-1. 0; 11. 8] -3. 8 [-16. 5; -0. 7] -17 [-29. 0; -7. 0] Variable* (%) Sum of longest diameters (mm)
RCC metastasis under anti-angiogenic therapy: Good responder 01/12/04 BF : 130 16/06/05 BF : 18
RCC metastasis under anti-angiogenic therapy: Poor responder 03/01/05 BF : 250 12/04/05 BF : 230
DCE-CT vs morphology Baseline Blood Flow maps Cycle 1 – 6 weeks Cycle 4 – 30 weeks 0 -5 Size variation (%) -10 -15 -20 -25 -30 -35 -40 05/05 1 2 3 4 5
Can baseline parameters as measured by functional imaging predict future tumour response?
Stable N=20 Progression N=2 P (S vs. R) 119. 5 [74. 1; 224. 3] 190. 5 [162. 5; 218. 5] 0. 04 15. 5 [9. 0; 24. 5] 8. 2 [5. 6; 14. 9] 9. 6 [9. 2; 10. 1] 0. 02 5. 6 [3. 5; 9. 5] 9. 0 [5. 0; 13. 6] 5. 4 [5. 1; 5. 7] 0. 07 Surface permeability product (m. L/min/100 ml) 9. 9 [9. 1; 21. 1] 7. 3 [6. 0; 13. 2] 9. 0 [8. 7; 9. 3] 0. 12 Sum of longest diameters (mm) 104. 0 [76. 0 ; 252. 0] 155. 0 [91. 0 ; 198. 5] 73. 0 [50. 0 ; 96. 0] 0. 18 Variable (%) Response N=10 Blood flow 245. 3 (m. L/min/100 ml) [130. 3; 453. 5] Blood volume (m. L/min/100 ml) Mean transit time (s)
Limits – clinical study v Difficulties 50% of patient data incomplete or data analysis failed v 102 patients in clinical trial 51 patients successful DCE-CT
DCE analysis failed v CT not injected (allergy, kidney failure) (N = 5, 10%) v CT not performed at our institution (N = 23, 45%) v Baseline perfusion acquisition not performed (N = 10, 18%) v Failure of modeling: movement, SNR (N = 13, 23%)
AIF
Limits – clinical study v Inter-investigator reproducibility 2 investigators
Blood flow – investigator #2 R = 0. 91 R² = 0. 82 Blood flow – investigator #1
PS – investigator #2 R = 0. 45 R² = 0. 20 PS – investigator #1
Clinical study: conclusions v DCE-CT can be used in a clinical context v Difficulties to implement the technique • organisation +++ • motion (lung metastases)
IRM vs CT
Critères dynamiques Profil « malignité » …. . « bénignité » Kuhl Eur. Radiol. 2000; 10: 46 -58 57% des K 5% des L. Bénignes 34 % des K 12% des LB Kuhl Eur. Radiol. 2000; 10: 46 -58 9% des K 83% des LB
Remarques techniques
Correction des mouvements respiratoires
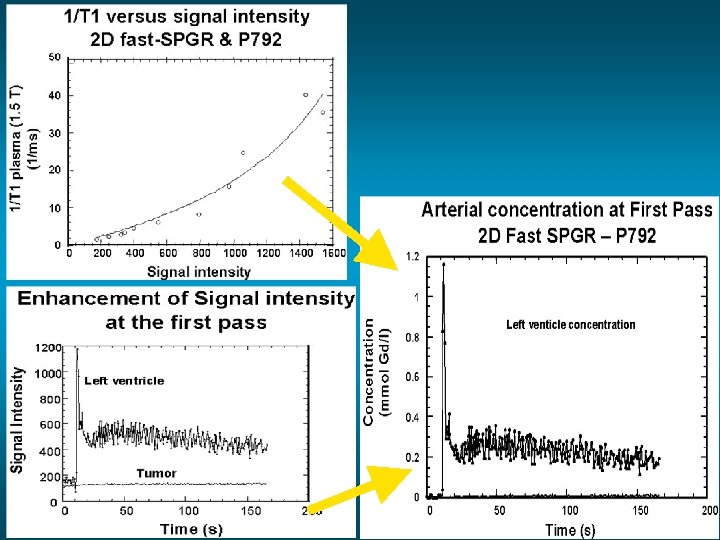
Arterial input function • True individual AIF • Mean AIF • Synthetic AIF
Peak is missed Steady state Slope 1 image/ 10 sec 1 image / 1 min
Tumor treatment Tumor volume function Hours/Days Weeks