Dynamic Analysis Looking Back and the Road Ahead

Dynamic Analysis: Looking Back and the Road Ahead Trishul Chilimbi Runtime Analysis & Design (RAD) Research in Software Engineering (Ri. SE) Microsoft Research
Dynamic Analysis Breakdown n Measurement n Representation n Analysis WODA '09 2
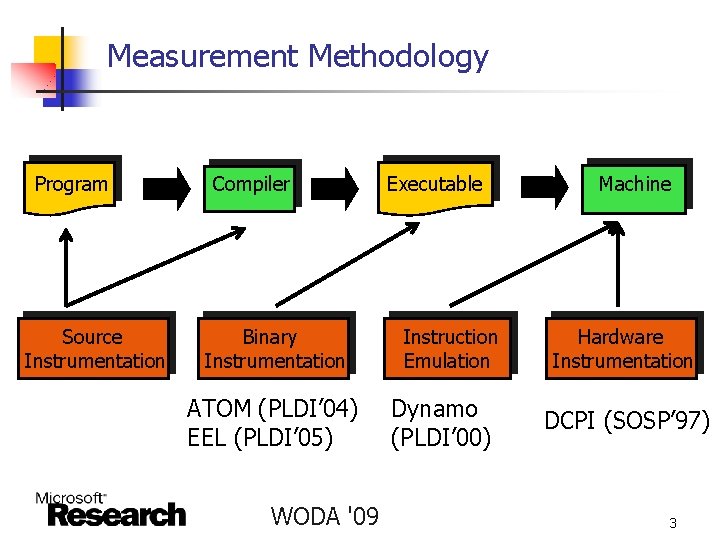
Measurement Methodology Program Source Instrumentation Compiler Binary Instrumentation ATOM (PLDI’ 04) EEL (PLDI’ 05) WODA '09 Executable Instruction Emulation Dynamo (PLDI’ 00) Machine Hardware Instrumentation DCPI (SOSP’ 97) 3
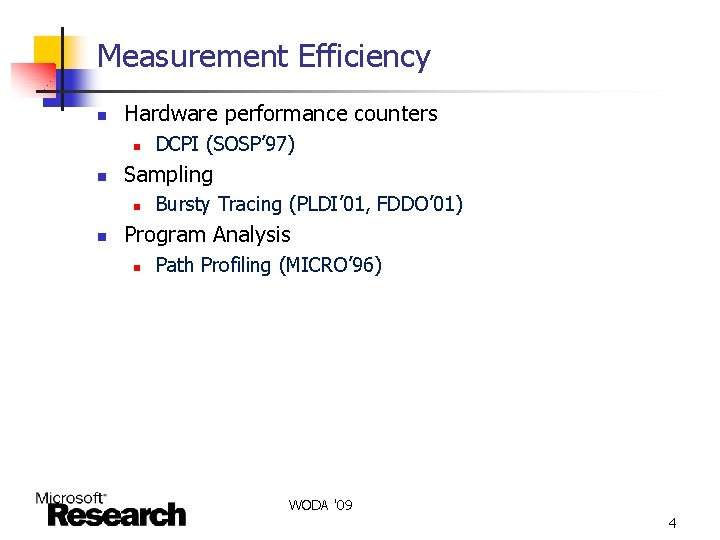
Measurement Efficiency n Hardware performance counters n n Sampling n n DCPI (SOSP’ 97) Bursty Tracing (PLDI’ 01, FDDO’ 01) Program Analysis n Path Profiling (MICRO’ 96) WODA '09 4
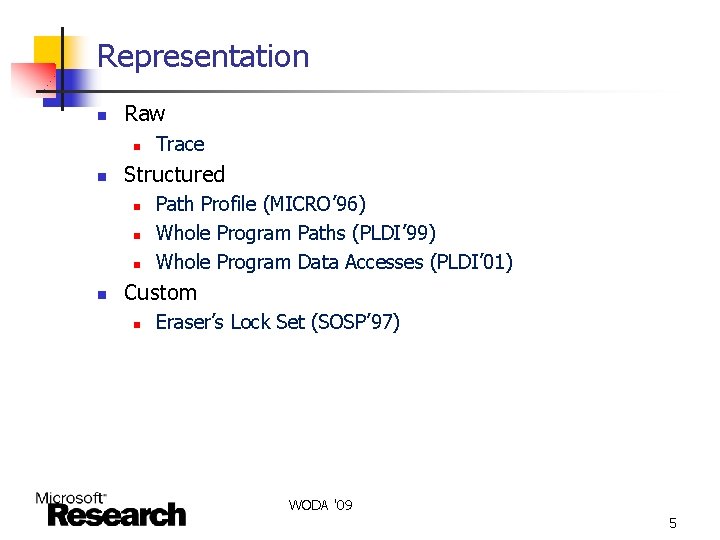
Representation n Raw n n Structured n n Trace Path Profile (MICRO’ 96) Whole Program Paths (PLDI’ 99) Whole Program Data Accesses (PLDI’ 01) Custom n Eraser’s Lock Set (SOSP’ 97) WODA '09 5
Analysis n Performance n n Correctness n n Profiling and profile-driven optimization Bug detection, heap and concurrency checkers Security n Security monitors, Taint Analysis WODA '09 6
Dynamic Analysis: The Road Ahead n n Industrial-strength dynamic analysis Scaling dynamic analysis to process and analyze large quantities of data n n System Level Data Centers, Multi-core WODA '09 7
Scaling Dynamic Analyses n System level analysis n Instrumentation n n Event Tracing for Windows (ETW) Data volume n n Statistical Analysis Visualization WODA '09 8
ETW Tracing Infrastructure n n n General purpose real-time event logging facility Core component of Windows operating systems starting with Windows 2000, continually extended and improved High speed n n Low overhead n n n Immune to app crashes and hangs Writes to a file or to a real time listener Dynamically enabled or disabled n n n less than 5% of the total CPU cycles for 20, 000 events/sec Works for both user mode applications and drivers n n 1200 to 2000 cycles per logging No re-compile, no reboots, no app restarts, … Designed for app tracing in production mode Scalable WODA '09 9
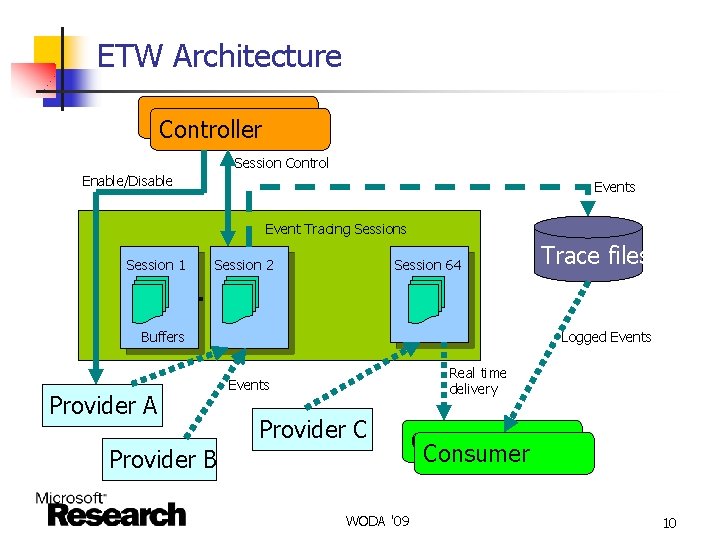
ETW Architecture Controller Session Control Enable/Disable Events Event Tracing Sessions Session 1 Session 2 Session 64 … Buffers Provider A Trace files Logged Events Real time delivery Events Provider C Provider B WODA '09 Consumer 10
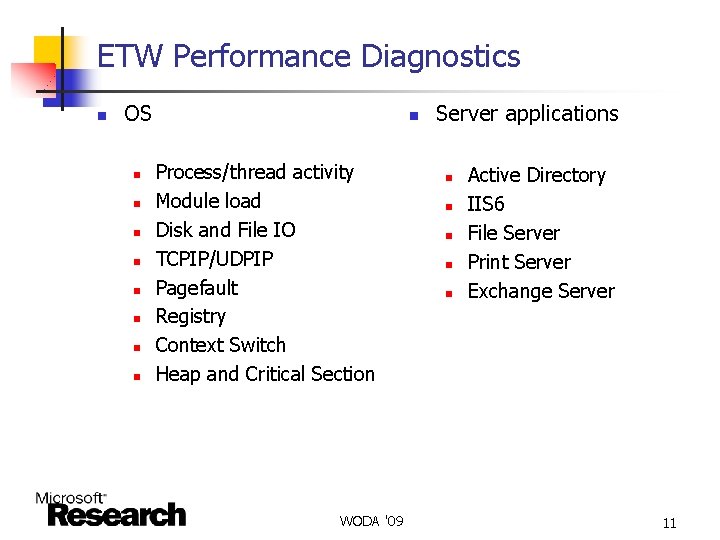
ETW Performance Diagnostics n OS n n n n n Process/thread activity Module load Disk and File IO TCPIP/UDPIP Pagefault Registry Context Switch Heap and Critical Section WODA '09 Server applications n n n Active Directory IIS 6 File Server Print Server Exchange Server 11
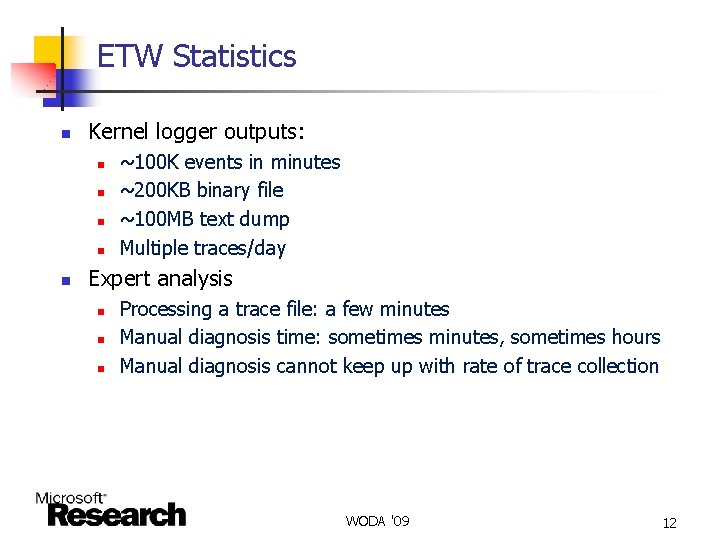
ETW Statistics n Kernel logger outputs: n n n ~100 K events in minutes ~200 KB binary file ~100 MB text dump Multiple traces/day Expert analysis n n n Processing a trace file: a few minutes Manual diagnosis time: sometimes minutes, sometimes hours Manual diagnosis cannot keep up with rate of trace collection WODA '09 12
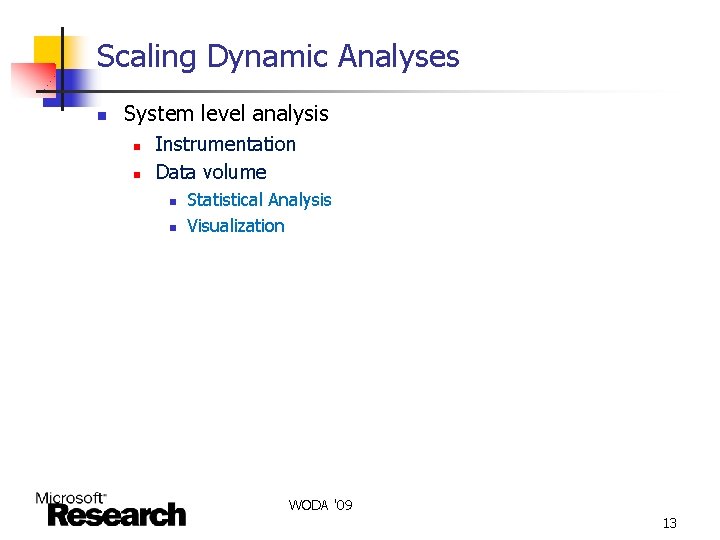
Scaling Dynamic Analyses n System level analysis n n Instrumentation Data volume n n Statistical Analysis Visualization WODA '09 13
Hang. Viz n n n Lock/resource contention lies at the root of many performance problems Kernel manages most resources – not visible to application developer Our solution 1. 2. 3. 4. 5. n Start from an observed hang Pull out all relevant lock-related waits, represented as a directed acyclic graph (DAG) Highlight critical path Provide visualization tool for further exploration Iterative feedback cycle Joint work with Alice Zheng, Steve Hsaio, David Andrzewejski WODA '09 14
Hang. Viz Outline n n n Constructing the Ready DAG Finding the critical path Visualization WODA '09 15
Constructing A Ready DAG n Relevant ETW events n n Currently ETW does not track lock object ID n n CSwitch: context switches Ready. Thread: thread releasing resource Stack: lock functions Stack functions are used to differentiate between different locks, but the signature is not perfect Sequence of wait and run intervals and Ready. Thread signals can be represented as a directed acyclic graph (DAG) WODA '09 16
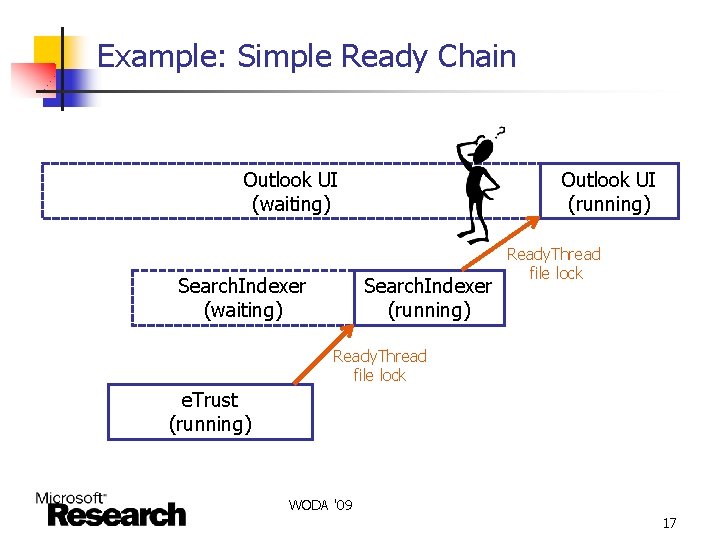
Example: Simple Ready Chain Outlook UI (waiting) Search. Indexer (waiting) Outlook UI (running) Search. Indexer (running) Ready. Thread file lock e. Trust (running) WODA '09 17
Complications: Non-Immediate Waits n The immediate ready chain may not be the root cause of the problem WODA '09 18
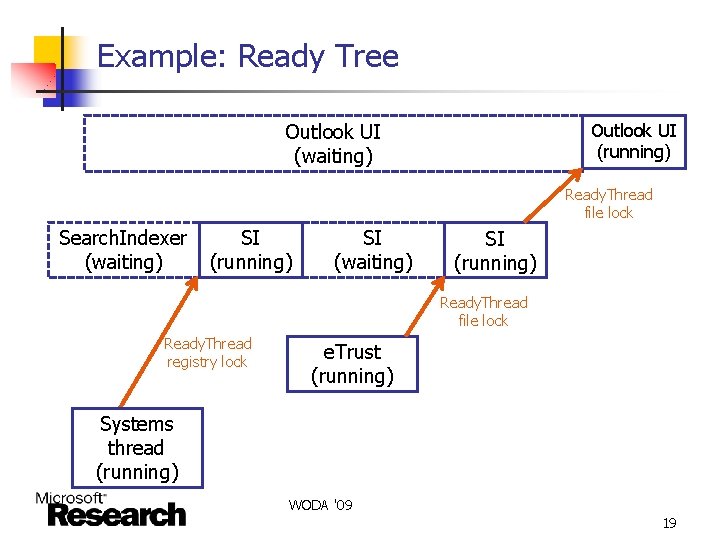
Example: Ready Tree Outlook UI (waiting) Outlook UI (running) Ready. Thread file lock Search. Indexer (waiting) SI (running) SI (waiting) SI (running) Ready. Thread file lock Ready. Thread registry lock e. Trust (running) Systems thread (running) WODA '09 19
Solution: Follow Overlapping Waits n Look at all ready chains during the long wait n n n Follow any wait of the parent thread (e. g. , Search. Indexer) that overlaps with the child wait Repeat on parent thread Optional search depth to limit branching factor WODA '09 20
More Complications: False Runs n The thread runs, but not because the resource has been released n n n Timer wake up – thread wakes up, lock is still not available, thread goes back to sleep APC – thread is woken up to execute code for someone else Bottomline: timer wake ups and APCs do NOT terminate the wait, should be counted towards total wait time WODA '09 21
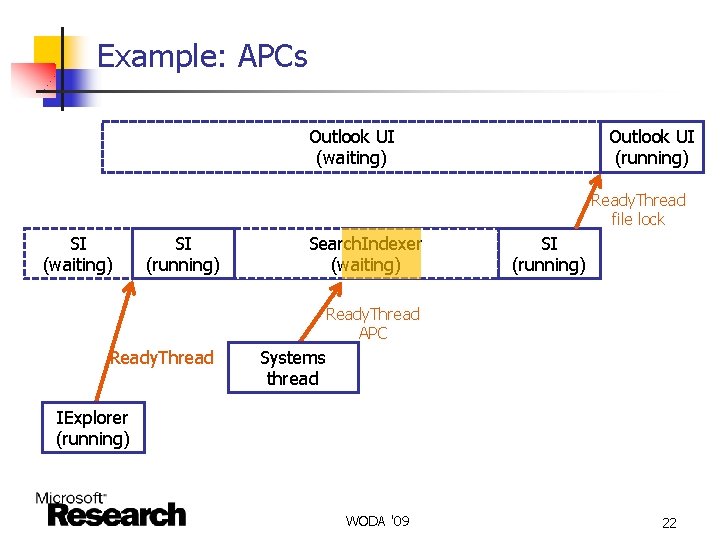
Example: APCs Outlook UI (waiting) Outlook UI (running) Ready. Thread file lock SI (waiting) SI (running) SI Search. Indexer SI SI (waiting) (running) (waiting) SI (running) Ready. Thread APC Ready. Thread Systems thread IExplorer (running) WODA '09 22
Finding Individual Critical Waits n Algorithm for finding individual critical waits n n Bucket wait times by their lock set (set of lock-related functions on the stack) For each lock set, build probabilistic model of wait time n n n Gaussian, exponential, Gamma, or mixture of Gaussians Select the best model for each lock set A long wait is critical if it has extremely low probabilities under the model WODA '09 23
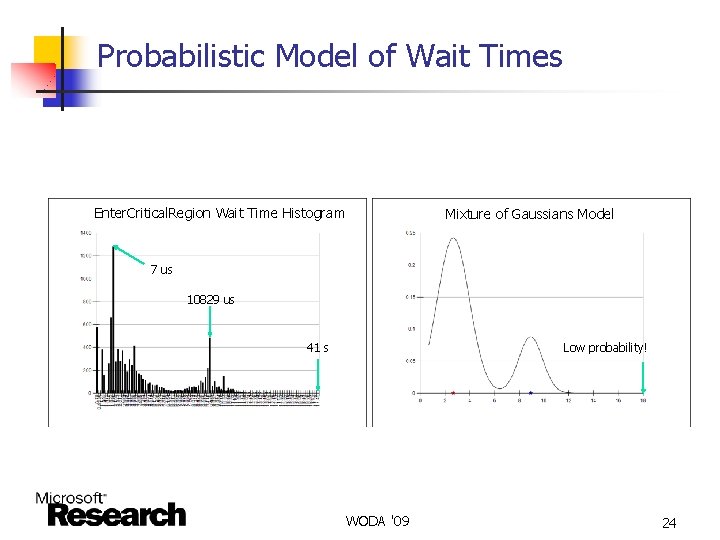
Probabilistic Model of Wait Times Enter. Critical. Region Wait Time Histogram Mixture of Gaussians Model 7 us 10829 us 41 s Low probability! WODA '09 24
Finding the Critical Path n n Ready DAGs can be complex But there should be only one critical path n n n One resource holding up the entire chain (for example, network or I/O) Multiple threads on the chain are experiencing long waits Critical path probably has longest average wait time n Other possible metrics n n maximum wait time: might be shared among multiple paths longest chain: could have many short waits longest chain with longest average wait time Possible expansion to cross-trace analysis WODA '09 25
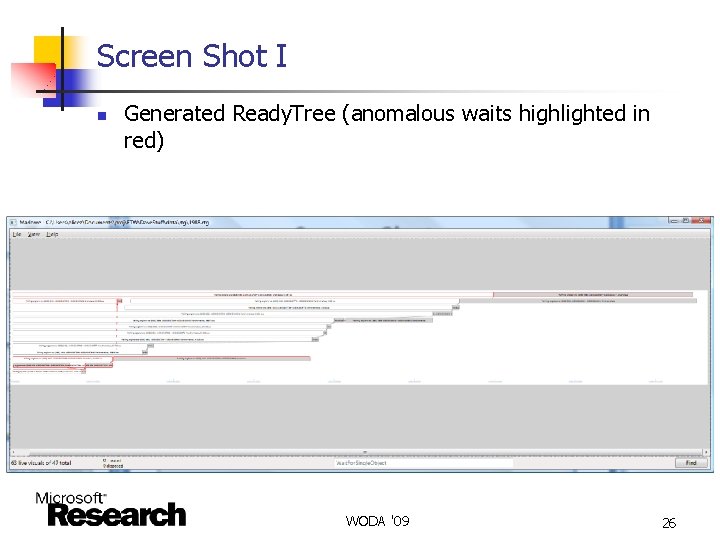
Screen Shot I n Generated Ready. Tree (anomalous waits highlighted in red) WODA '09 26
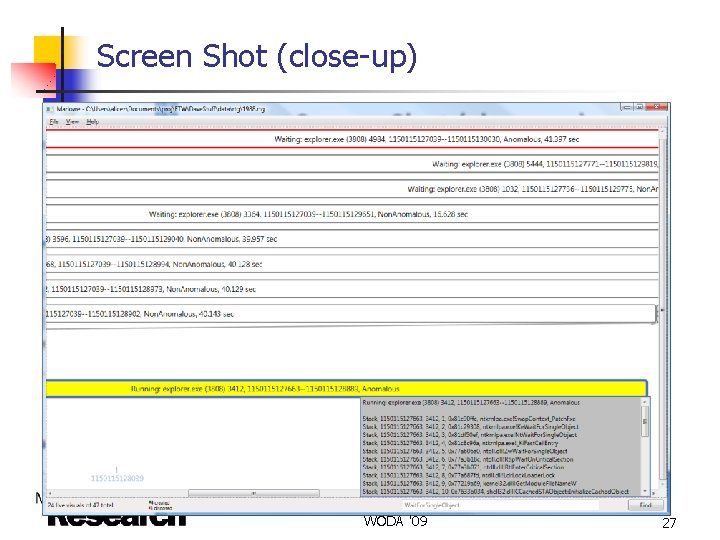
Screen Shot (close-up) WODA '09 27
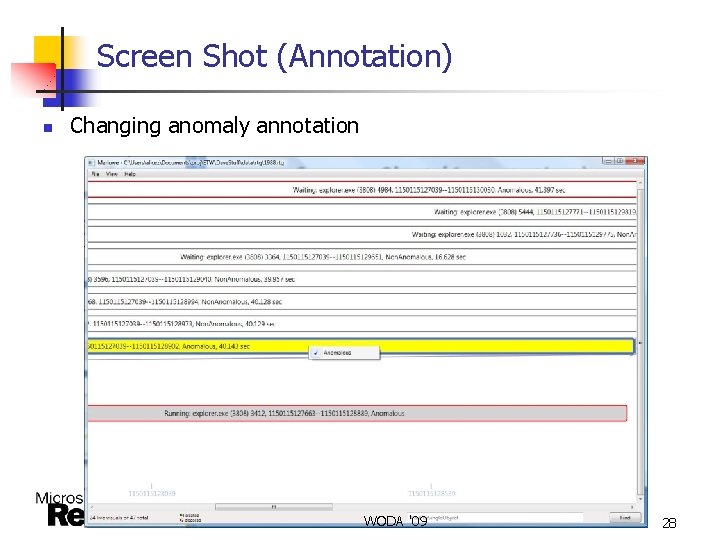
Screen Shot (Annotation) n Changing anomaly annotation WODA '09 28
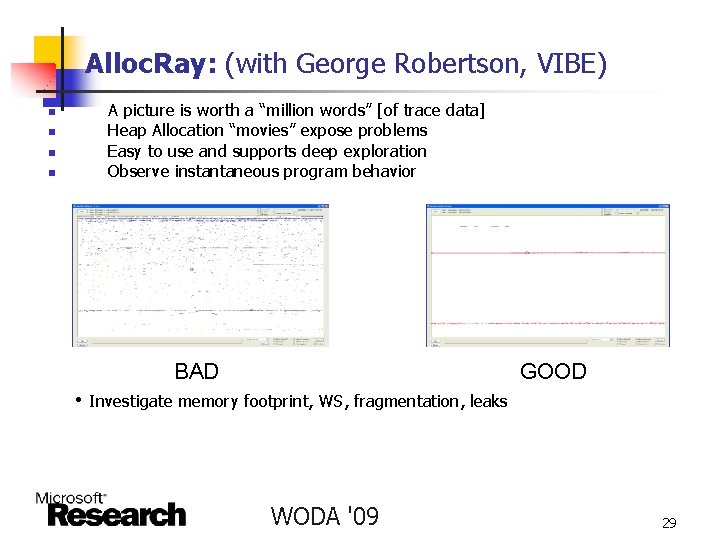
Alloc. Ray: (with George Robertson, VIBE) n n A picture is worth a “million words” [of trace data] Heap Allocation “movies” expose problems Easy to use and supports deep exploration Observe instantaneous program behavior BAD GOOD • Investigate memory footprint, WS, fragmentation, leaks WODA '09 29
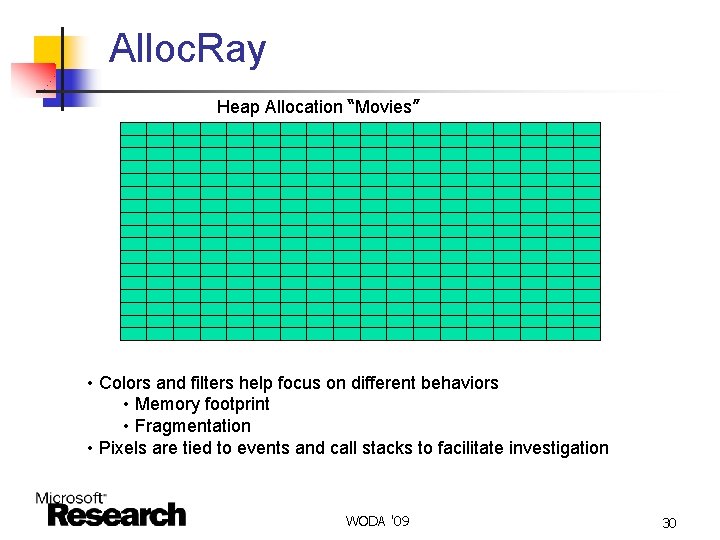
Alloc. Ray Heap Allocation “Movies” • Colors and filters help focus on different behaviors • Memory footprint • Fragmentation • Pixels are tied to events and call stacks to facilitate investigation WODA '09 30
Scaling Dynamic Analyses n Data centers n n n 10, 000+ machines running web services such as search, mail, online shopping Large opportunity for dynamic analyses to reduce data center operations cost 10, 000 x 100 metrics/minute -> 10+GB/day WODA '09 31
Statistical Debugging (Liblit et al. PLDI’ 03) n Algorithm sketch 1) 2) n Cause & correlation n Collect code profiles for a large number of successful and failing runs of the program Find code fragments that strongly correlate with failure Correlation implies causation, a logical fallacy! Example : error handling code Statistical debugging – build a statistical model of program outcome that discriminates cause from correlation WODA '09 32
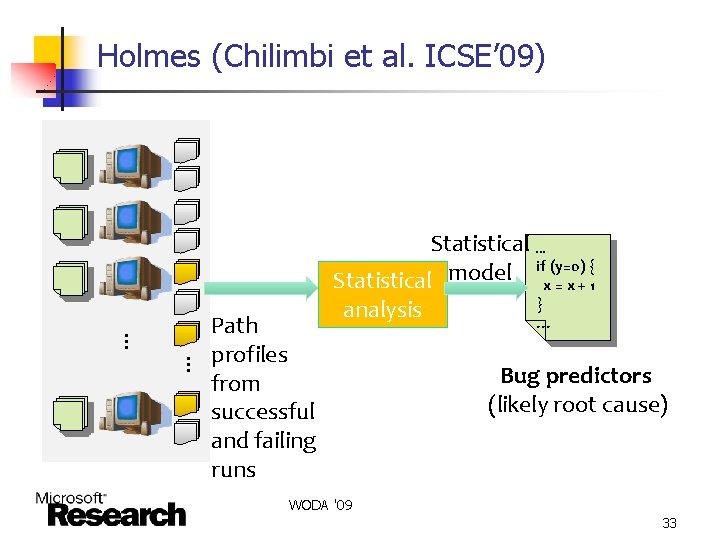
Holmes (Chilimbi et al. ICSE’ 09) Statistical model … … Path profiles from successful and failing runs analysis … if (y=0) { x=x+1 } … Bug predictors (likely root cause) WODA '09 33
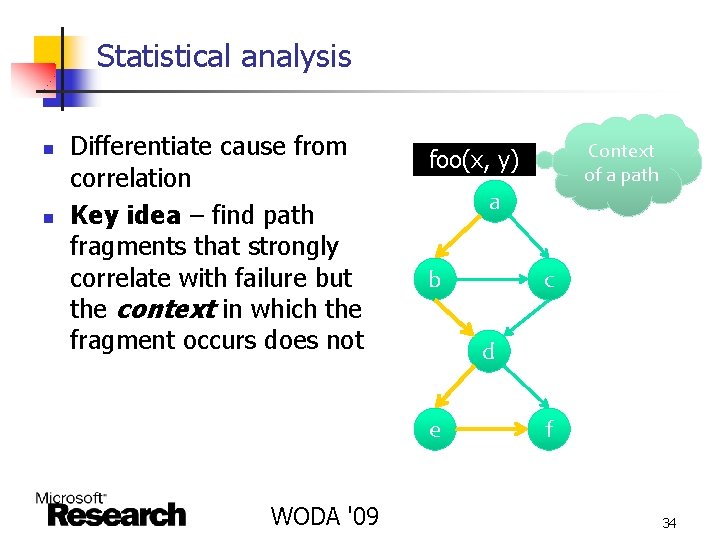
Statistical analysis n n Differentiate cause from correlation Key idea – find path fragments that strongly correlate with failure but the context in which the fragment occurs does not a b c d e WODA '09 Context of a path foo(x, y) f 34
Statistical model n Inputs n n n A set of path profiles, one for each run Each run’s outcome (success/failure) Compute four statistics for each path n n So(p), Fo(p) : number of successful/failing runs in which context of path p was executed Se(p), Fe(p) : number of successful/failing runs in which path p was executed WODA '09 35
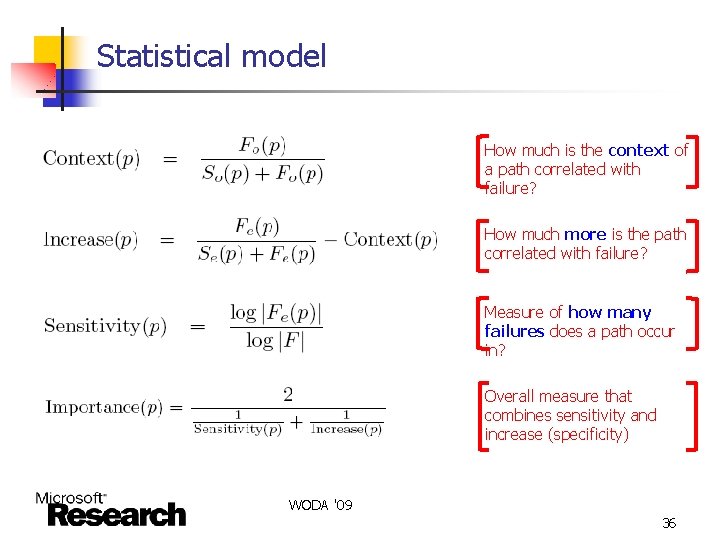
Statistical model How much is the context of a path correlated with failure? How much more is the path correlated with failure? Measure of how many failures does a path occur in? Overall measure that combines sensitivity and increase (specificity) WODA '09 36
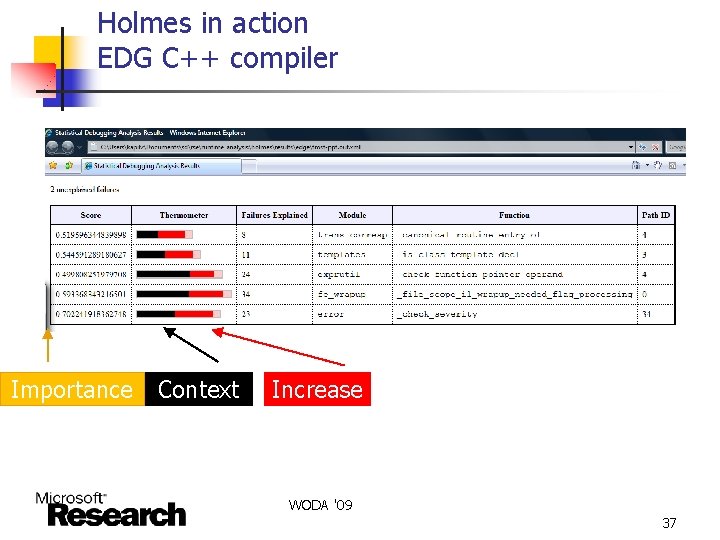
Holmes in action EDG C++ compiler Importance Context Increase WODA '09 37
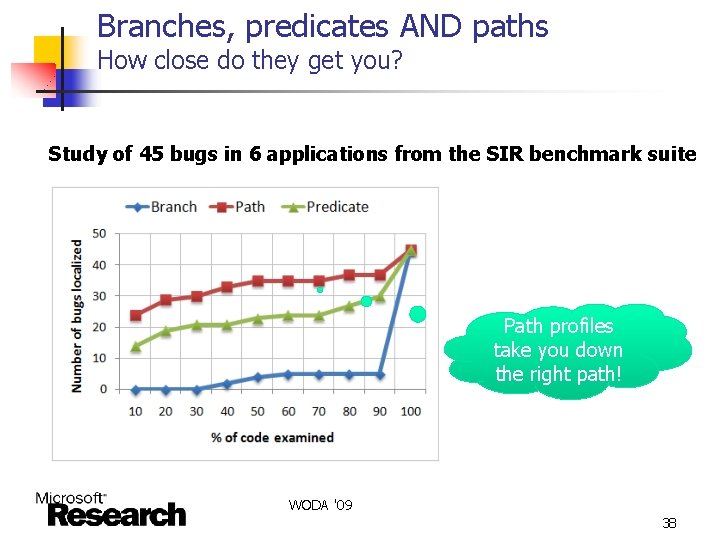
Branches, predicates AND paths How close do they get you? Study of 45 bugs in 6 applications from the SIR benchmark suite Path profiles take you down the right path! WODA '09 38
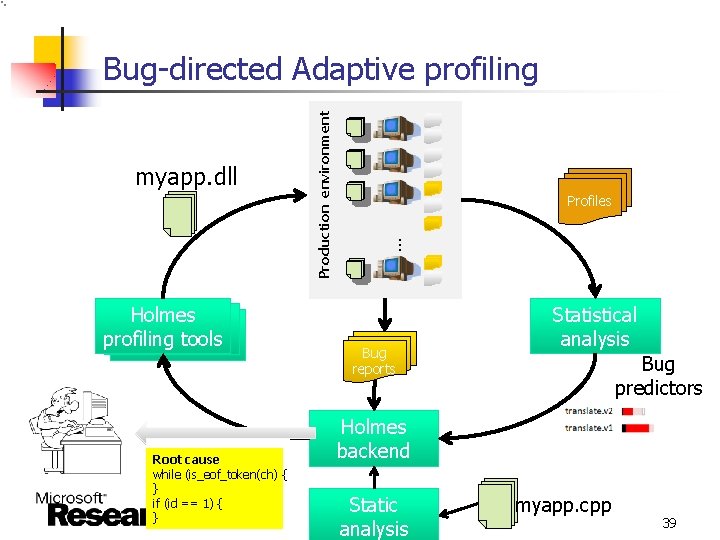
myapp. dll Root cause while (is_eof_token(ch) { } if (id == 1) { } Profiles … Holmes profiling tools Production environment Bug-directed Adaptive profiling Bug reports Statistical analysis Bug predictors Holmes backend Static analysis myapp. cpp 39
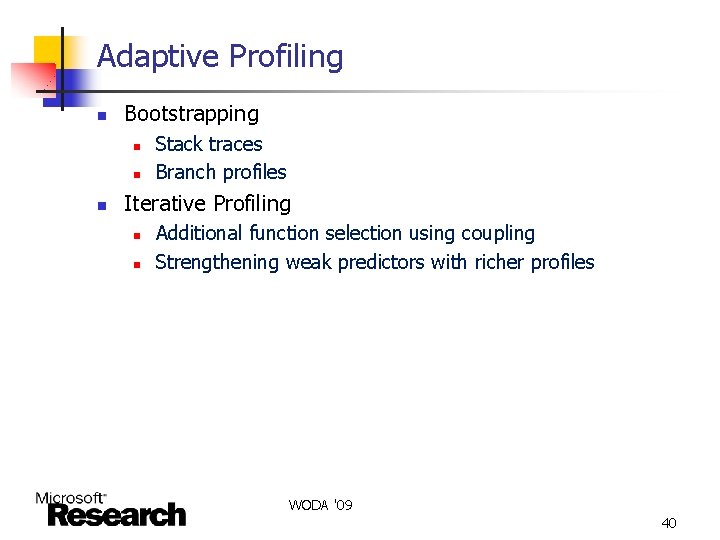
Adaptive Profiling n Bootstrapping n n n Stack traces Branch profiles Iterative Profiling n n Additional function selection using coupling Strengthening weak predictors with richer profiles WODA '09 40
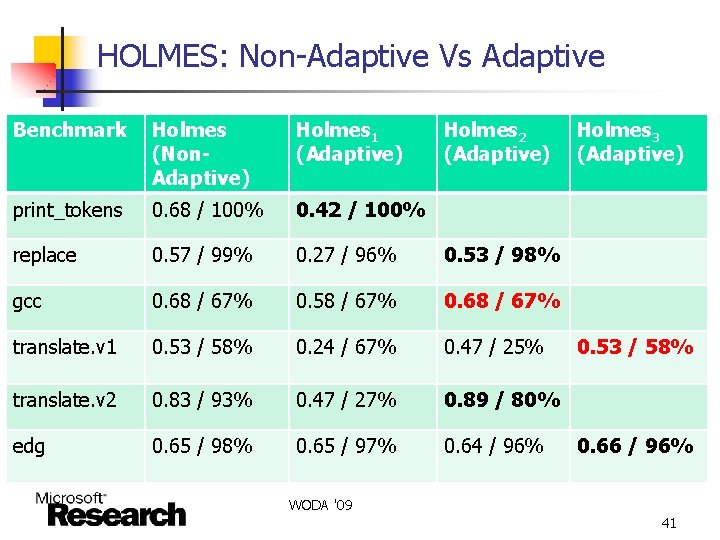
HOLMES: Non-Adaptive Vs Adaptive Benchmark Holmes (Non. Adaptive) Holmes 1 (Adaptive) Holmes 2 (Adaptive) print_tokens 0. 68 / 100% 0. 42 / 100% replace 0. 57 / 99% 0. 27 / 96% 0. 53 / 98% gcc 0. 68 / 67% 0. 58 / 67% 0. 68 / 67% translate. v 1 0. 53 / 58% 0. 24 / 67% 0. 47 / 25% translate. v 2 0. 83 / 93% 0. 47 / 27% 0. 89 / 80% edg 0. 65 / 98% 0. 65 / 97% 0. 64 / 96% Holmes 3 (Adaptive) 0. 53 / 58% 0. 66 / 96% WODA '09 41
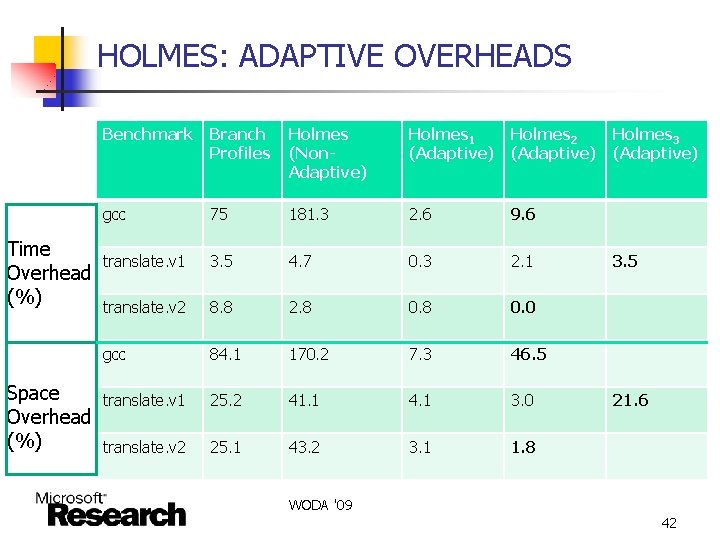
HOLMES: ADAPTIVE OVERHEADS Time Overhead (%) Space Overhead (%) Benchmark Branch Profiles Holmes (Non. Adaptive) Holmes 1 (Adaptive) Holmes 2 (Adaptive) gcc 75 181. 3 2. 6 9. 6 translate. v 1 3. 5 4. 7 0. 3 2. 1 translate. v 2 8. 8 2. 8 0. 0 gcc 84. 1 170. 2 7. 3 46. 5 translate. v 1 25. 2 41. 1 4. 1 3. 0 translate. v 2 25. 1 43. 2 3. 1 1. 8 Holmes 3 (Adaptive) 3. 5 21. 6 WODA '09 42
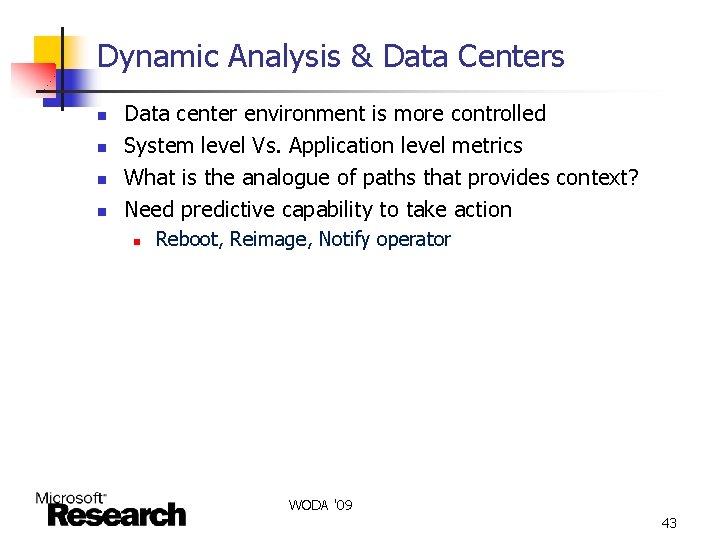
Dynamic Analysis & Data Centers n n Data center environment is more controlled System level Vs. Application level metrics What is the analogue of paths that provides context? Need predictive capability to take action n Reboot, Reimage, Notify operator WODA '09 43
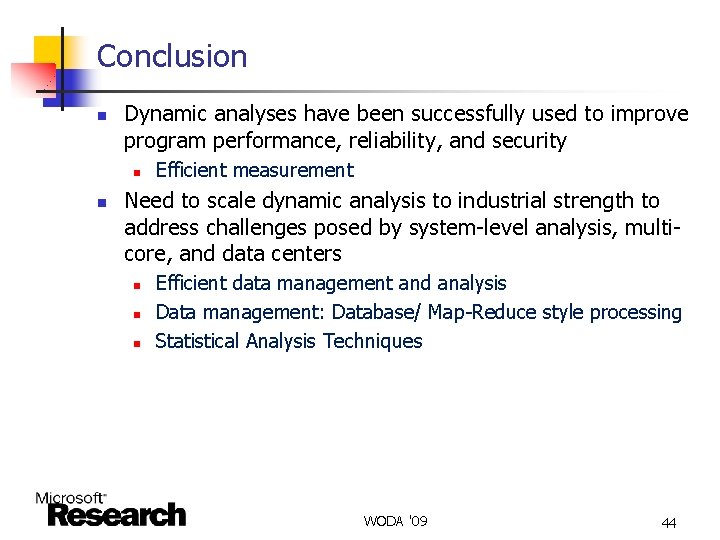
Conclusion n Dynamic analyses have been successfully used to improve program performance, reliability, and security n n Efficient measurement Need to scale dynamic analysis to industrial strength to address challenges posed by system-level analysis, multicore, and data centers n n n Efficient data management and analysis Data management: Database/ Map-Reduce style processing Statistical Analysis Techniques WODA '09 44
- Slides: 44