Durable Solutions Frameworks Understanding progress towards durable solutions

Durable Solutions Frameworks Understanding progress towards durable solutions

3 DURABLE SOLUTIONS PROCESSES TO SUPPORT INTEGRATION The quality of the process leading to durable solutions is a key element necessary for ensuring its sustainability Return / voluntary repatriation Local Integration Relocation / Resettlement INTEGRATION

IASC FRAMEWORK ON DURABLE SOLUTIONS FOR IDPs – the key reference and the most developed • Endorsed by the UN Human Rights Council in 2010 • Establish 8 durable solutions criteria : a set of benchmarks to inform efforts to monitor progress toward durable solutions • Establish a set of 9 principles to guide durable solutions processes

IASC 8 CRITERIA 1. Long-term safety and security 2. Adequate standard of living 3. Access to livelihoods and employment 4. Access to remedies and justice 5. Accessible mechanism for restoration of HLP 6. Personal and other documentation 7. Family reunification 8. Participation in public affairs Guidance and benchmarks to measure the level of achievement of durable solutions Criteria overlap and should be adapted to the national context

Government responsibility Continued protection Access for humanitarian and development initiatives and monitoring IASC Support for host communities Nondiscrimination Prohibition of coercion People’s rights, needs and interests are the primary concern IDPs’ Information, consultation and participation Respect for IDPs’ options

OPERATIONALIZING THE IASC FRAMEWORK Concerted data Common strategic directions Standardized monitoring and evaluation tools • Goal : Collaboration and coordination of all relevant actors for a resilience based durable solutions planning • How? to develop common durable solutions tools to be used by all relevant actors based on the internationally recognized IASC criteria • What? joint planning (including data collection), monitoring and evaluation

Re. DSS Solutions Framework to measure progress towards integration • A practical, analytical tool to assess to what extent durable solutions have been achieved in a particular context • Inclusive/ participatory process/ consensus building • Multi actors and sectors • Operationalization of IASC framework and its 8 criteria • 28 IASC indicators organized around physical, INDICATORS material and legal safety SOLUTIONS • Comparison to host communities FRAMEWORK • Traffic light system • Use of secondary data and reports – no new assessments conducted

MAIN CHALLENGES AND GAPS • Lack of common framework to plan for and monitor durable solutions • Poor performance monitoring of durable solutions programmes • Predominance of “soft” qualitative indicators • Lack of studies that establish baseline indicators to measure progress • Lack of economic indicators and data • Need for more development oriented tools and indicators Data collection and participatory planning Monitoring and evaluation Financing Programming Implementation

KEY CHALLENGES • Most data sources, measurements and ratings of the indicators reflect a context of humanitarian service provision that is determined by displacement status rather than an equal legal status to the national population. • This raises questions of the ‘quality’ of durable solutions available in contexts experiencing chronic crises, specifically in comparison to areas where local standards are already low. • This can confuse discussions around minimum standards where the local / host population may be worse off than displaced hosted in their area. • The lack of comparative data and analysis within and across displacement affected populations, and in comparison to local populations and national standard, is a key challenge. • Access to quantitative data on some indicators is really challenging due to lack of standardisation of data management and lack of a common framework.

Re. DSS FRAMEWORK: HOW TO USE IT? • As an analytical and programmatic tool • As a joint monitoring and evaluation tool to support coordination and to identify gaps • It provides common shared overall outcomes to be used as common analysis to inform planning

The solutions framework: a collaborative process through a consensus building approach Initiate the process and identify its aims and scope Gather all relevant actors Create a steering committe reflecting the diversity of DS actors Collect data based on the Re. DSS indicators Validate data and rate the level of achievement of DS for each indicator final validation and publication
 Indicators 1. SAFETY & SECURITY/ PROTECTION/ SOCIAL COHESION 6 Indicators")
Criteria Sub criteria (IASC) Indicators 1. SAFETY & SECURITY/ PROTECTION/ SOCIAL COHESION 6 Indicators Traffic light rating Green: DS can be REDSS FRAMEWORK : HOW DOES IT WORK? 2. ADEQUATE STANDARD OF LIVING/ ACCESS TO BASIC 6 indicators & SOCIAL SERVICES MATERIAL SAFETY 3. ACCESS TO LIVELIHOODS (JOB CREATION/ ECONOMIC OPPORTUNITIES) 4 indicators 4. RESTORATION OF HOUSING, LAND & PROPERTY 4 Indicators 5. ACCESS TO EFFECTIVE REMEDIES AND JUSTICE 3 Indicators 6. PARTICIPATION IN PUBLIC AFFAIRS 3 Indicators 7. ACCESS TO DOCUMENTATION 2 Indicators 8. FAMILY REUNIFICATION 3 Indicators achieved Orange: Benchmark for DS has not been met Red: Benchmark are far from being met White: Data missing LEGAL SAFETY The objective is to improve and standardize the generation and availability of relevant data and analysis to better and more consistently operationalize joint response plans based on evidence in the search of durable solution in East Africa.

Re. DSS Solutions Framework Guidance Manual Outline on how to conduct a solutions analysis using the Re. DSS Solutions Framework. The guidance manual can be used by anyone intending to undertake a solutions analysis using the Re. DSS Solutions Framework. a collaborative exercise involving a diverse range of stakeholders, including governmental actors and institutions, UN agencies, NGOs and academics. The process should also foster the meaningful engagement of displacement-affected communities. An overview of the different sections of the Solutions Framework Guidance Manual Section Overview of key terminologies and concepts – Page 5 Introduction to the Re. DSS Solutions Framework – Page 6 Planning a solutions analysis – Page 11 Key questions addressed What are durable solutions and how are they achieved? What are the core elements of solutions planning and programming Gathering and analyzing data – Page 15 What information needs to be gathered to… o …develop an understanding of the overall environment and the factors that may inhibit or enable solutions? o …measure and rate progress against the indicators in the Re. DSS Solutions Framework? What methods should be used to gather the above-mentioned information? Developing recommendations – Pg 31 How can findings be used to inform policies, strategic planning and the overall response to forced displacement? What is the Re. DSS Solutions Framework? What can it be used for? How does it fit within a broader solutions analysis process? What are the Re. DSS Solutions Framework’s limitations? When should a solutions analysis take place? What should be the focus of a solutions analysis (objectives, geography, population group)? Who should be involved in a solutions analysis process? How should they be mobilized and engaged?

Re. DSS Solutions programming guide- “Designing solutions-oriented programs” An accompanying guide to the Re. DSS Framework guidance manual on how to design programs and interventions that address the gaps identified in a solutions analysis. A solution analysis is a crucial step in understanding the extent to which the environment is conducive to solutions and the extent to which progress has been made to towards solutions. The solutions analysis will highlight areas/sectors where there are gaps and problems to address but it will not generate findings that will fully inform program design. Following on from a solutions analysis, agencies will need to design programs and interventions that address gaps and advance solutions- the programming guide provides support in this process. The durable solutions programming guide is presented in 3 sections: 1. Core elements of solutions-oriented programs: outlines general requirements of solutionsoriented programs. 2. Incorporating a solutions-focus into assessments: outlines the key areas of enquiry that should be incorporated into sector-specific assessments. 3. Solutions outcomes, indicators and illustrative activities: presents “solutions log frames” for each of the 8 IASC criteria that appear in the Re. DSS Solutions Framework. The programming guide includes guidance on incorporating a solutions focus into assessments and developing solutions-oriented log frames.

UN Somalia Area based Solutions analysis – Bay to better and more consistently operationalize (re)integration plans based on evidence Key findings and recommendations With the support of

Objectives and methodology • Review of existing assessments, data and programs to produce Solutions framework per district to inform multi-sectorial rights and needs based plans/ programs. First ones in October/November and second one in February/ March • Participatory process and consensus building approach – consultations with NGOs, clusters, humanitarian and development donors, UN, governments, etc • Validations workshops to discuss and review the indicators rating, key findings and preliminary recommendations- collectively agree on gaps and priorities building on existing humanitarian and development programmes to address the needs of displacement affected communities Developing Area Based Joint Solutions Analysis in Somalia to inform safe and dignified (re)integration modalities is paramount to address limited absorption capacity, limited access to basic services, shelters and livelihoods opportunities, prevailing protection concerns, and persistent security, safety and access issues

SOLUTIONS FRAMEWORK LOCAL INTEGRATION - RETURNEE/IDP FOCUS Bay – Somalia 2016/17 Analysis of Data: All population Safety and Security Protection PHYSICA L SAFETY Percentage of IDPs/returnees who have suffered violent crimes or experienced safety incidents, including Sexual Gender based Violence in the last 6 months compared to resident population Percentage of IDPs/returnees who do not face more discriminatory or arbitrary restriction of their freedom of movement based on their displacement or minority status compared to resident population Social Cohesion Percentage of IDPs/returnees who have adequate access to police and judiciary, when needed, compared to the resident population Percentage of IDPs/returnees feeling safe in their current place of residence compared to local population Percentage of IDPs/returnees who do not face any form of stigmatization (verbal violence, insults, exclusion, etc. ) in their current place of residence, compared to local population Percentage of IDPs/returnees feeling they are accepted in the community where they live compared to resident population Adequate Standard of Living (Access to basic and social services) Percentage of IDPs/returnees with food consumption comparable to local population and as per international/national standards Prevalence of GAM/SAM among IDPs/returnees compared to resident population and as per national/international standards Percentage of IDPs/returnees with adequate access to potable water, sanitation and hygiene compared to local population and above international/national standard Percentage of IDPs/returnees with adequate access to health care compared to resident population or national average as appropriate Percentage of IDP/returnee children with adequate access to formal education compared to resident population or national average as appropriate Percentage of IDPs/returnees who have adequate access to safety net interventions or receive remittances from abroad compared to local residents with comparable needs Access to Livelihoods (Job creation and income generation) MATERIAL SAFETY Percentage of IDPs/returnees who faces legal or administrative obstacles to employment or economic activity compared to resident Participation in public affairs population(Administrative obstacles exist) Unemployment among refugees compared to the resident population, the situation before displacement or the national average, as appropriate Percentage of IDPs/returnees who have access to sustainable employment conditions compared to local residents Poverty levels among IDPS/returnees compared to the resident population, the situation before displacement or the national average, as appropriate Housing, Land & Property Percentage of IDPs/returnees with adequate housing (not overcrowded housing/shelter and/or precarious structure and/or at risk of sudden eviction) in comparison to the resident population Existence of effective and accessible mechanisms to ensure access to land and/or secure tenure Access to Effective Remedies & Justice LEGAL SAFETY Percentage of IDPs/returnees who consider that the violations suffered have been effectively remedied and a sense of justice restored, compared to local population Percentage of IDPs/returnees with lost HLP who have had their claims resolved, compared to the resident population Participation in public affairs Existence of accessible mechanisms that have the legal mandate and actual capacity to provide IDPs/returnees with effective remedies for violations suffered, including violations committed by non-state actors Percentage of IDPs/returnees who accessed formal or informal/traditional justice mechanisms last time they needed it, compared to local population IDPs/returnees face no legal or administrative obstacles that prevent them from voting, being elected or working in public service compared with resident population Percentage of IDPs/returnees participating in community or social organizations (youth / women / environmental / sports groups and others) compared to the resident population Access to Documentation Existence and effective accessibility of mechanisms to obtain/replace documents for IDPs/returnees bearing in mind the local context Percentage of IDPs/returnees without birth certificates, national ID cards or other personal documents relevant to the local context compared to resident population or national average, as appropriate Family Reunification The number of unaccompanied and separated IDPs/returnee children for whom a best interest determination is needed but has not been conducted Percentage of IDPs/returnees who have secured right to Housing, Land Property (with documents to prove ownership/tenancy) compared to resident population Accessible and efficient mechanisms have been put in place to reunite IDP/returnee separated family members The number of IDP/returnee children or other dependent persons who have not yet been reunited with their families relative to total displaced population size The Regional Durable Solutions Secretariat (Re. DSS) operationalized the IASC Framework for Durable Solutions for IDPs to develop the Re. DSS Solutions framework for displacement affected communities. It comprises the 8 IASC criteria using 31 IASC indicators organized around physical, material and legal safety to measure durable solutions achievements in a particular context. The framework analysis serves as an evidence base to enable relevant stakeholders to work more effectively and consistently in the search and realization of durable solutions. This info graphic offers a snapshot in time to assess to what extent local integration for returnees and IDPs in Somalia have been achieved. Percentage of IDPs/returnees involved in public decision making processes, or local reconciliation/confidence-building initiatives (e. g. local peace committees, public debates, fora, cross-community activities and others) compared to resident population All indicators refer to the attainment of benchmarks for a refugee / returnee in comparison to the host community The indicator is well on the way to being achieved Some obstacles exist and the indicator has not been fully met The indicator is far from met Data unavailable Incomplete data exists

SOLUTIONS FRAMEWORK LOCAL INTEGRATION - RETURNEE/IDP FOCUS Bay – Somalia 2016/17 Analysis of Data: IDPs Protection PHYSICA L SAFETY Safety and Security Percentage of IDPs/returnees who have suffered violent crimes or experienced safety incidents, including Sexual Gender based Violence in the last 6 months compared to resident population Percentage of IDPs/returnees who do not face more discriminatory or arbitrary restriction of their freedom of movement based on their displacement or minority status compared to resident population Social Cohesion Percentage of IDPs/returnees who have adequate access to police and judiciary, when needed, compared to the resident population Percentage of IDPs/returnees feeling safe in their current place of residence compared to local population Percentage of IDPs/returnees who do not face any form of stigmatization (verbal violence, insults, exclusion, etc. ) in their current place of residence, compared to local population Percentage of IDPs/returnees feeling they are accepted in the community where they live compared to resident population Adequate Standard of Living (Access to basic and social services) Percentage of IDPs/returnees with food consumption comparable to local population and as per international/national standards Prevalence of GAM/SAM among IDPs/returnees compared to resident population and as per national/international standards Percentage of IDPs/returnees with adequate access to potable water, sanitation and hygiene compared to local population and above international/national standard Percentage of IDPs/returnees with adequate access to health care compared to resident population or national average as appropriate Percentage of IDP/returnee children with adequate access to formal education compared to resident population or national average as appropriate Percentage of IDPs/returnees who have adequate access to safety net interventions or receive remittances from abroad compared to local residents with comparable needs Access to Livelihoods (Job creation and income generation) MATERIAL SAFETY Percentage of IDPs/returnees who faces legal or administrative obstacles to employment or economic activity compared to resident Participation in public affairs population(Administrative obstacles exist) Unemployment among refugees compared to the resident population, the situation before displacement or the national average, as appropriate Percentage of IDPs/returnees who have access to sustainable employment conditions compared to local residents Poverty levels among IDPS/returnees compared to the resident population, the situation before displacement or the national average, as appropriate Housing, Land & Property Percentage of IDPs/returnees with adequate housing (not overcrowded housing/shelter and/or precarious structure and/or at risk of sudden eviction) in comparison to the resident population Existence of effective and accessible mechanisms to ensure access to land and/or secure tenure Access to Effective Remedies & Justice LEGAL SAFETY Percentage of IDPs/returnees who consider that the violations suffered have been effectively remedied and a sense of justice restored, compared to local population Percentage of IDPs/returnees with lost HLP who have had their claims resolved, compared to the resident population Participation in public affairs Existence of accessible mechanisms that have the legal mandate and actual capacity to provide IDPs/returnees with effective remedies for violations suffered, including violations committed by non-state actors Percentage of IDPs/returnees who accessed formal or informal/traditional justice mechanisms last time they needed it, compared to local population IDPs/returnees face no legal or administrative obstacles that prevent them from voting, being elected or working in public service compared with resident population Percentage of IDPs/returnees participating in community or social organizations (youth / women / environmental / sports groups and others) compared to the resident population Access to Documentation Existence and effective accessibility of mechanisms to obtain/replace documents for IDPs/returnees bearing in mind the local context Percentage of IDPs/returnees without birth certificates, national ID cards or other personal documents relevant to the local context compared to resident population or national average, as appropriate Family Reunification The number of unaccompanied and separated IDPs/returnee children for whom a best interest determination is needed but has not been conducted Percentage of IDPs/returnees who have secured right to Housing, Land Property (with documents to prove ownership/tenancy) compared to resident population Accessible and efficient mechanisms have been put in place to reunite IDP/returnee separated family members The number of IDP/returnee children or other dependent persons who have not yet been reunited with their families relative to total displaced population size The Regional Durable Solutions Secretariat (Re. DSS) operationalized the IASC Framework for Durable Solutions for IDPs to develop the Re. DSS Solutions framework for displacement affected communities. It comprises the 8 IASC criteria using 31 IASC indicators organized around physical, material and legal safety to measure durable solutions achievements in a particular context. The framework analysis serves as an evidence base to enable relevant stakeholders to work more effectively and consistently in the search and realization of durable solutions. This info graphic offers a snapshot in time to assess to what extent local integration for returnees and IDPs in Somalia have been achieved. Percentage of IDPs/returnees involved in public decision making processes, or local reconciliation/confidence-building initiatives (e. g. local peace committees, public debates, fora, cross-community activities and others) compared to resident population All indicators refer to the attainment of benchmarks for a refugee / returnee in comparison to the host community The indicator is well on the way to being achieved Some obstacles exist and the indicator has not been fully met The indicator is far from met Data unavailable Incomplete data exists

SOLUTIONS FRAMEWORK LOCAL INTEGRATION - RETURNEE/IDP FOCUS Bay – Somalia 2016/17 Analysis of Data: Returnees Protection PHYSICA L SAFETY Safety and Security Percentage of IDPs/returnees who have suffered violent crimes or experienced safety incidents, including Sexual Gender based Violence in the last 6 months compared to resident population Percentage of IDPs/returnees who do not face more discriminatory or arbitrary restriction of their freedom of movement based on their displacement or minority status compared to resident population Social Cohesion Percentage of IDPs/returnees who have adequate access to police and judiciary, when needed, compared to the resident population Percentage of IDPs/returnees feeling safe in their current place of residence compared to local population Percentage of IDPs/returnees who do not face any form of stigmatization (verbal violence, insults, exclusion, etc. ) in their current place of residence, compared to local population Percentage of IDPs/returnees feeling they are accepted in the community where they live compared to resident population Adequate Standard of Living (Access to basic and social services) Percentage of IDPs/returnees with food consumption comparable to local population and as per international/national standards Prevalence of GAM/SAM among IDPs/returnees compared to resident population and as per national/international standards Percentage of IDPs/returnees with adequate access to potable water, sanitation and hygiene compared to local population and above international/national standard Percentage of IDPs/returnees with adequate access to health care compared to resident population or national average as appropriate Percentage of IDP/returnee children with adequate access to formal education compared to resident population or national average as appropriate Percentage of IDPs/returnees who have adequate access to safety net interventions or receive remittances from abroad compared to local residents with comparable needs Access to Livelihoods (Job creation and income generation) MATERIAL SAFETY Percentage of IDPs/returnees who faces legal or administrative obstacles to employment or economic activity compared to resident Participation in public affairs population(Administrative obstacles exist) Unemployment among returnees compared to the resident population, the situation before displacement or the national average, as appropriate Percentage of IDPs/returnees who have access to sustainable employment conditions compared to local residents Poverty levels among IDPS/returnees compared to the resident population, the situation before displacement or the national average, as appropriate Housing, Land & Property Percentage of IDPs/returnees with adequate housing (not overcrowded housing/shelter and/or precarious structure and/or at risk of sudden eviction) in comparison to the resident population Existence of effective and accessible mechanisms to ensure access to land and/or secure tenure Access to Effective Remedies & Justice LEGAL SAFETY Percentage of IDPs/returnees who consider that the violations suffered have been effectively remedied and a sense of justice restored, compared to local population Percentage of IDPs/returnees with lost HLP who have had their claims resolved, compared to the resident population Participation in public affairs Existence of accessible mechanisms that have the legal mandate and actual capacity to provide IDPs/returnees with effective remedies for violations suffered, including violations committed by non-state actors Percentage of IDPs/returnees who accessed formal or informal/traditional justice mechanisms last time they needed it, compared to local population IDPs/returnees face no legal or administrative obstacles that prevent them from voting, being elected or working in public service compared with resident population Percentage of IDPs/returnees participating in community or social organizations (youth / women / environmental / sports groups and others) compared to the resident population Access to Documentation Existence and effective accessibility of mechanisms to obtain/replace documents for IDPs/returnees bearing in mind the local context Percentage of IDPs/returnees without birth certificates, national ID cards or other personal documents relevant to the local context compared to resident population or national average, as appropriate Family Reunification The number of unaccompanied and separated IDPs/returnee children for whom a best interest determination is needed but has not been conducted Percentage of IDPs/returnees who have secured right to Housing, Land Property (with documents to prove ownership/tenancy) compared to resident population Accessible and efficient mechanisms have been put in place to reunite IDP/returnee separated family members The number of IDP/returnee children or other dependent persons who have not yet been reunited with their families relative to total displaced population size The Regional Durable Solutions Secretariat (Re. DSS) operationalized the IASC Framework for Durable Solutions for IDPs to develop the Re. DSS Solutions framework for displacement affected communities. It comprises the 8 IASC criteria using 31 IASC indicators organized around physical, material and legal safety to measure durable solutions achievements in a particular context. The framework analysis serves as an evidence base to enable relevant stakeholders to work more effectively and consistently in the search and realization of durable solutions. This info graphic offers a snapshot in time to assess to what extent local integration for returnees and IDPs in Somalia have been achieved. Percentage of IDPs/returnees involved in public decision making processes, or local reconciliation/confidence-building initiatives (e. g. local peace committees, public debates, fora, cross-community activities and others) compared to resident population All indicators refer to the attainment of benchmarks for a refugee / returnee in comparison to the host community The indicator is well on the way to being achieved Some obstacles exist and the indicator has not been fully met The indicator is far from met Data unavailable Incomplete data exists

SOLUTIONS FRAMEWORK LOCAL INTEGRATION - RETURNEE/IDP FOCUS Bay – Somalia 2016/17 Overall Rating Protection PHYSICA L SAFETY Safety and Security Percentage of IDPs/returnees who have suffered violent crimes or experienced safety incidents, including Sexual Gender based Violence in the last 6 months compared to resident population Percentage of IDPs/returnees who do not face more discriminatory or arbitrary restriction of their freedom of movement based on their displacement or minority status compared to resident population Social Cohesion Percentage of IDPs/returnees who have adequate access to police and judiciary, when needed, compared to the resident population Percentage of IDPs/returnees feeling safe in their current place of residence compared to local population Percentage of IDPs/returnees who do not face any form of stigmatization (verbal violence, insults, exclusion, etc. ) in their current place of residence, compared to local population Percentage of IDPs/returnees feeling they are accepted in the community where they live compared to resident population Adequate Standard of Living (Access to basic and social services) Percentage of IDPs/returnees with food consumption comparable to local population and as per international/national standards Prevalence of GAM/SAM among IDPs/returnees compared to resident population and as per national/international standards Percentage of IDPs/returnees with adequate access to potable water, sanitation and hygiene compared to local population and as per international/national standard Percentage of IDPs/returnees with adequate access to health care compared to resident population or national average as appropriate Percentage of IDP/returnee children with adequate access to formal education compared to resident population or national average as appropriate Percentage of IDPs/returnees who have adequate access to safety net interventions or receive remittances from abroad compared to local residents with comparable needs Access to Livelihoods (Job creation and income generation) MATERIAL SAFETY Percentage of IDPs/returnees who faces legal or administrative obstacles to employment or Participation in public affairs economic activity compared to resident population Unemployment among returnees compared to the resident population, the situation before displacement or the national average, as appropriate Percentage of IDPs/returnees who have access to sustainable employment conditions compared to local residents Poverty levels among IDPS/returnees compared to the resident population, the situation before displacement or the national average, as appropriate Housing, Land & Property Percentage of IDPs/returnees with adequate housing (not overcrowded housing/shelter and/or precarious structure and/or at risk of sudden eviction) in comparison to the resident population Existence of effective and accessible mechanisms to ensure access to land and/or secure tenure Access to Effective Remedies & Justice LEGAL SAFETY Percentage of IDPs/returnees who consider that the violations suffered have been effectively remedied and a sense of justice restored, compared to local population Percentage of IDPs/returnees with lost HLP who have had their claims resolved, compared to the resident population Percentage of IDPs/returnees who have secured right to Housing, Land Property (with documents to prove ownership/tenancy) compared to resident population Participation in public affairs Existence of accessible mechanisms that have the legal mandate and actual capacity to provide IDPs/returnees with effective remedies for violations suffered, including violations committed by non-state actors Percentage of IDPs/returnees who accessed formal or informal/traditional justice mechanisms last time they needed it, compared to local population IDPs/returnees face no legal or administrative obstacles that prevent them from voting, being elected or working in public service compared with resident population Percentage of IDPs/returnees participating in community or social organizations (youth / women / environmental / sports groups and others) compared to the resident population Access to Documentation Existence and effective accessibility of mechanisms to obtain/replace documents for IDPs/returnees bearing in mind the local context Percentage of IDPs/returnees without birth certificates, national ID cards or other personal documents relevant to the local context compared to resident population or national average, as appropriate Percentage of IDPs/returnees involved in public decision making processes, or local reconciliation/confidence-building initiatives (e. g. local peace committees, public debates, fora, cross-community activities and others) compared to resident population All indicators refer to the attainment of benchmarks for a refugee / returnee in comparison to the host community The indicator is well on the way to being achieved Family Reunification The number of unaccompanied and separated IDPs/returnee children for whom a best interest determination is needed but has not been conducted Accessible and efficient mechanisms have been put in place to reunite IDP/returnee separated family members The number of IDP/returnee children or other dependent persons who have not yet been reunited with their families relative to total displaced population size The Regional Durable Solutions Secretariat (Re. DSS) operationalized the IASC Framework for Durable Solutions for IDPs to develop the Re. DSS Solutions framework for displacement affected communities. It comprises the 8 IASC criteria using 31 IASC indicators organized around physical, material and legal safety to measure durable solutions achievements in a particular context. The framework analysis serves as an evidence base to enable relevant stakeholders to work more effectively and consistently in the search and realization of durable solutions. This info graphic offers a snapshot in time to assess to what extent local integration for returnees and IDPs in Somalia have been achieved. Some obstacles exist and the indicator has not been fully met The indicator is far from met Data unavailable Incomplete data exists
integration needs for displacement affected communities inform medium/long")
UN Somalia Recommendations to: prioritize ‘immediate’ (re)integration needs for displacement affected communities inform medium/long term sectorial priorities of development programing complementing humanitarian interventions Identify synergies between emergency response and resilience/development/governance interventions A. Core elements B. Adopting a joint integrated and multi sectorial programing C. Adopting a stronger focus on ‘early solutions’ D. Prioritizing sectors and areas of interventions through integrated and multi sectorial programing:

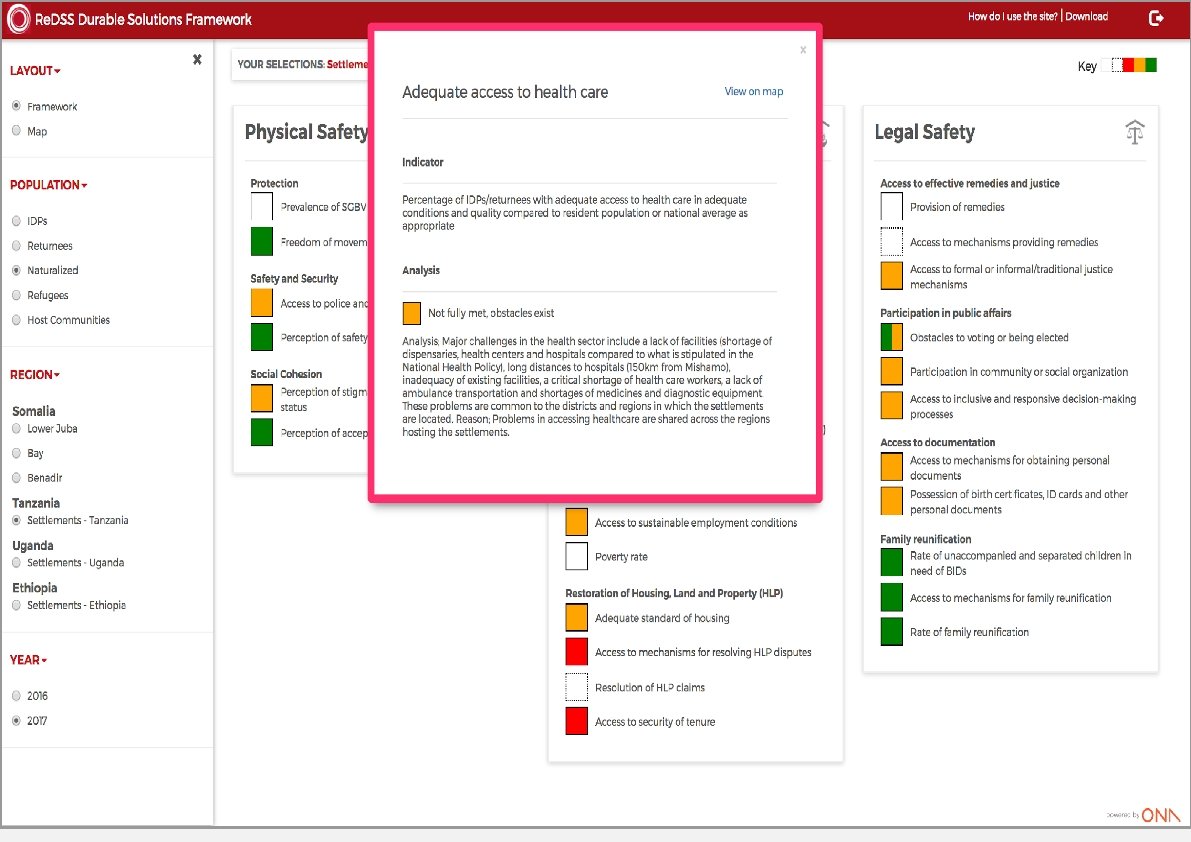
Re. DSS SOLUTIONS DASHBOARD Online visualization of Re. DSS solutions indicators to inform durable solution programing based on indicator rating and analysis To access the solutions dashboard: http: //redss. onalabs. org/ and the password is redss. For the help guide/ tutorial: http: //redss-helpsite. onalabs. org/
- Slides: 23